#BigData
190 articles tagged with #BigData

Data Analytics Roadmap for Beginners in 2026
Step-by-step roadmap to become a data analyst from scratch — no prior experience needed.

Data Science vs Data Analytics vs Data Engineering
A comprehensive guide to data science vs data analytics vs data engineering — written for learners at every level.

How to Become a Data Analyst From Scratch
A comprehensive guide to how to become a data analyst from scratch — written for learners at every level.

Top 10 Data Science Projects for Your Portfolio
A comprehensive guide to top 10 data science projects for your portfolio — written for learners at every level.
Pandas for Beginners: A Complete Tutorial
A comprehensive guide to pandas for beginners: a complete tutorial — written for learners at every level.
SQL Tutorial for Beginners with Examples
Master SQL with simple examples and real-world queries. Perfect for aspiring data analysts.
NumPy for Data Science: Arrays and Vectorisation
NumPy is the foundation of Python's scientific computing stack. This guide covers ndarrays, vectorised operations, broadcasting, linear algebra, and why NumPy is 10-100x faster than equivalent Python loops — with practical examples for data science work.
Matplotlib and Seaborn: Data Visualisation in Python
The best data insight is worthless if no one understands the chart. This guide covers matplotlib's core API, Seaborn's statistical plots, best practices for clear design, and how to produce publication-quality figures — from first plot to polished dashboard chart.
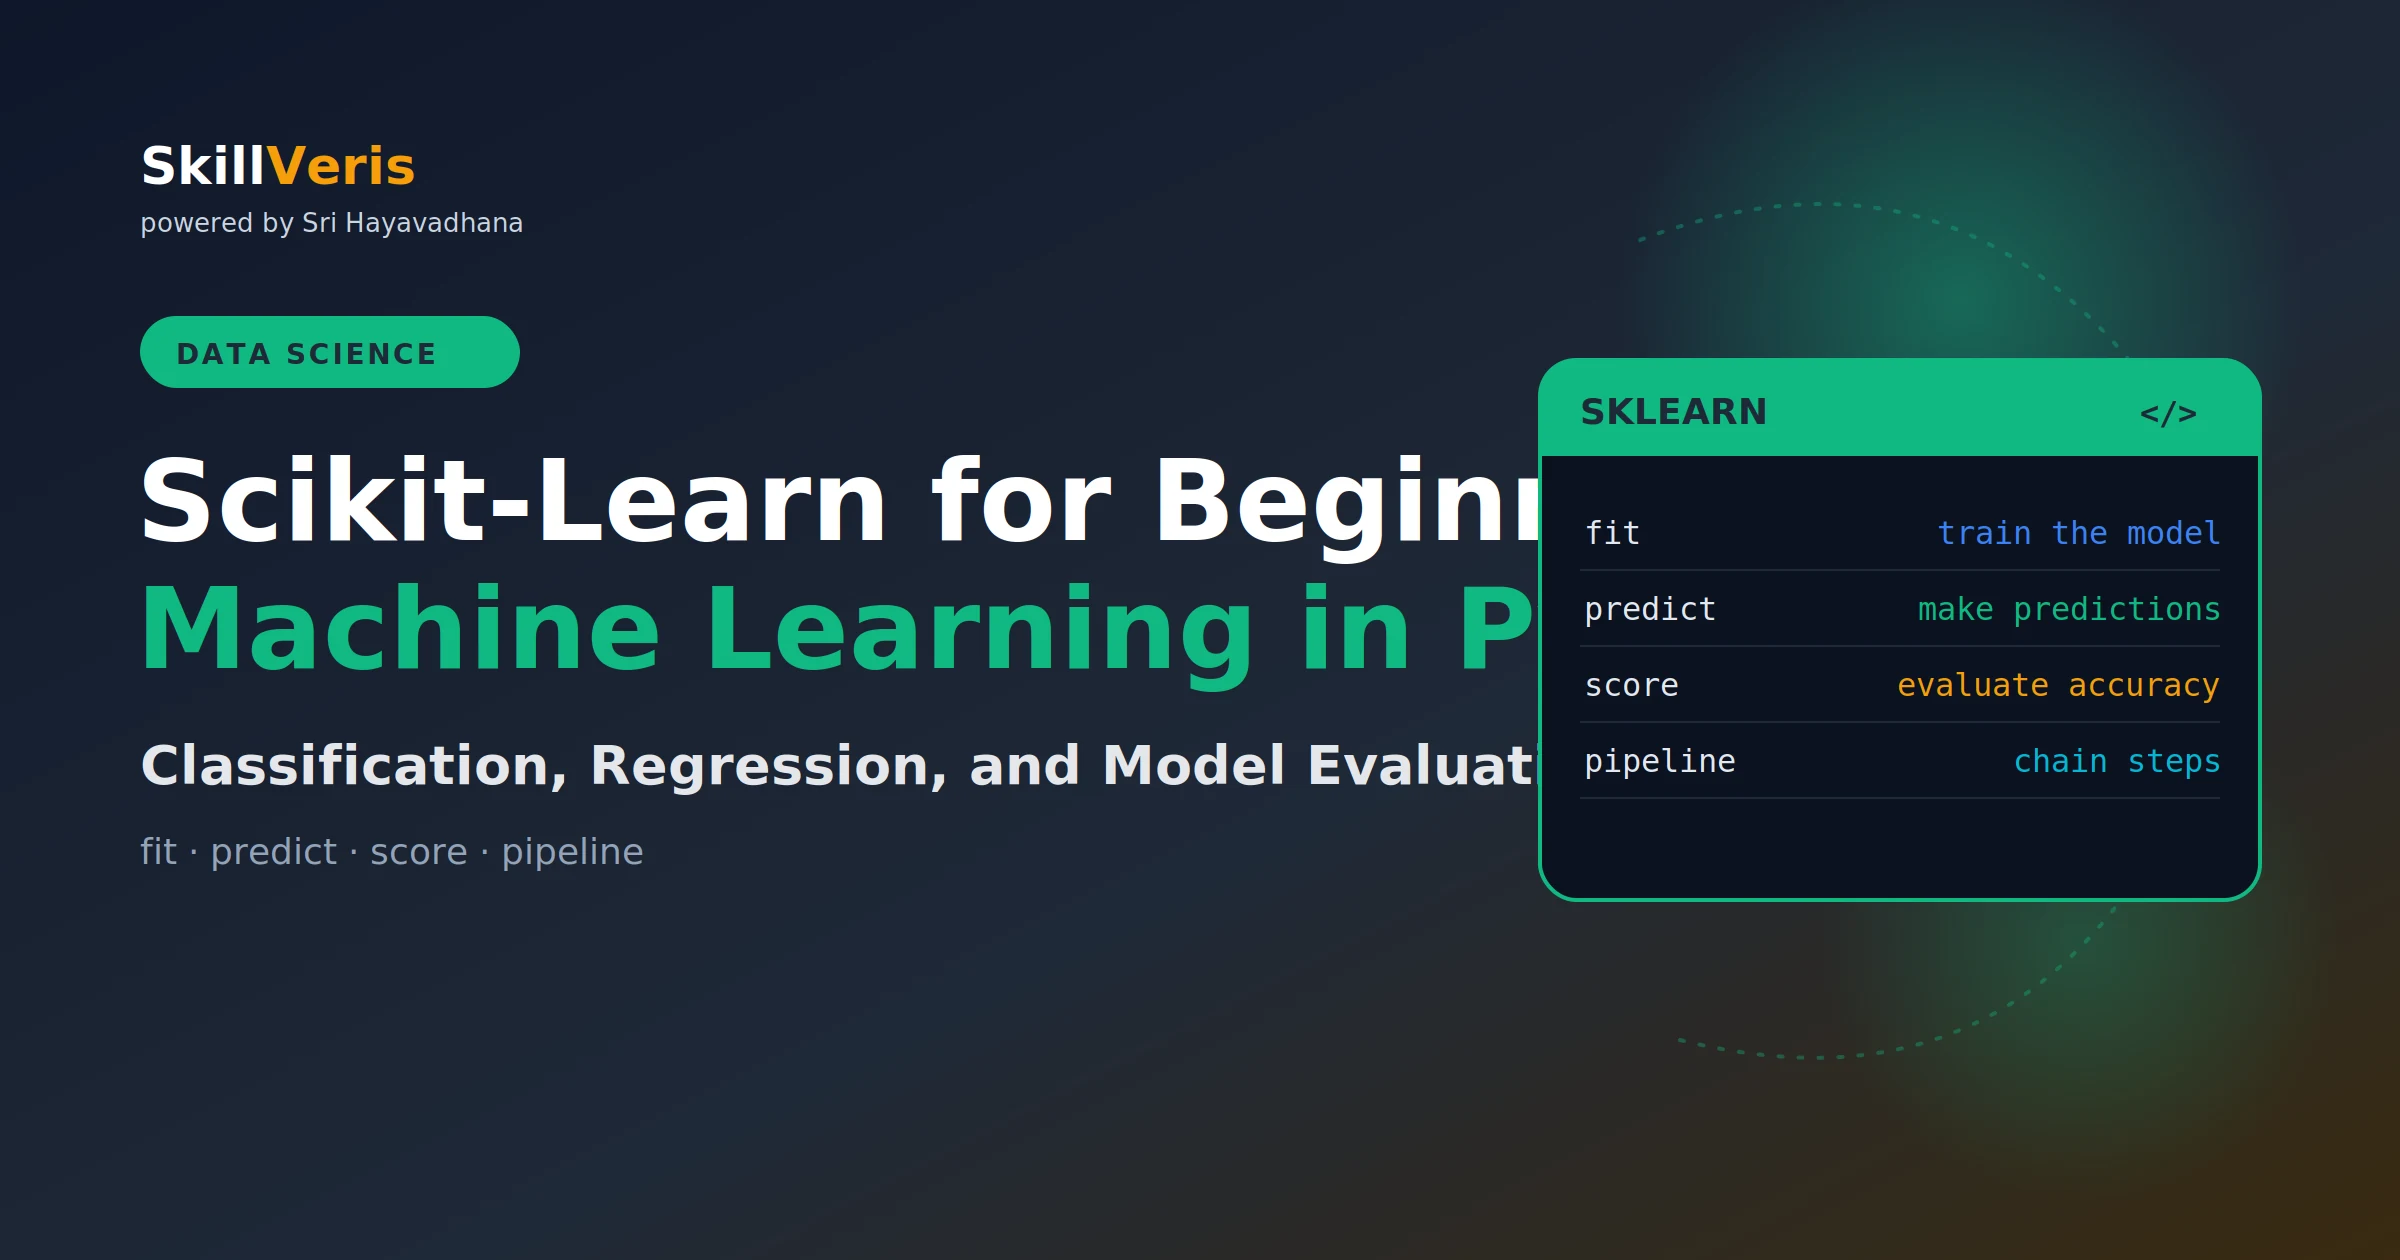
Scikit-Learn for Beginners: Machine Learning in Python
Scikit-learn is the most widely used Python library for classical machine learning. This guide covers the fit-predict workflow, train/test splits, classification, regression, model evaluation, feature engineering, and pipelines — everything you need to build and evaluate your first ML models.
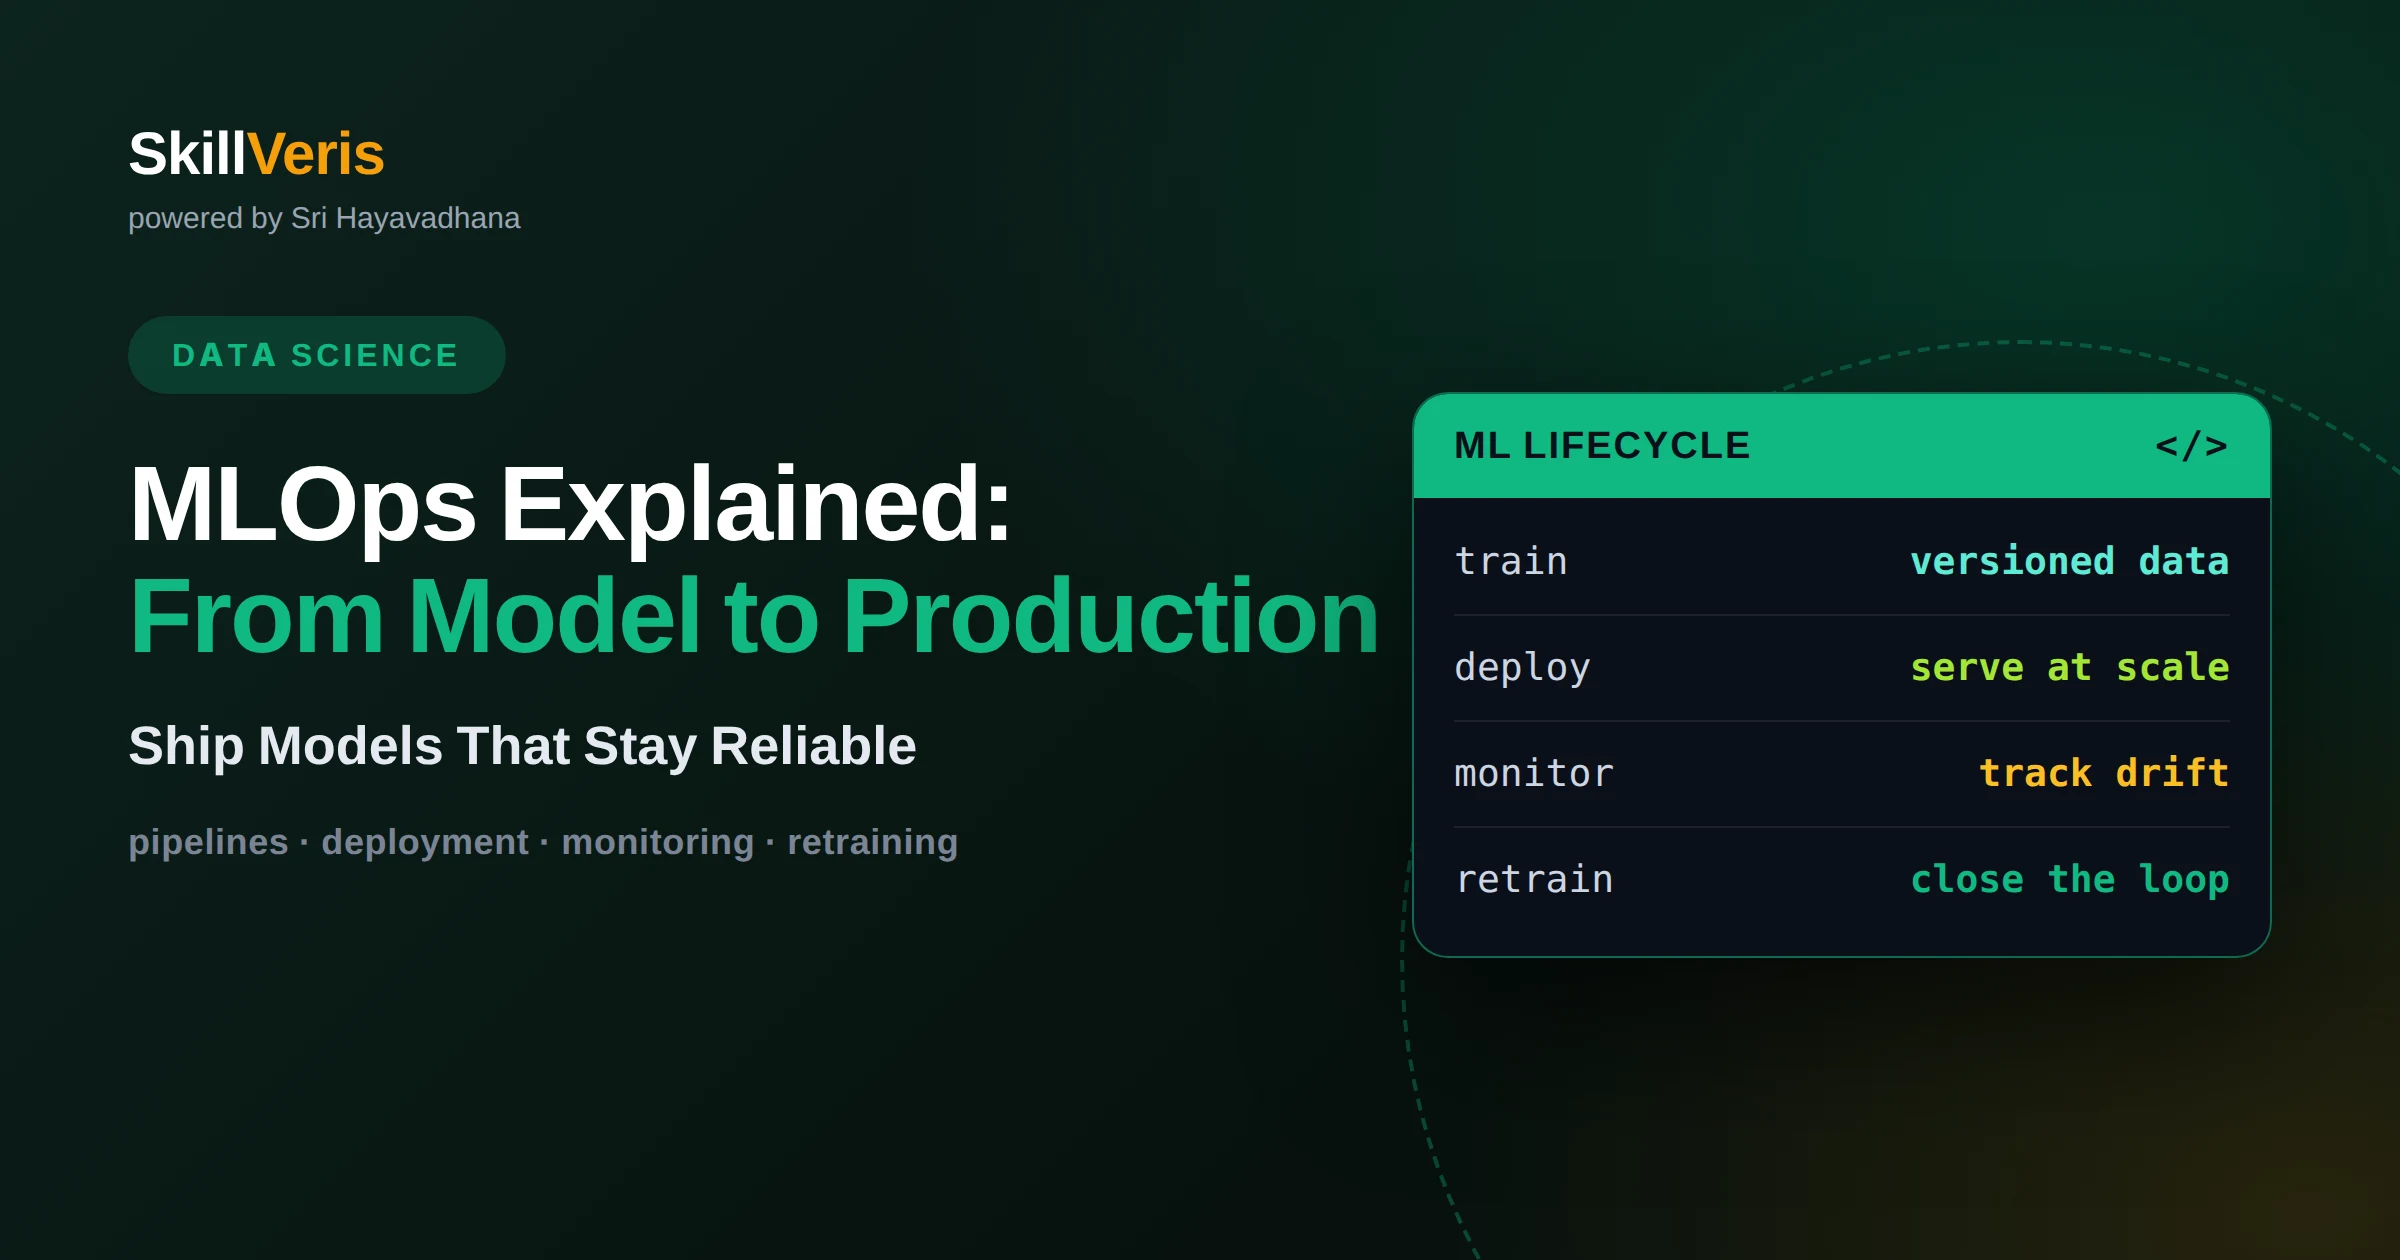
MLOps Explained: From Model to Production
Learn how MLOps turns a trained model into a reliable production service, covering pipelines, CI/CD, model registries, monitoring, and drift detection.
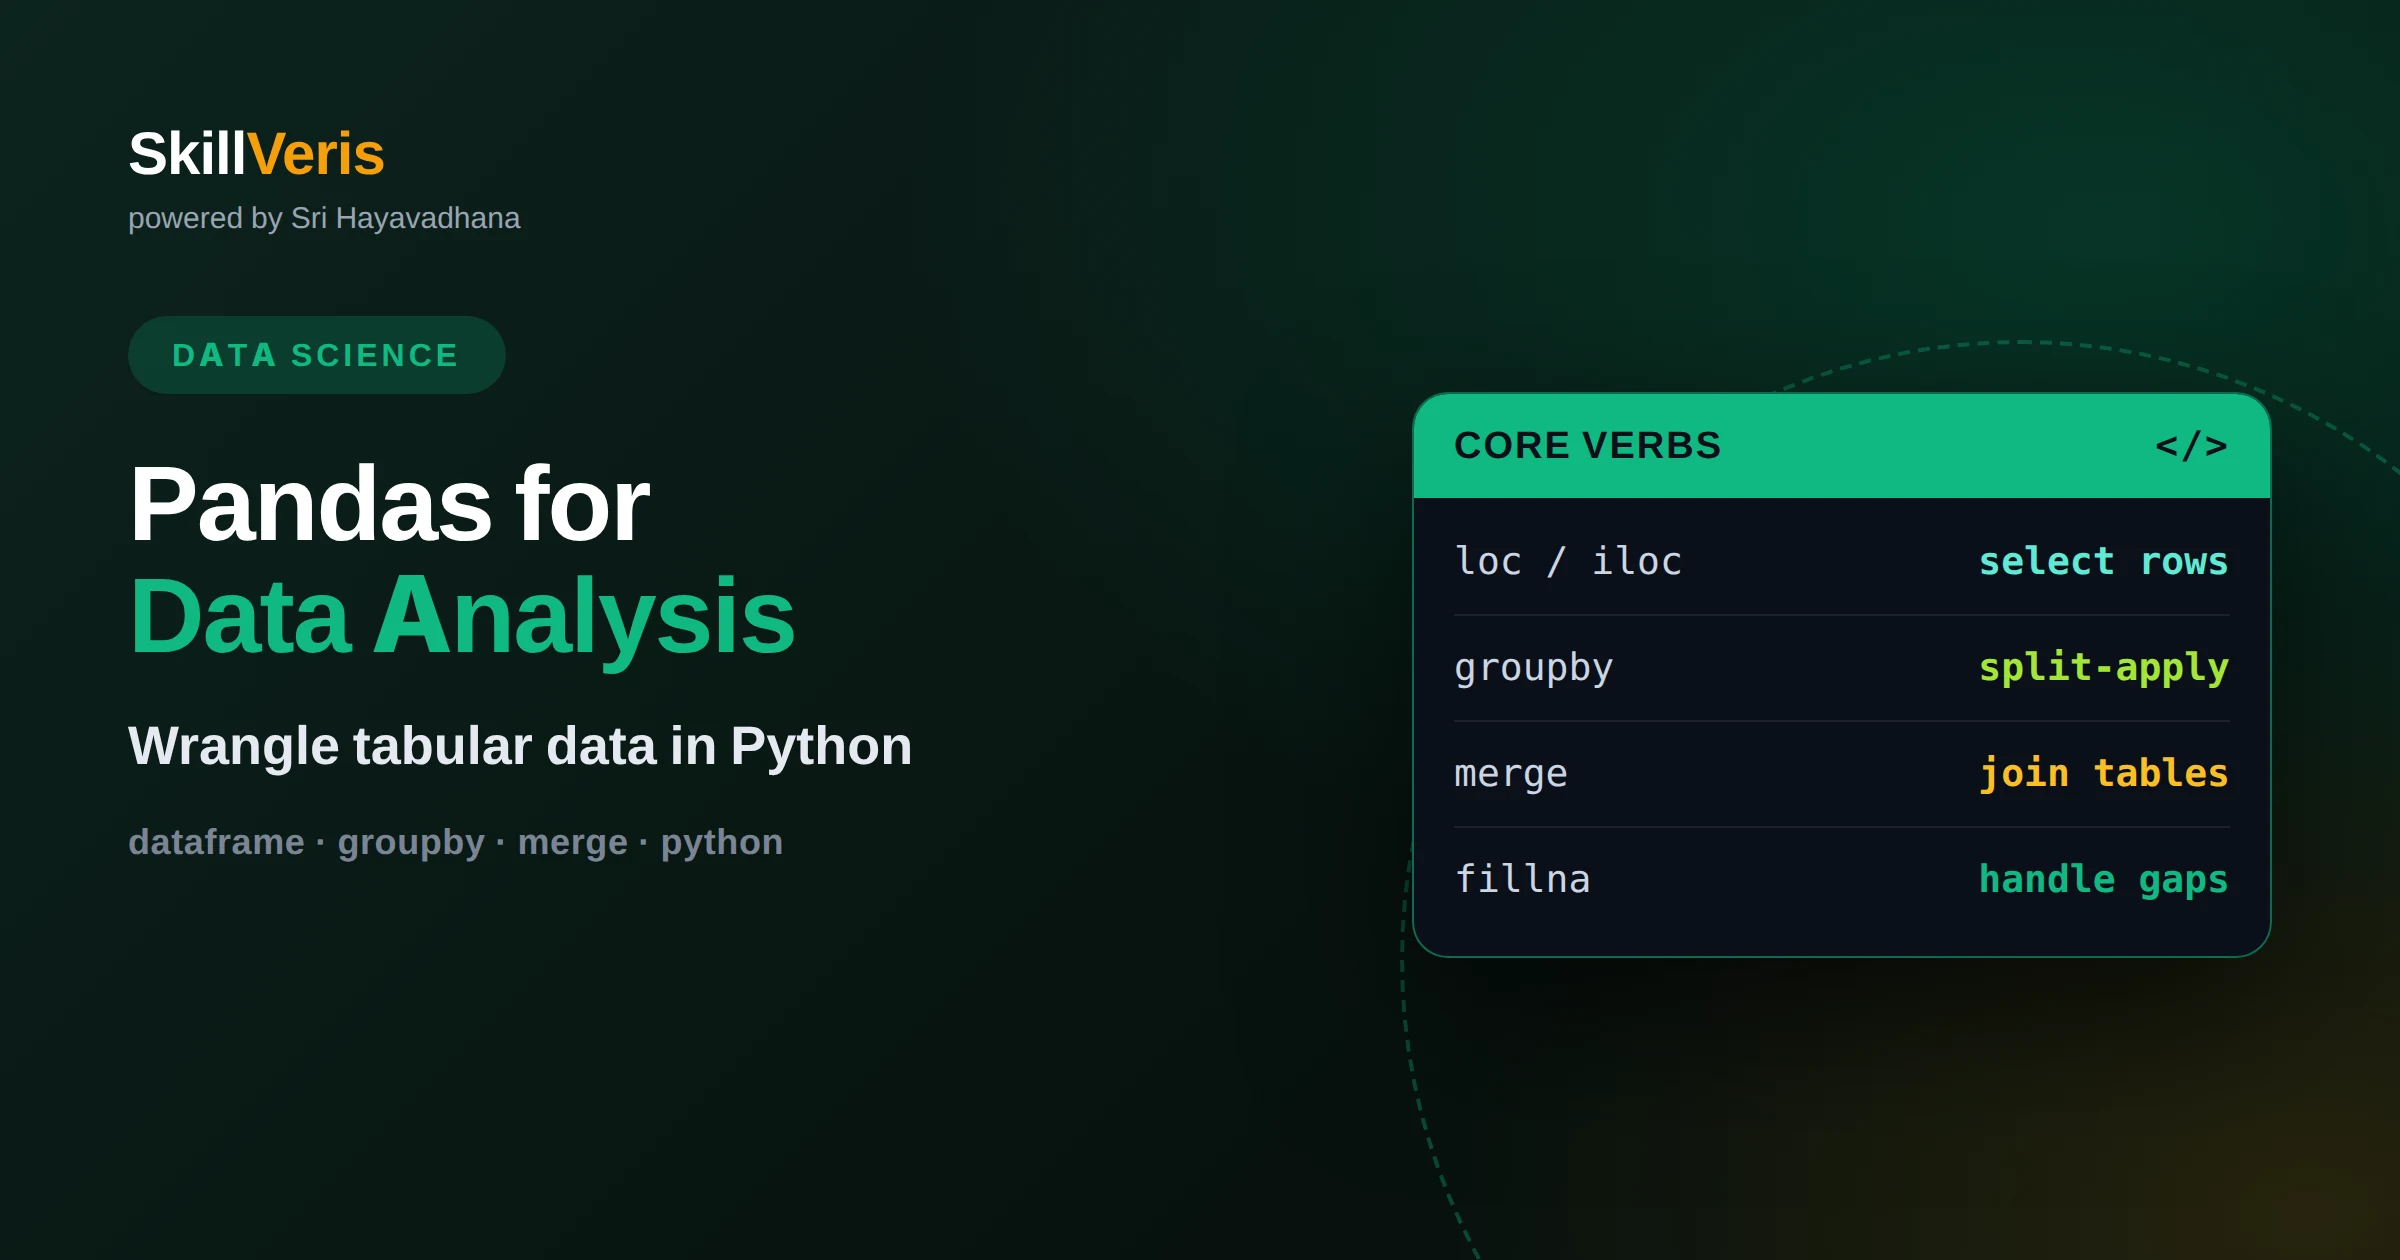
Pandas for Data Analysis: A Complete Guide
Pandas is the Python library for working with tabular data. Learn DataFrames, selection, cleaning, grouping, and joins to analyze real datasets with confidence.
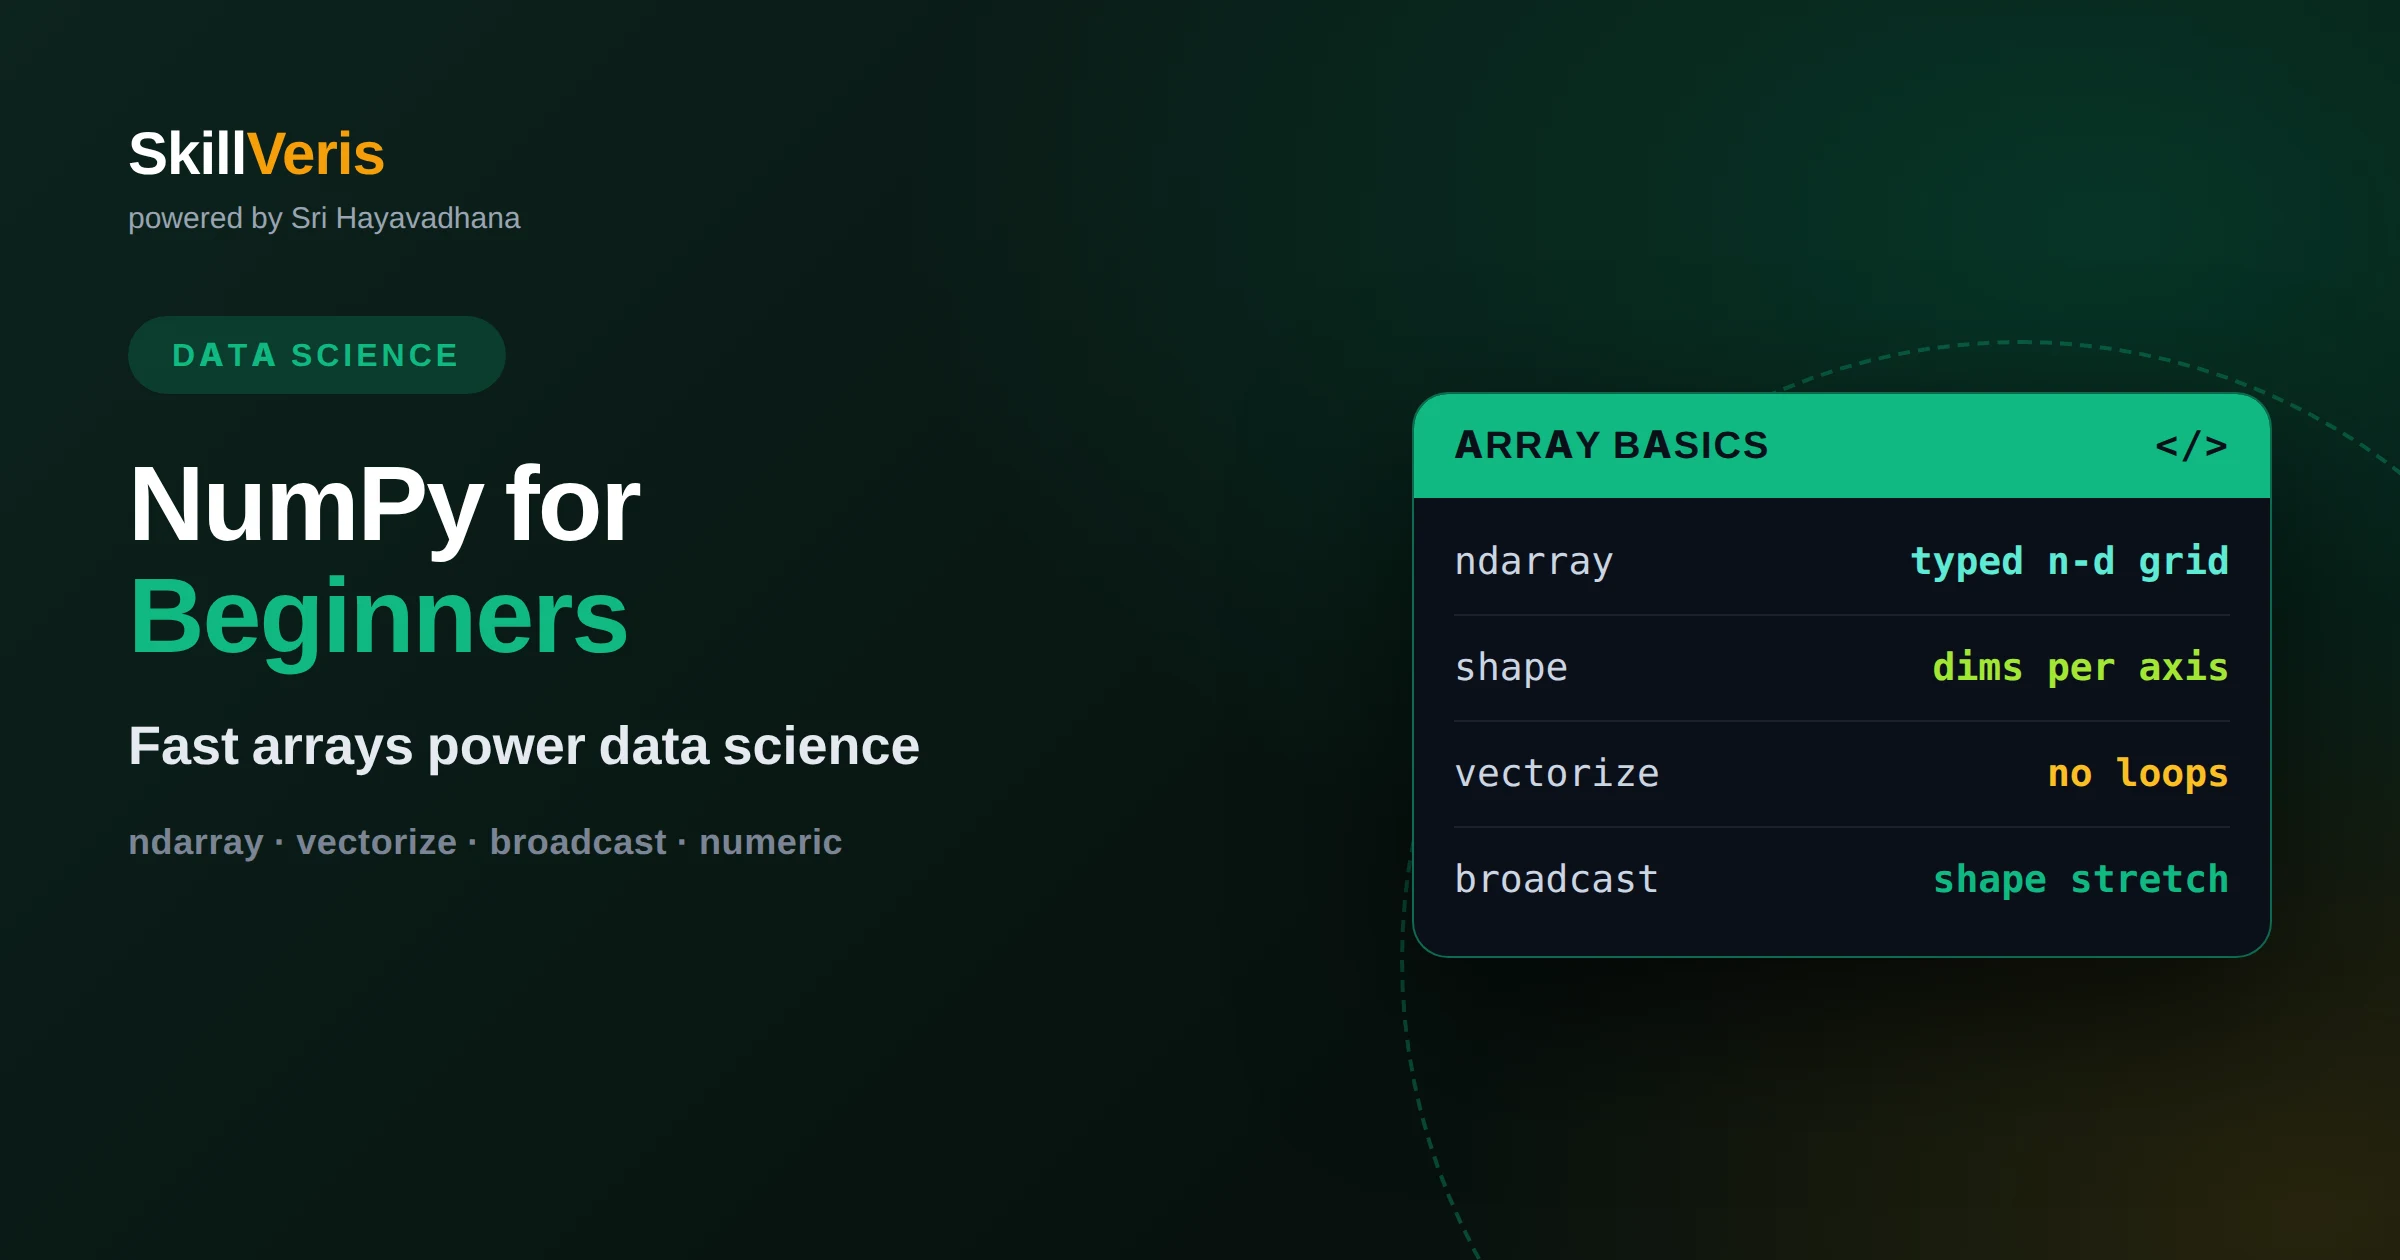
NumPy for Beginners: The Foundation of Data Science
NumPy powers Python's entire data science stack with fast numerical arrays. Learn arrays, vectorization, broadcasting, and indexing to compute at scale with clean code.
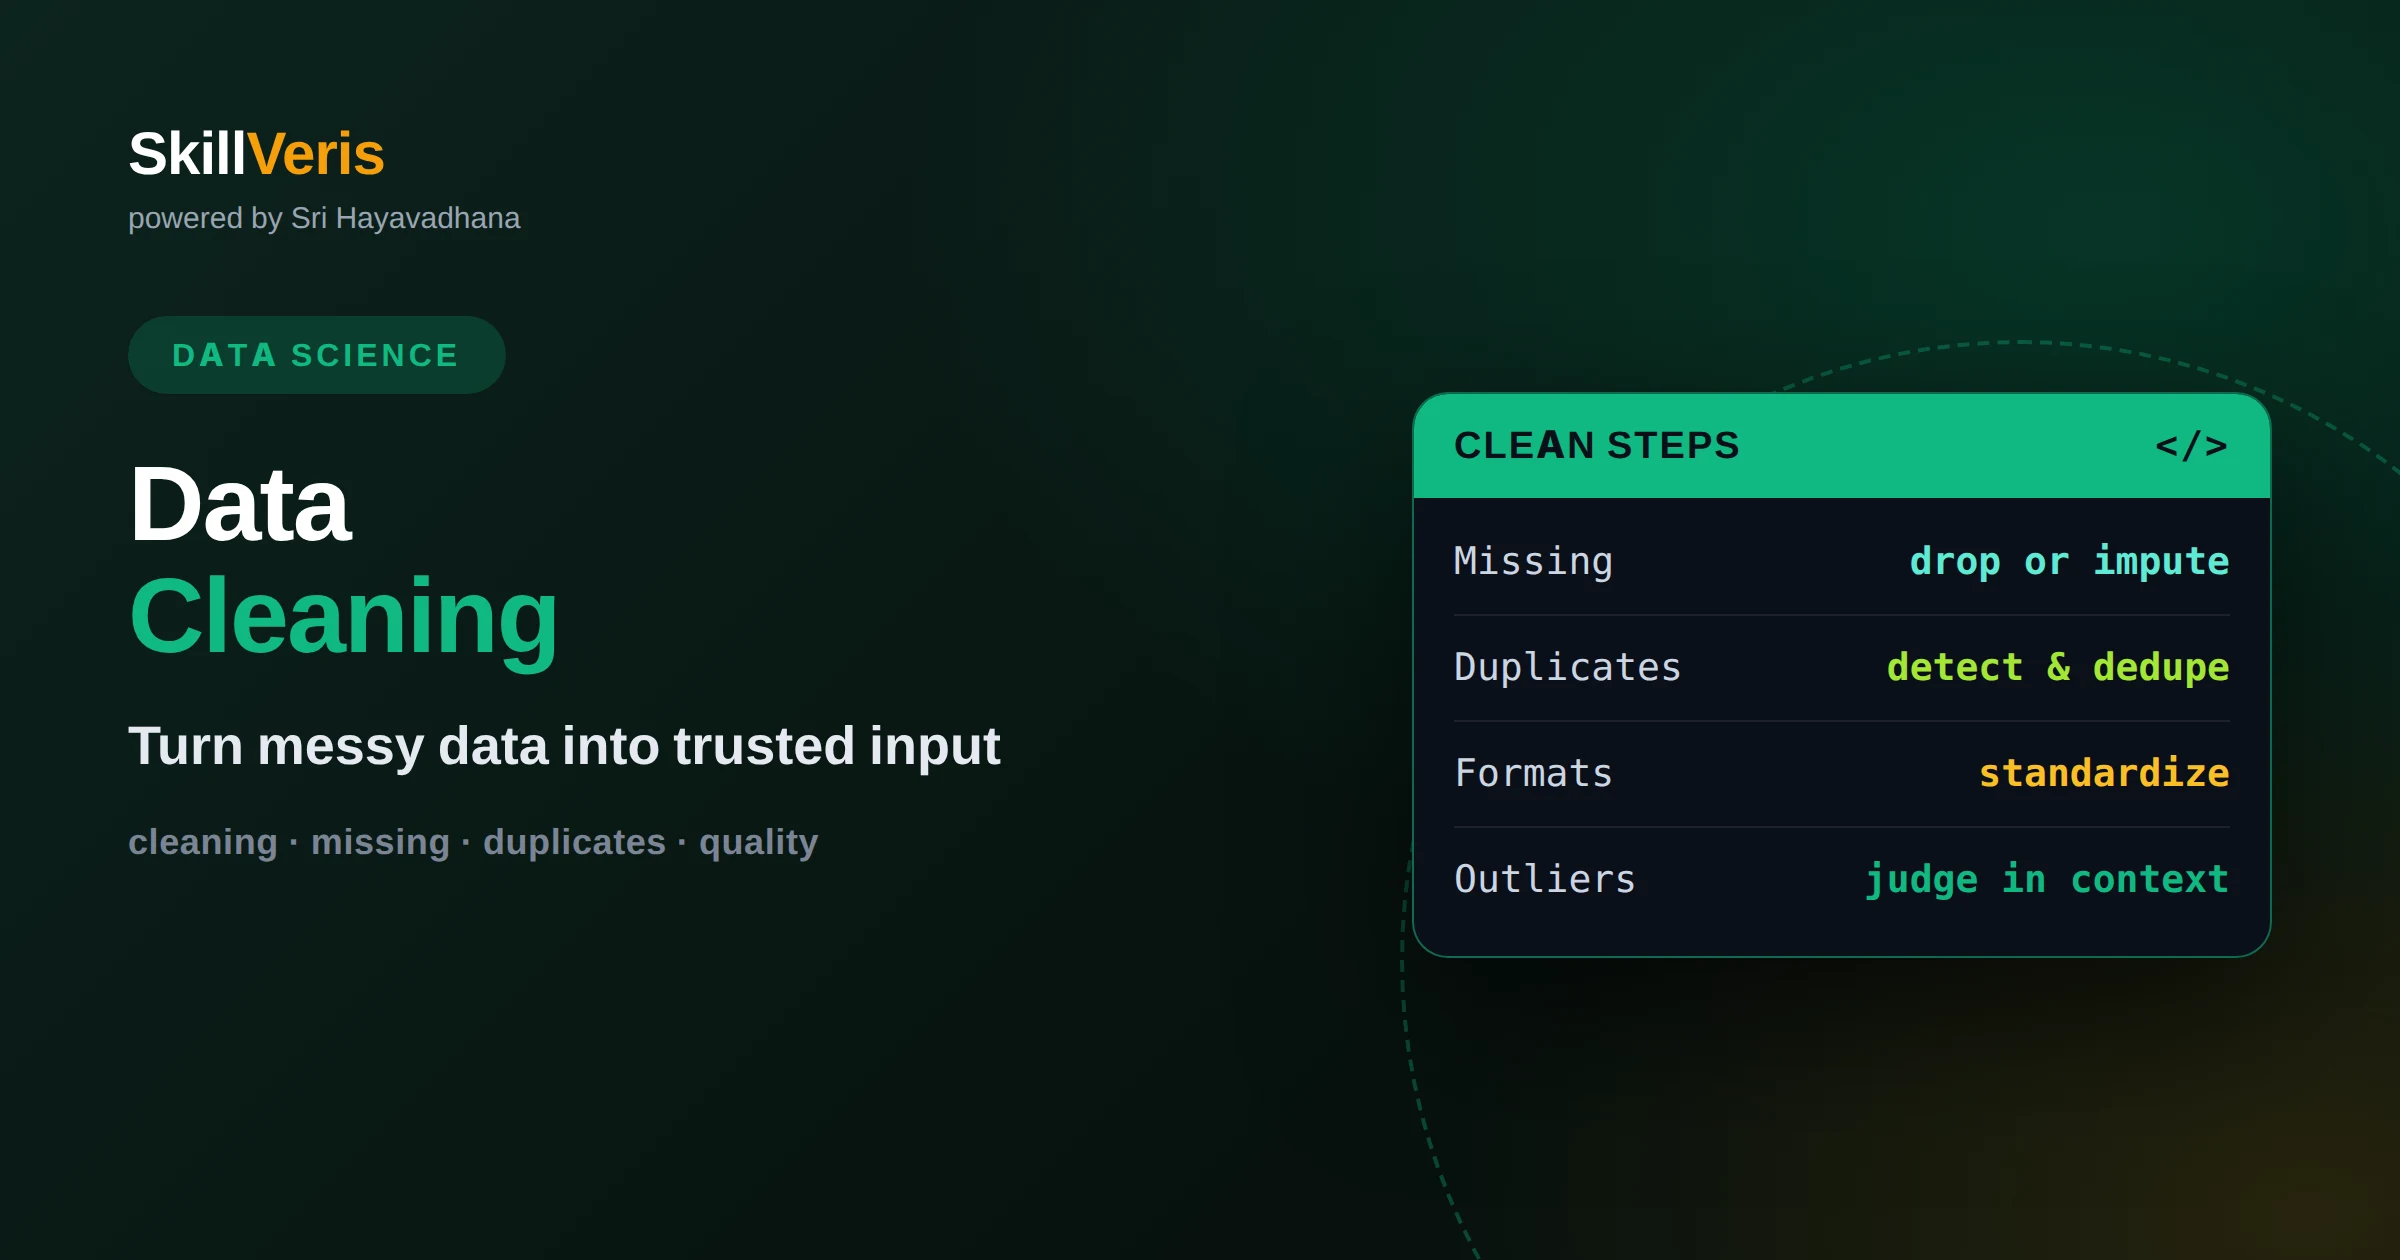
Data Cleaning: The Most Important Skill in Data Science
Data cleaning turns messy raw data into reliable input for analysis. Learn to handle missing values, duplicates, outliers, and inconsistent formats the professional way.
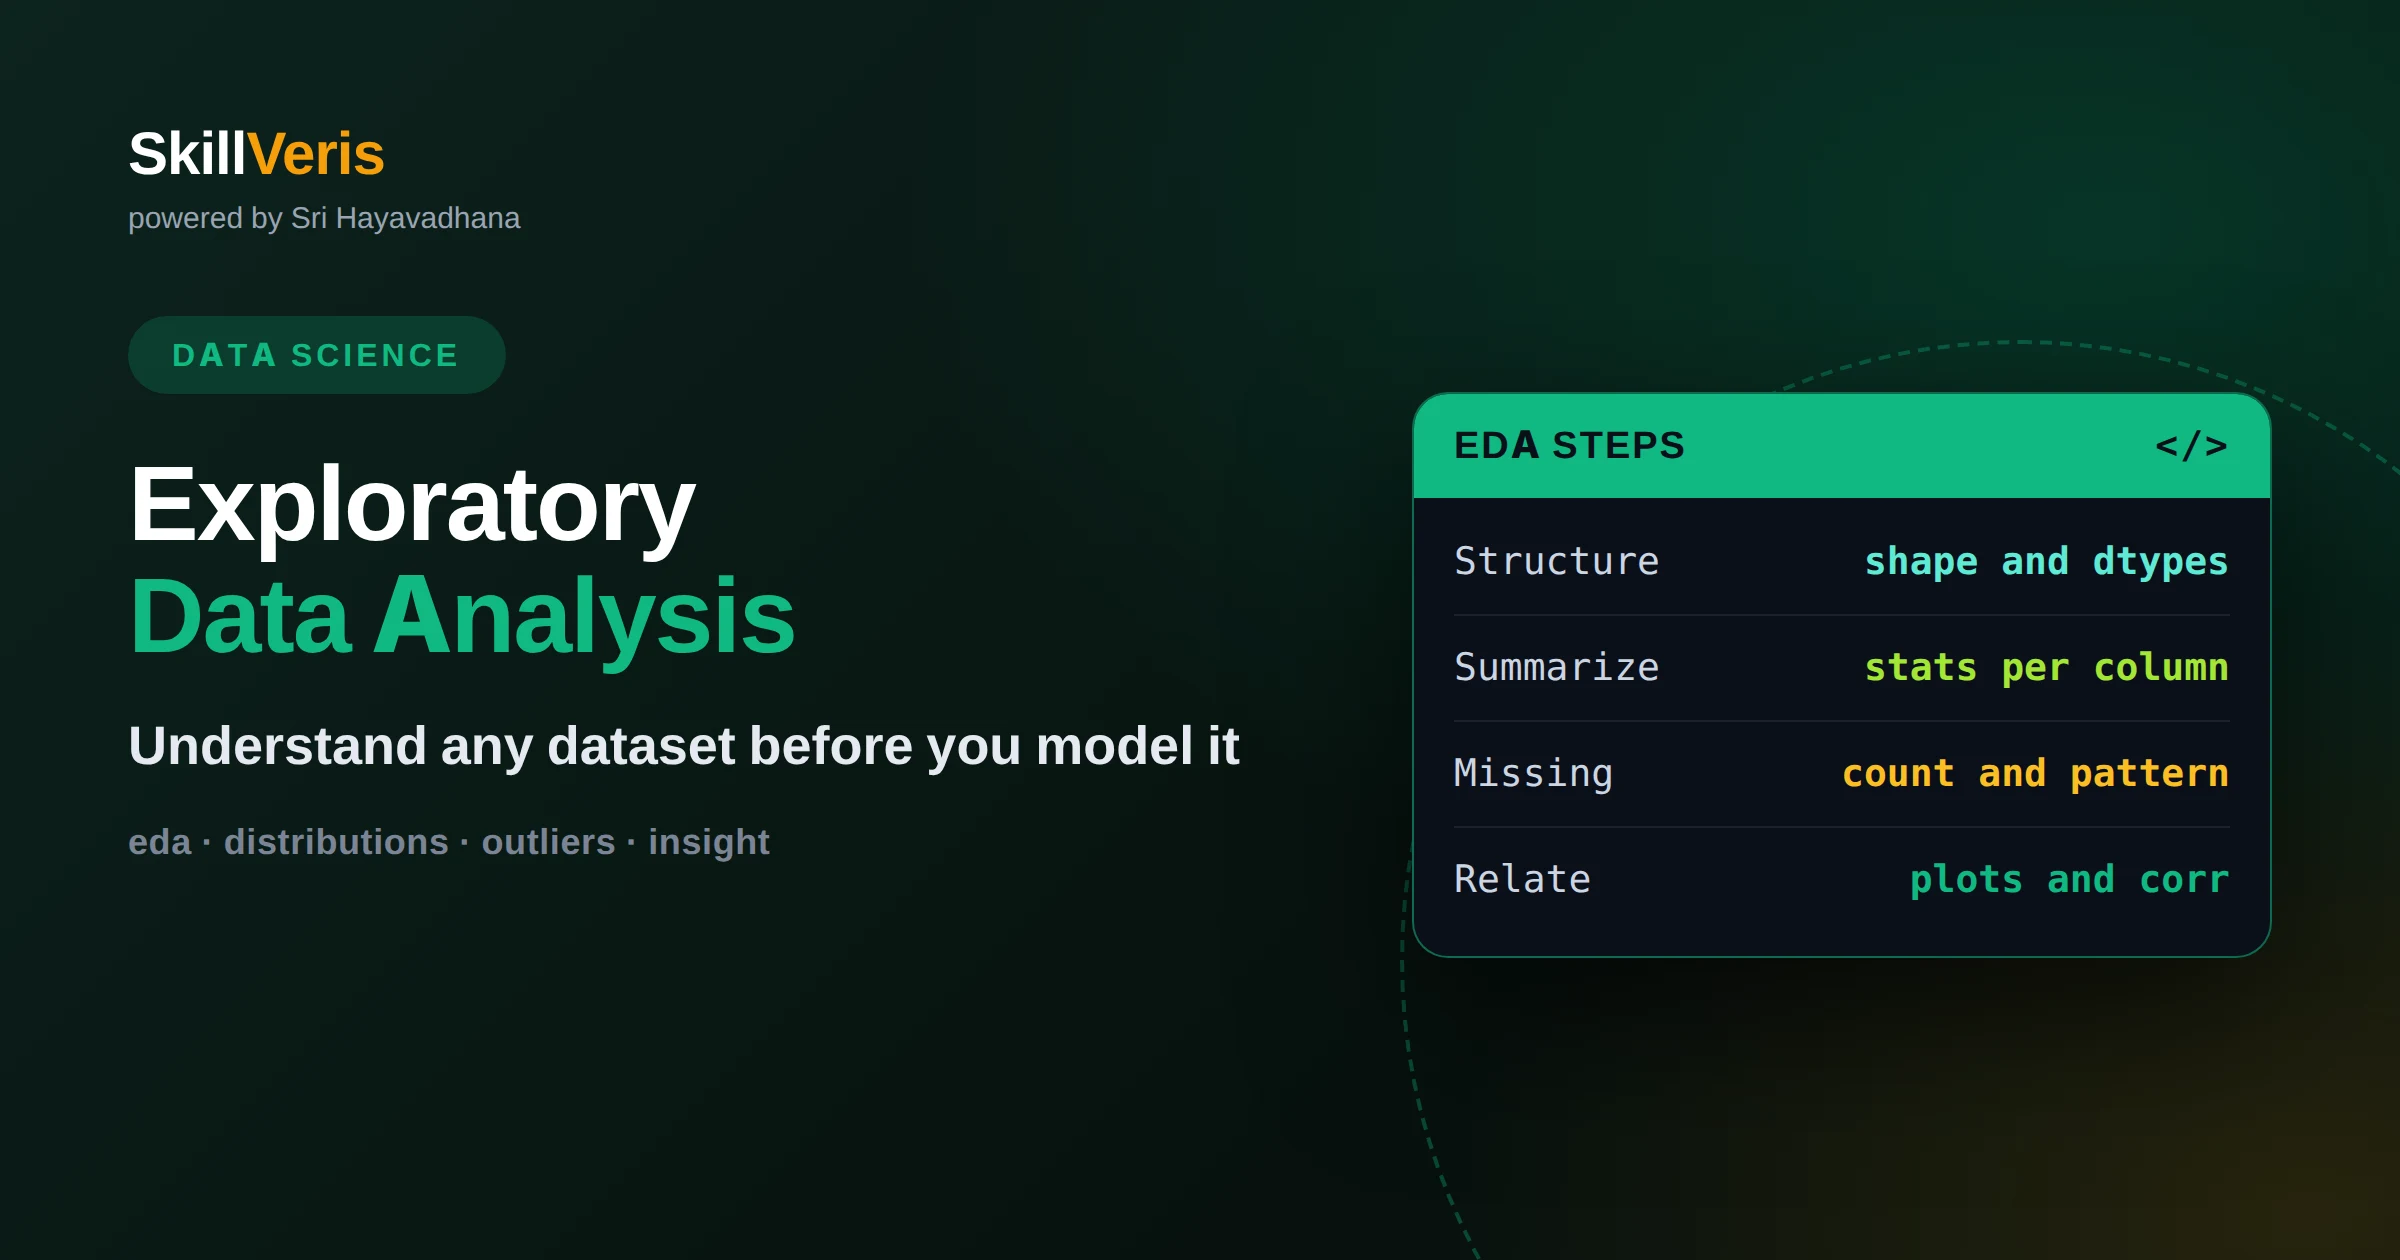
Exploratory Data Analysis (EDA) Explained
Exploratory data analysis is how you understand a dataset before modeling it. Learn the workflow, plots, and summary checks that turn raw data into insight.
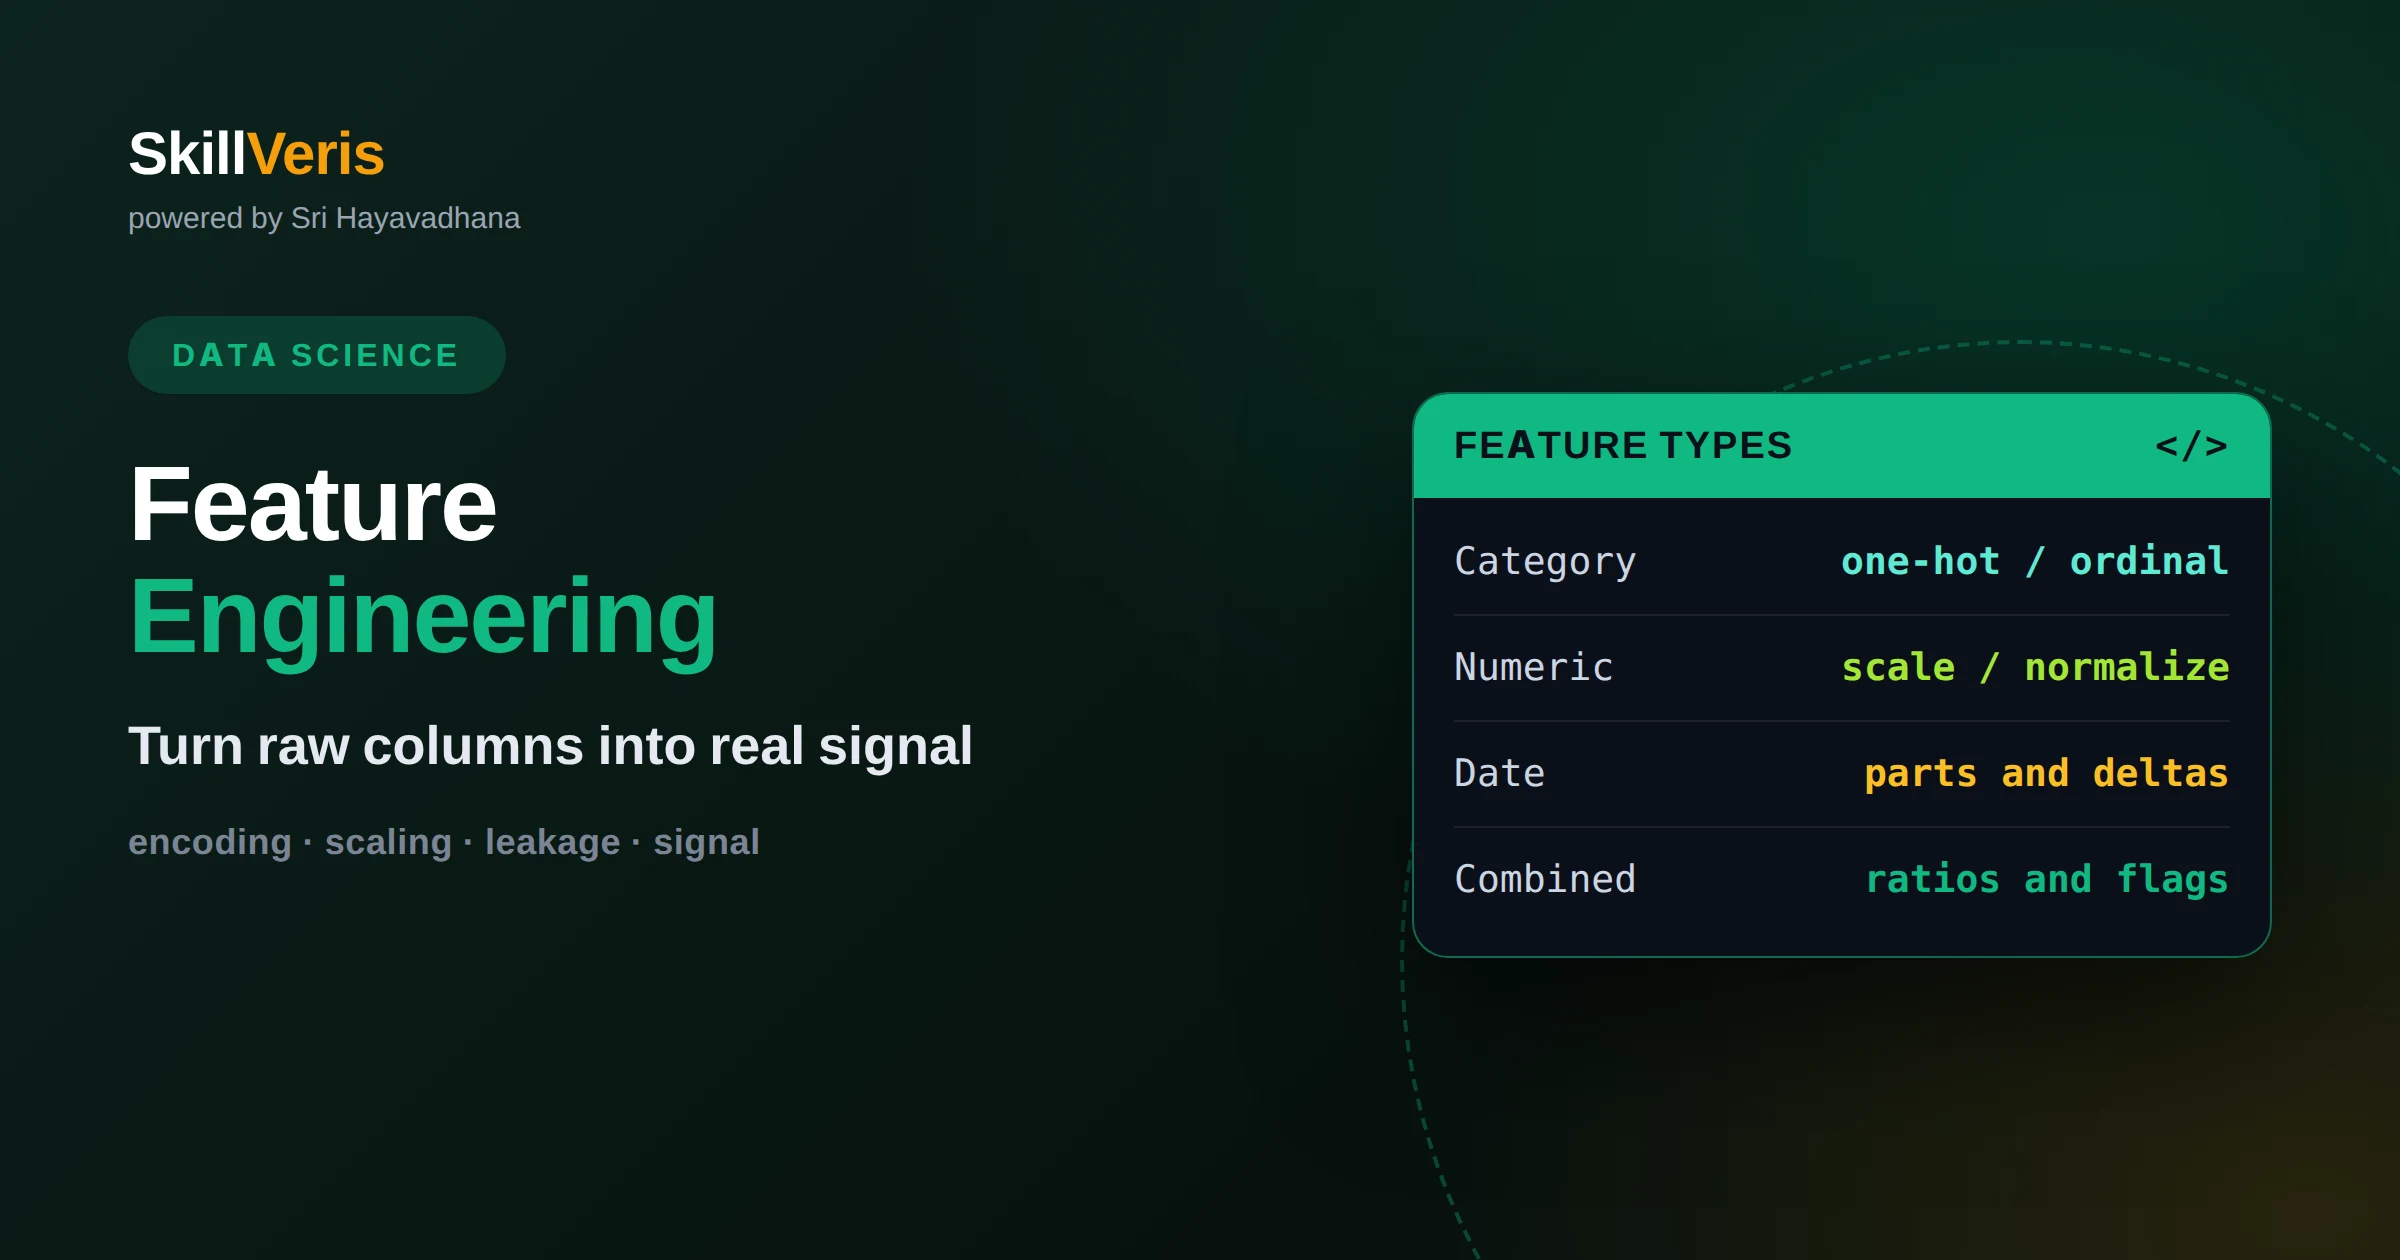
Feature Engineering: Turning Data Into Signal
Feature engineering turns raw columns into inputs a model can actually learn from. Learn the core techniques that often matter more than the algorithm itself.
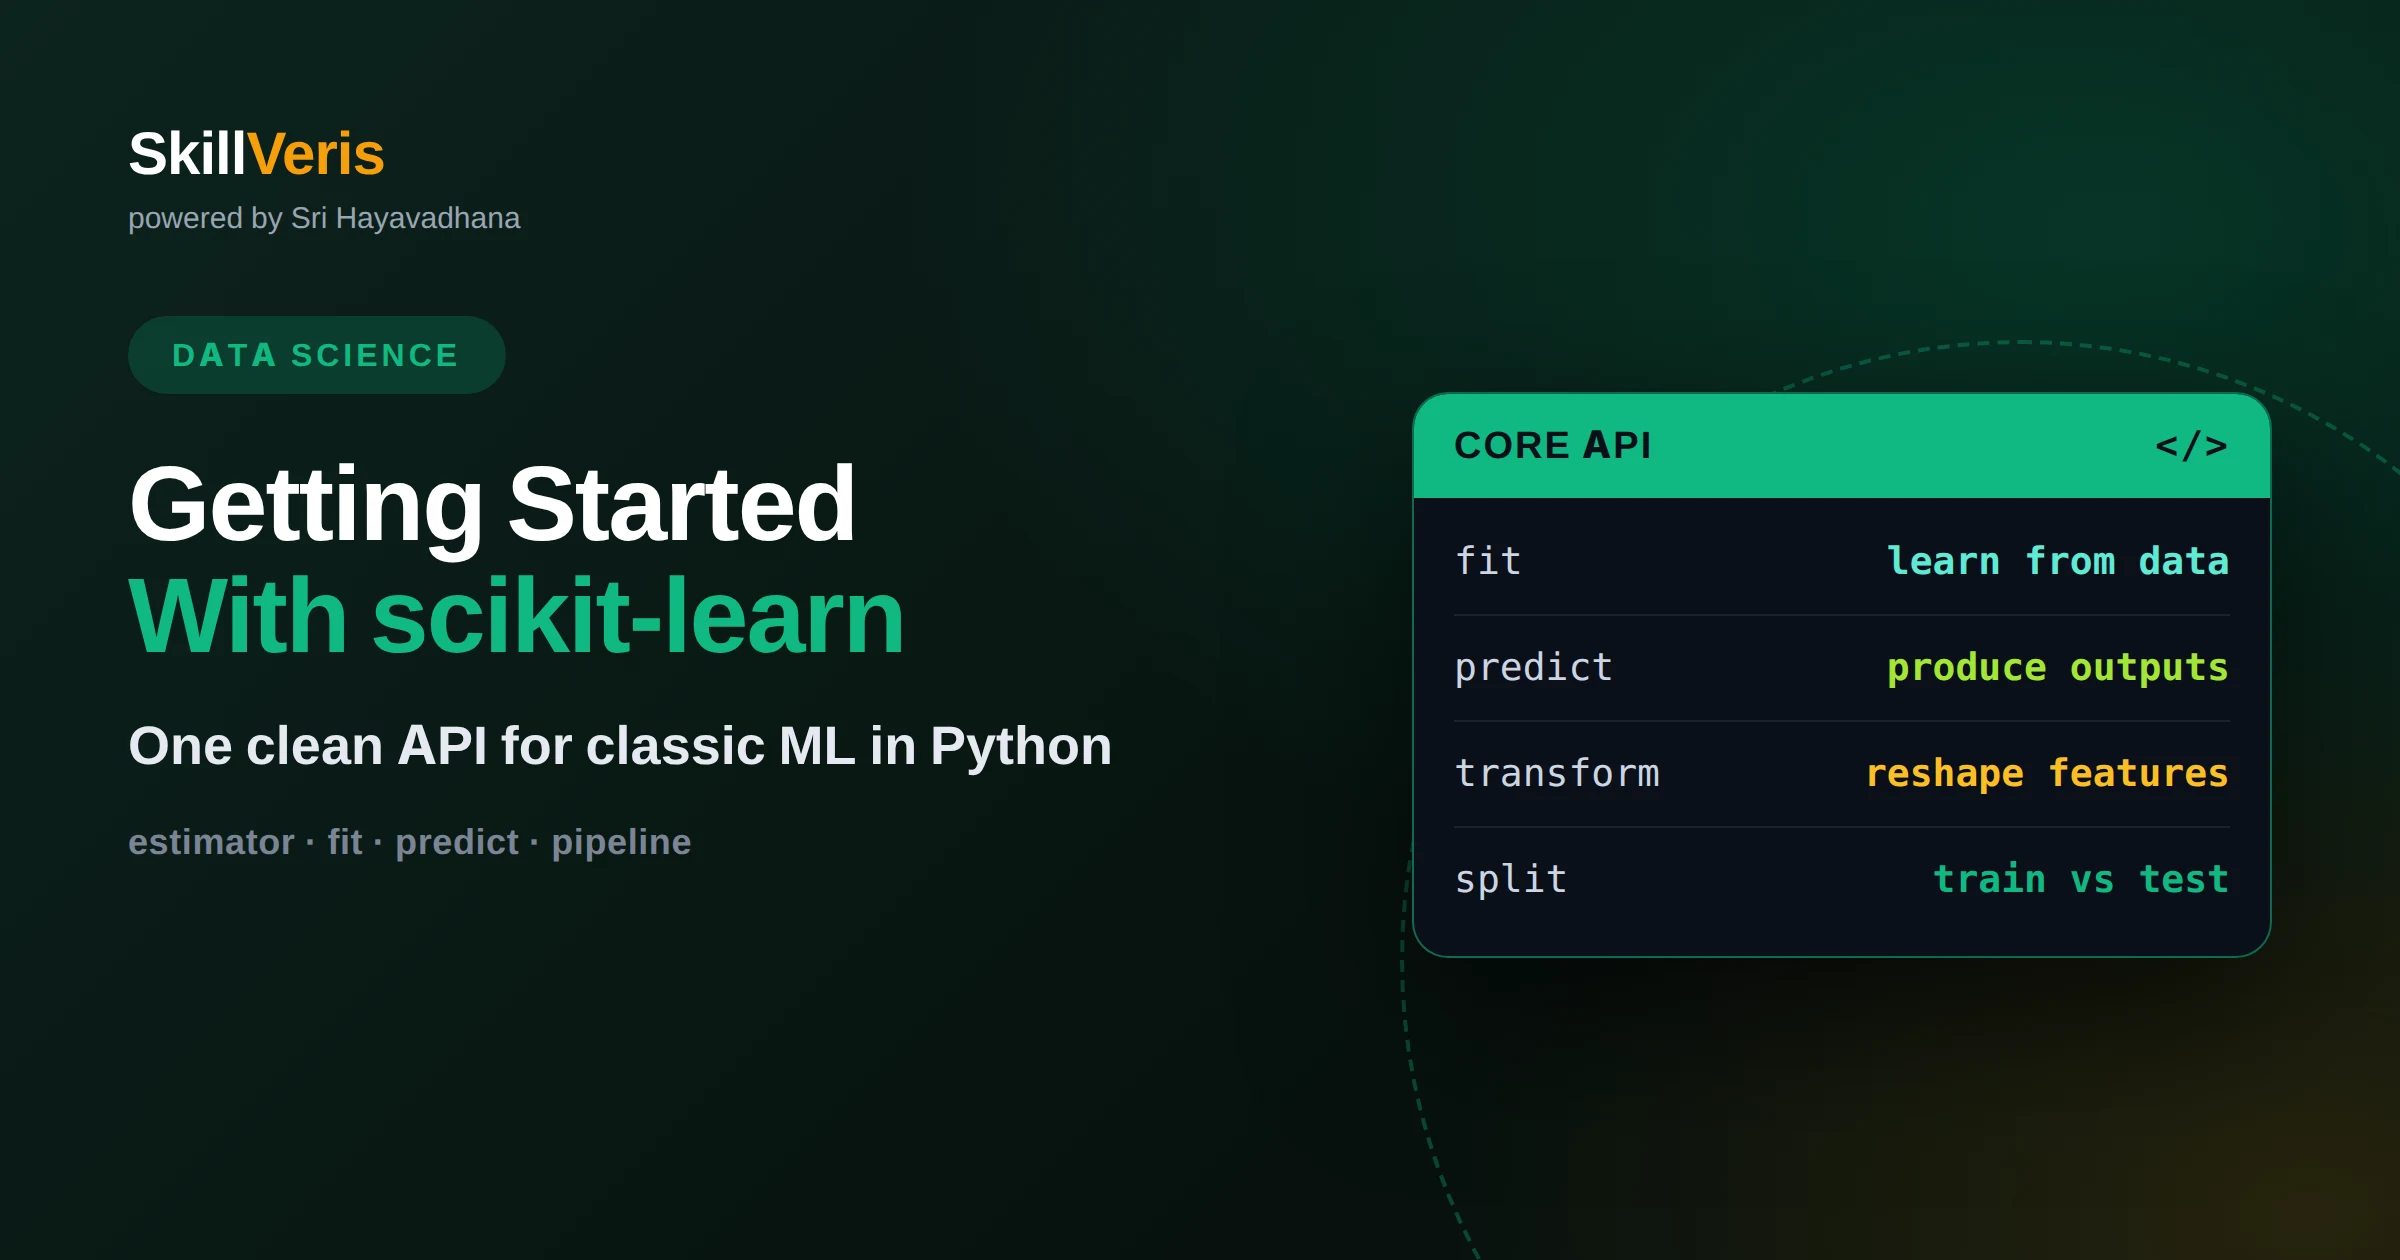
Getting Started With scikit-learn
scikit-learn is the standard Python library for classic machine learning. Learn its consistent API, core workflow, and how to train your first model correctly.
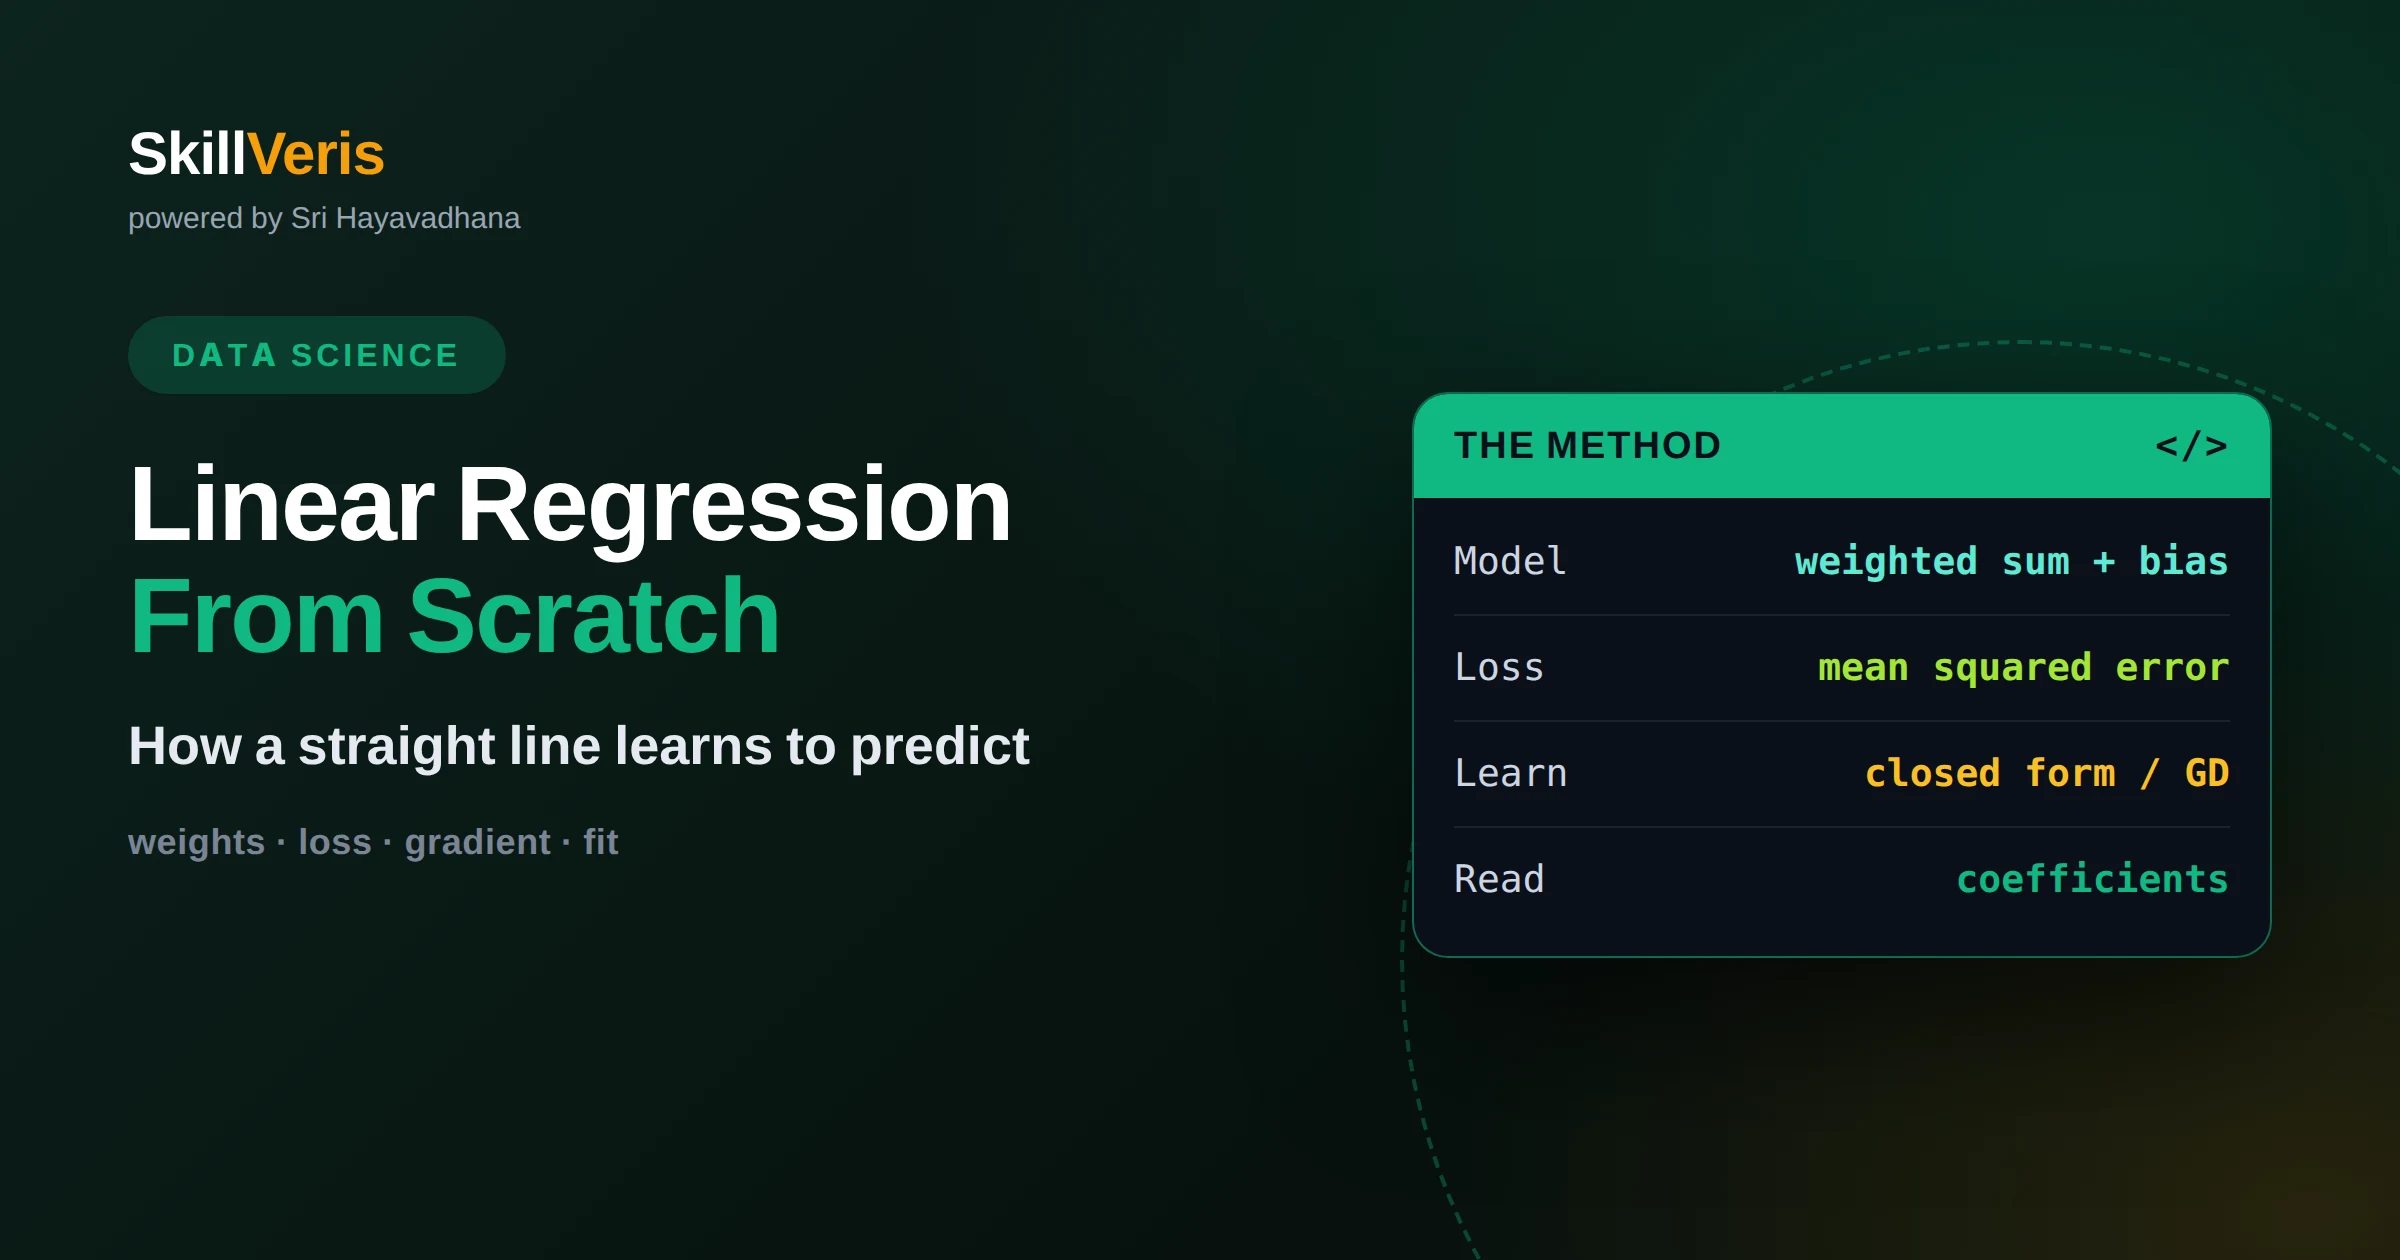
Linear Regression Explained From Scratch
Linear regression fits a straight-line relationship between inputs and a number you want to predict. Learn how it works, how it learns, and where it fits.
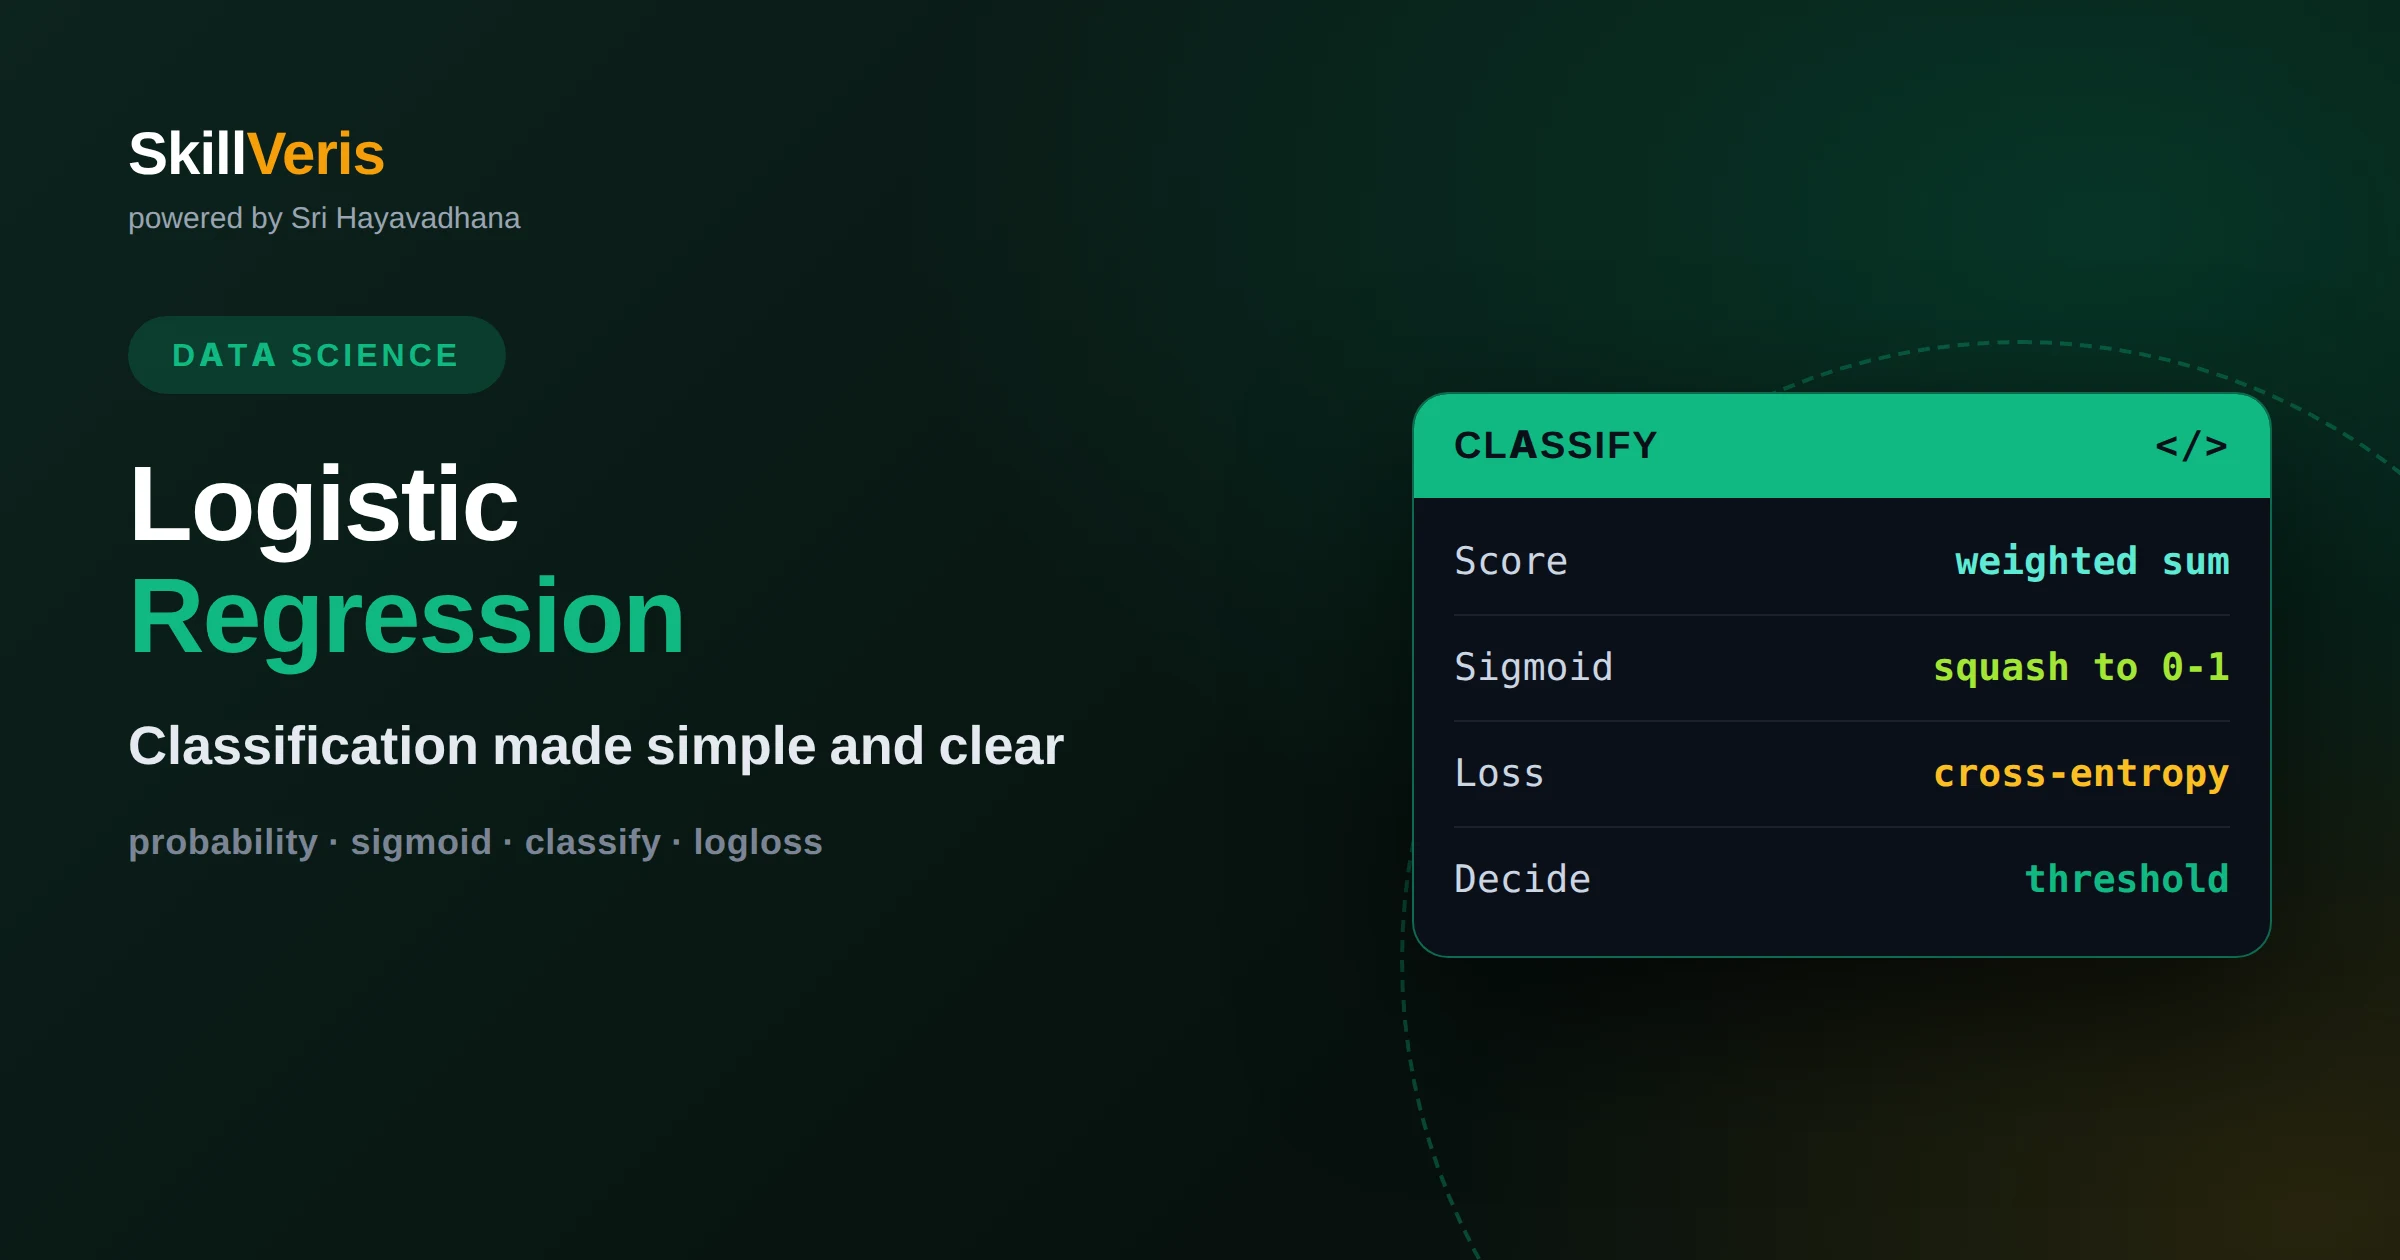
Logistic Regression: Classification Made Simple
Logistic regression predicts the probability of a category, making it the go-to model for classification. Learn how it works, reads out, and gets evaluated.
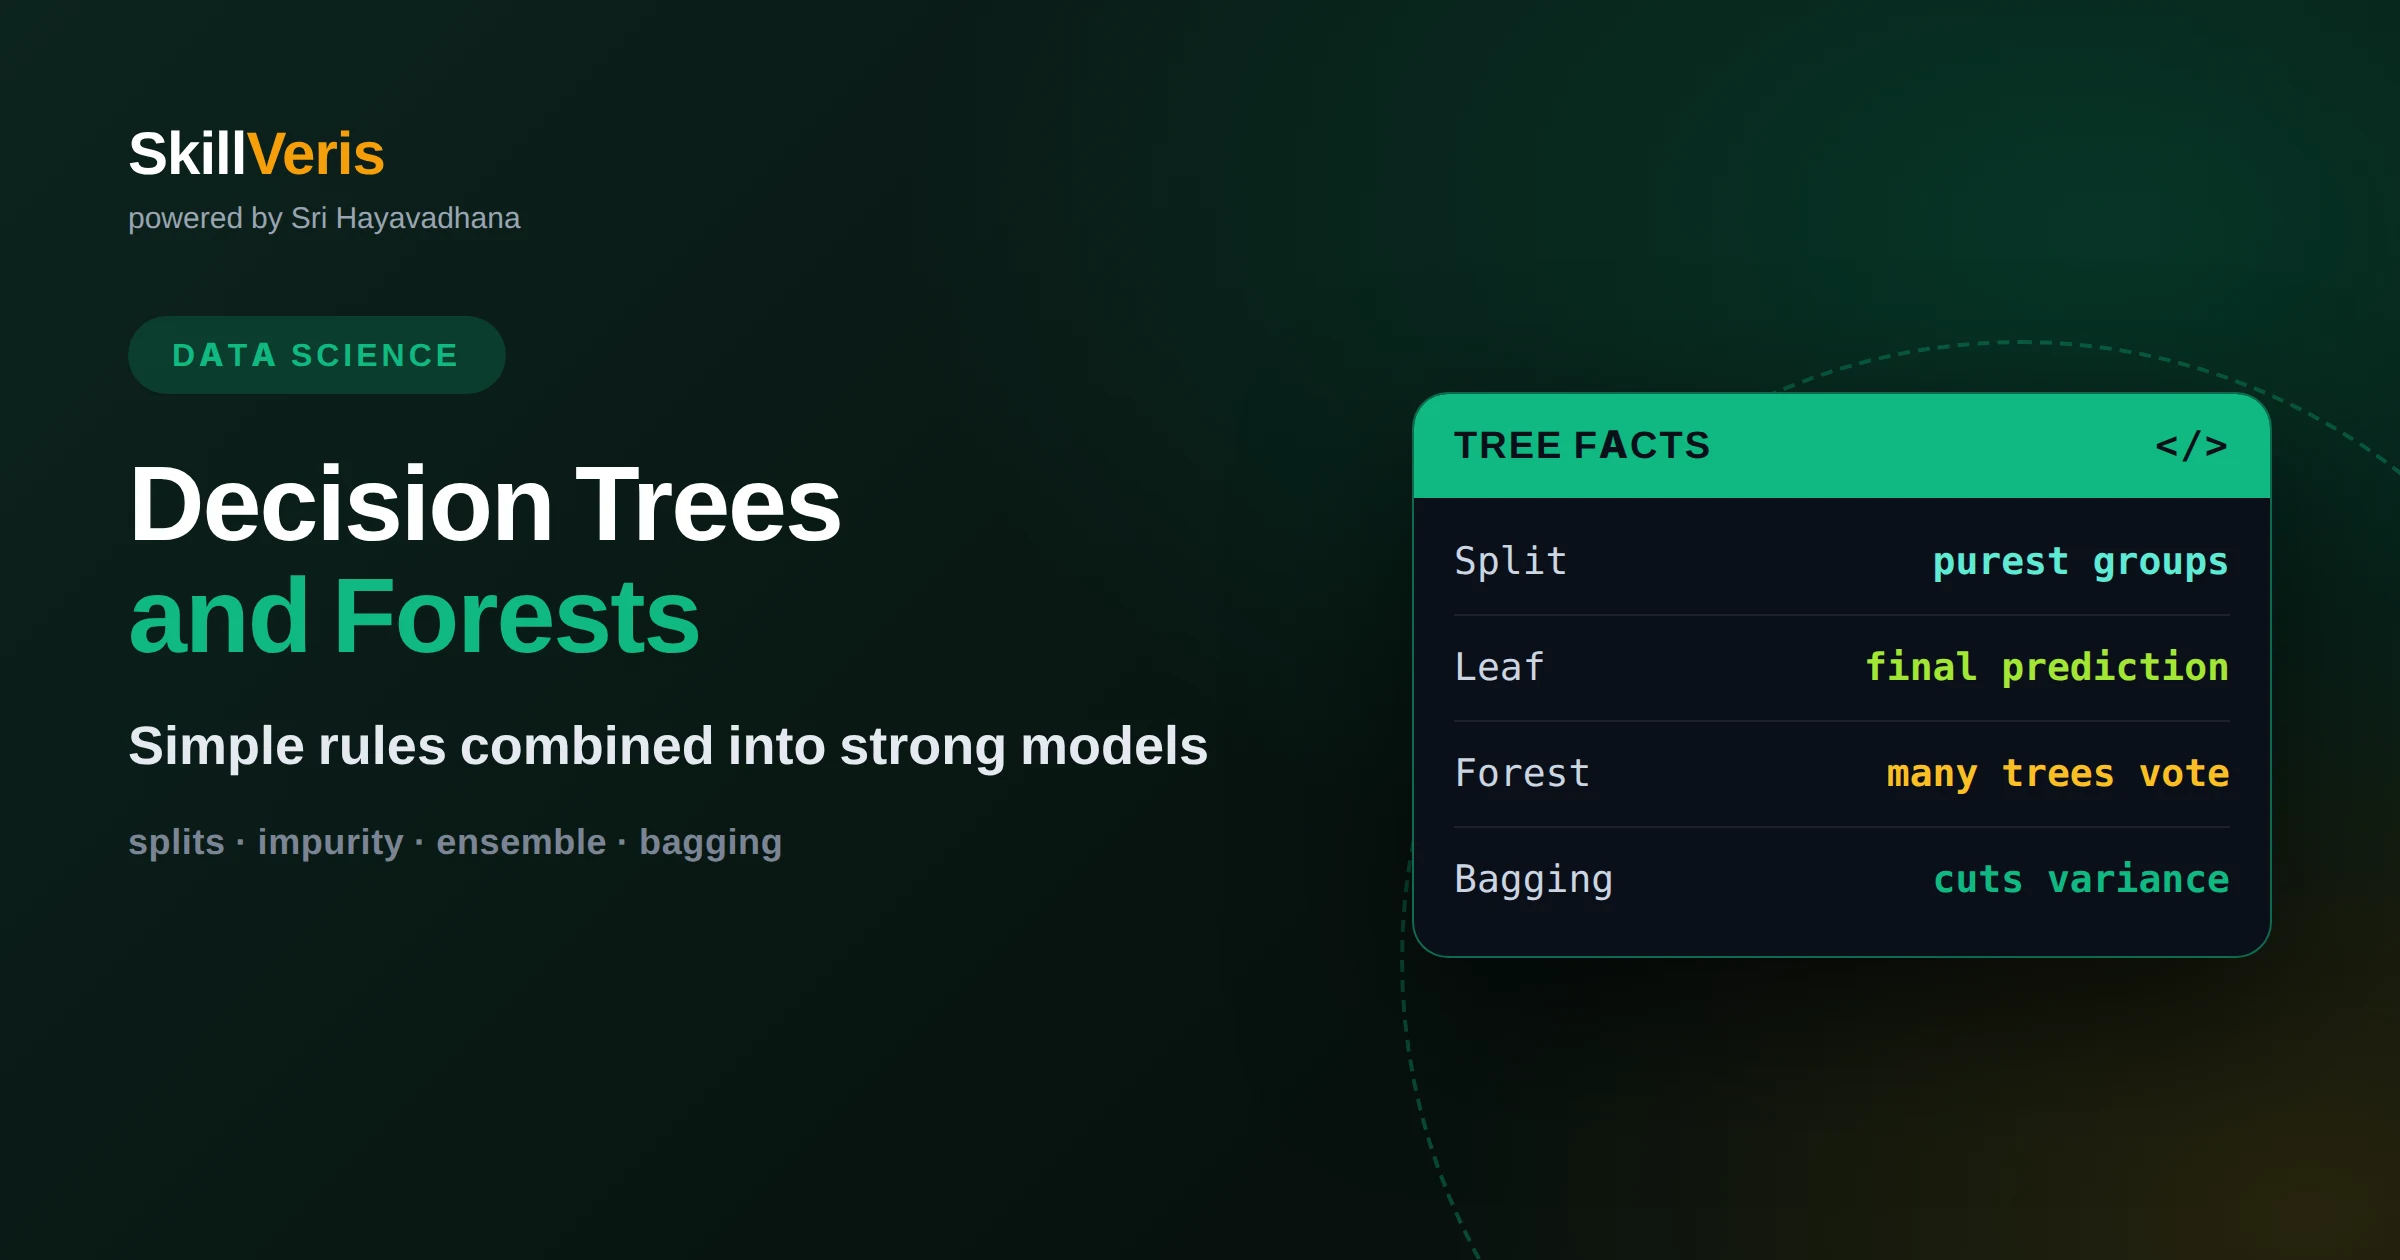
Decision Trees and Random Forests Explained
Decision trees split data into simple rules, and random forests combine many trees for accuracy. Learn how both work and when to reach for each one.
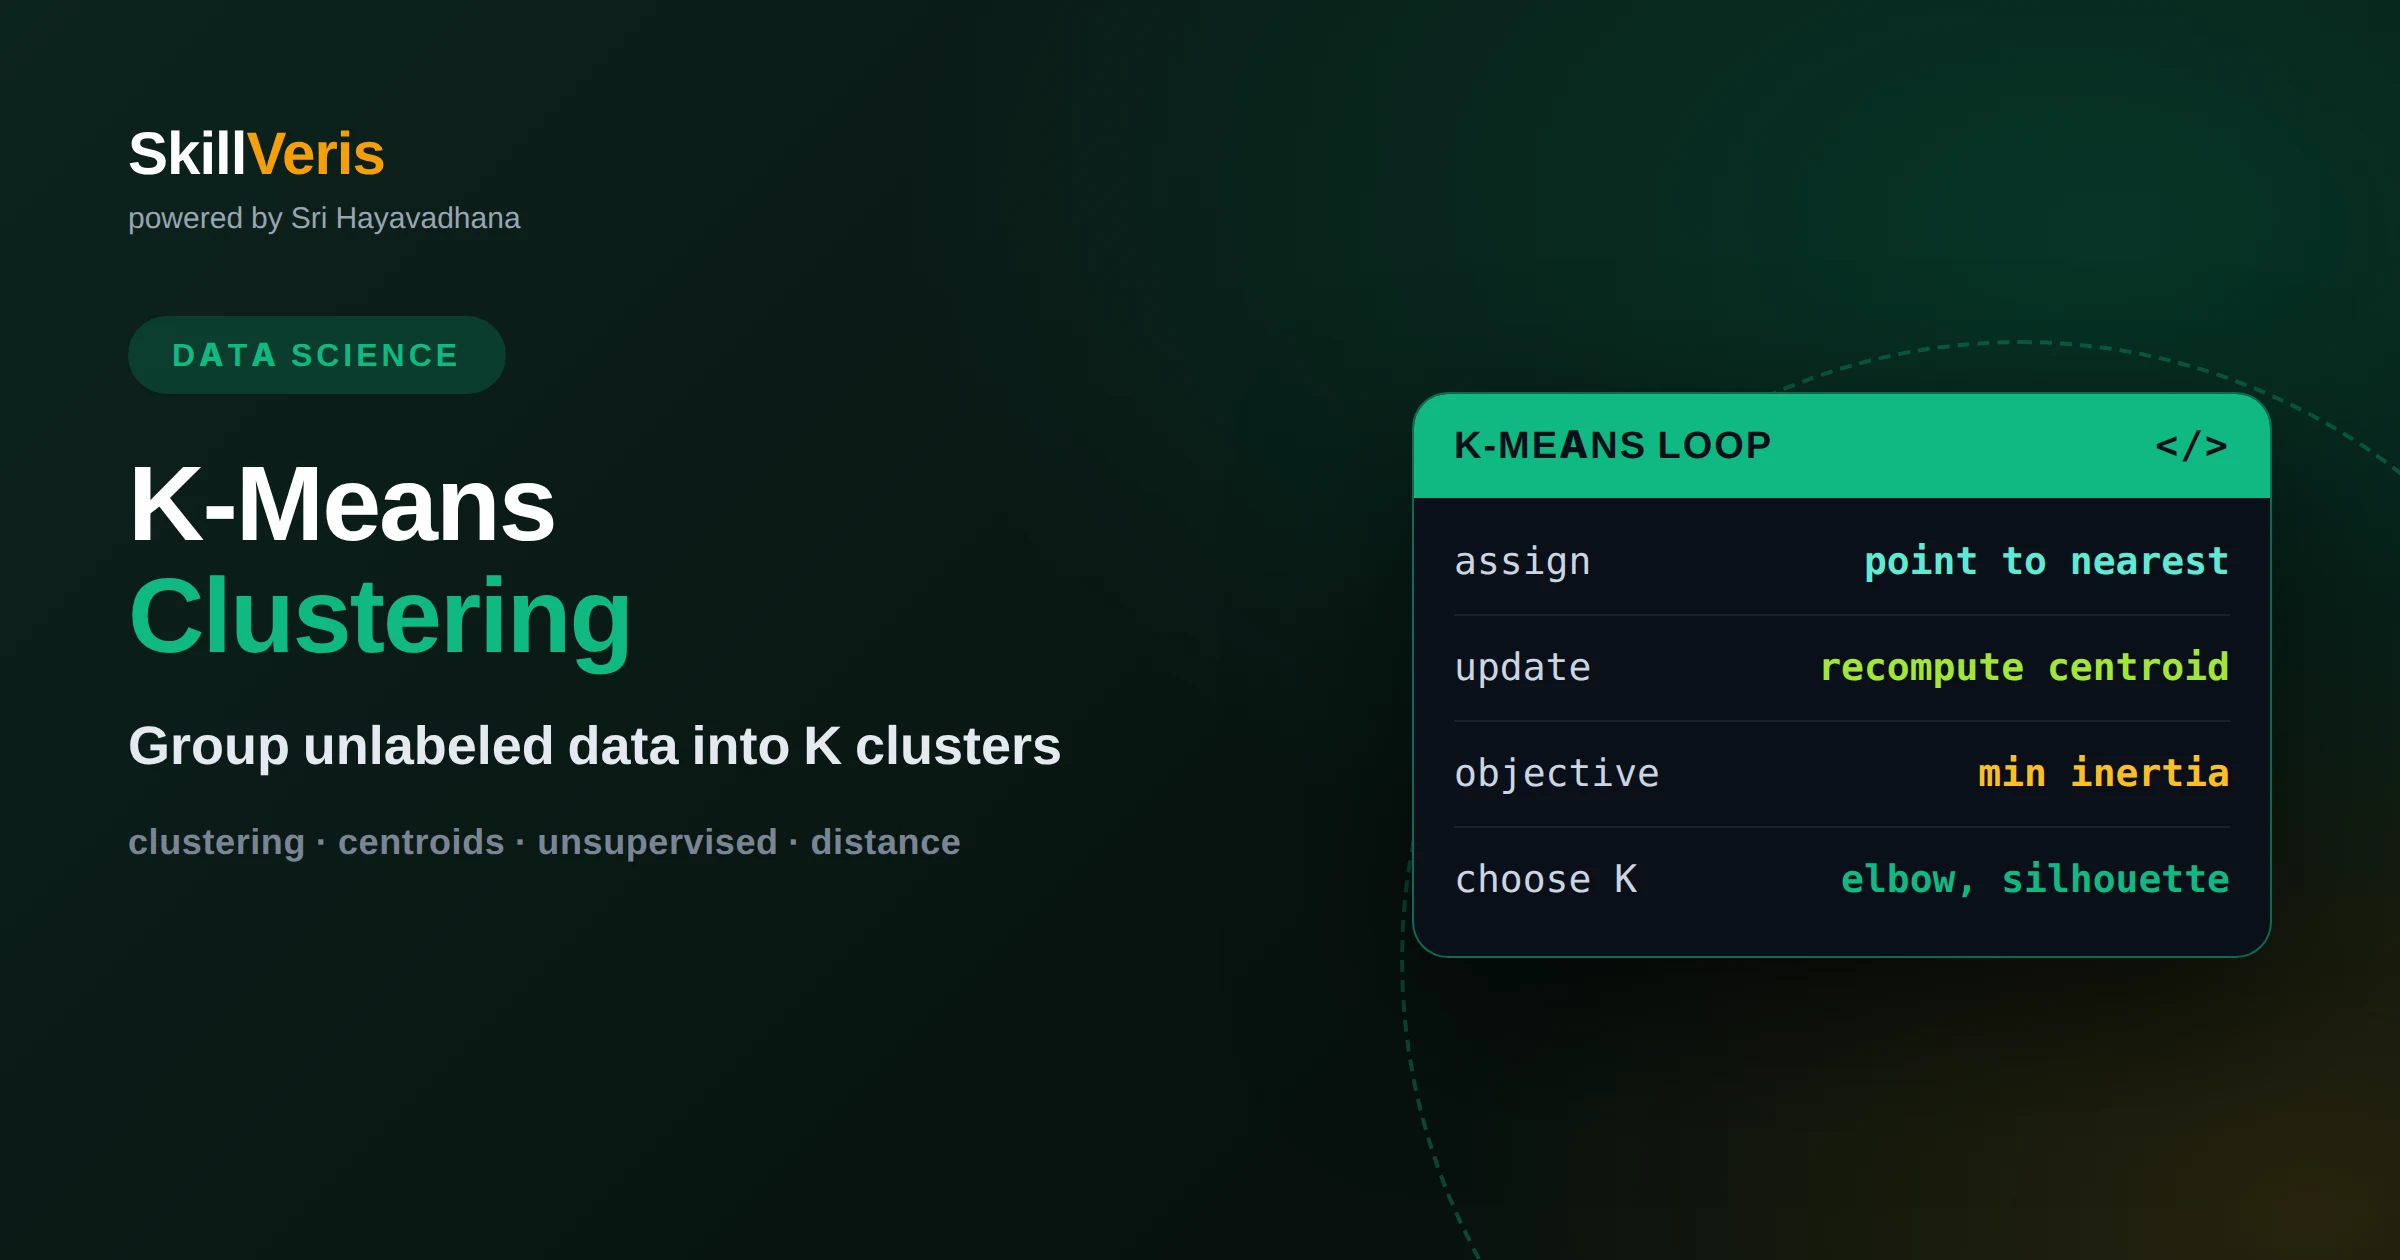
K-Means Clustering Explained for Beginners
K-means clustering groups unlabeled data into K similar groups by minimizing distance to cluster centers. Learn how it works, when to use it, and its limits.
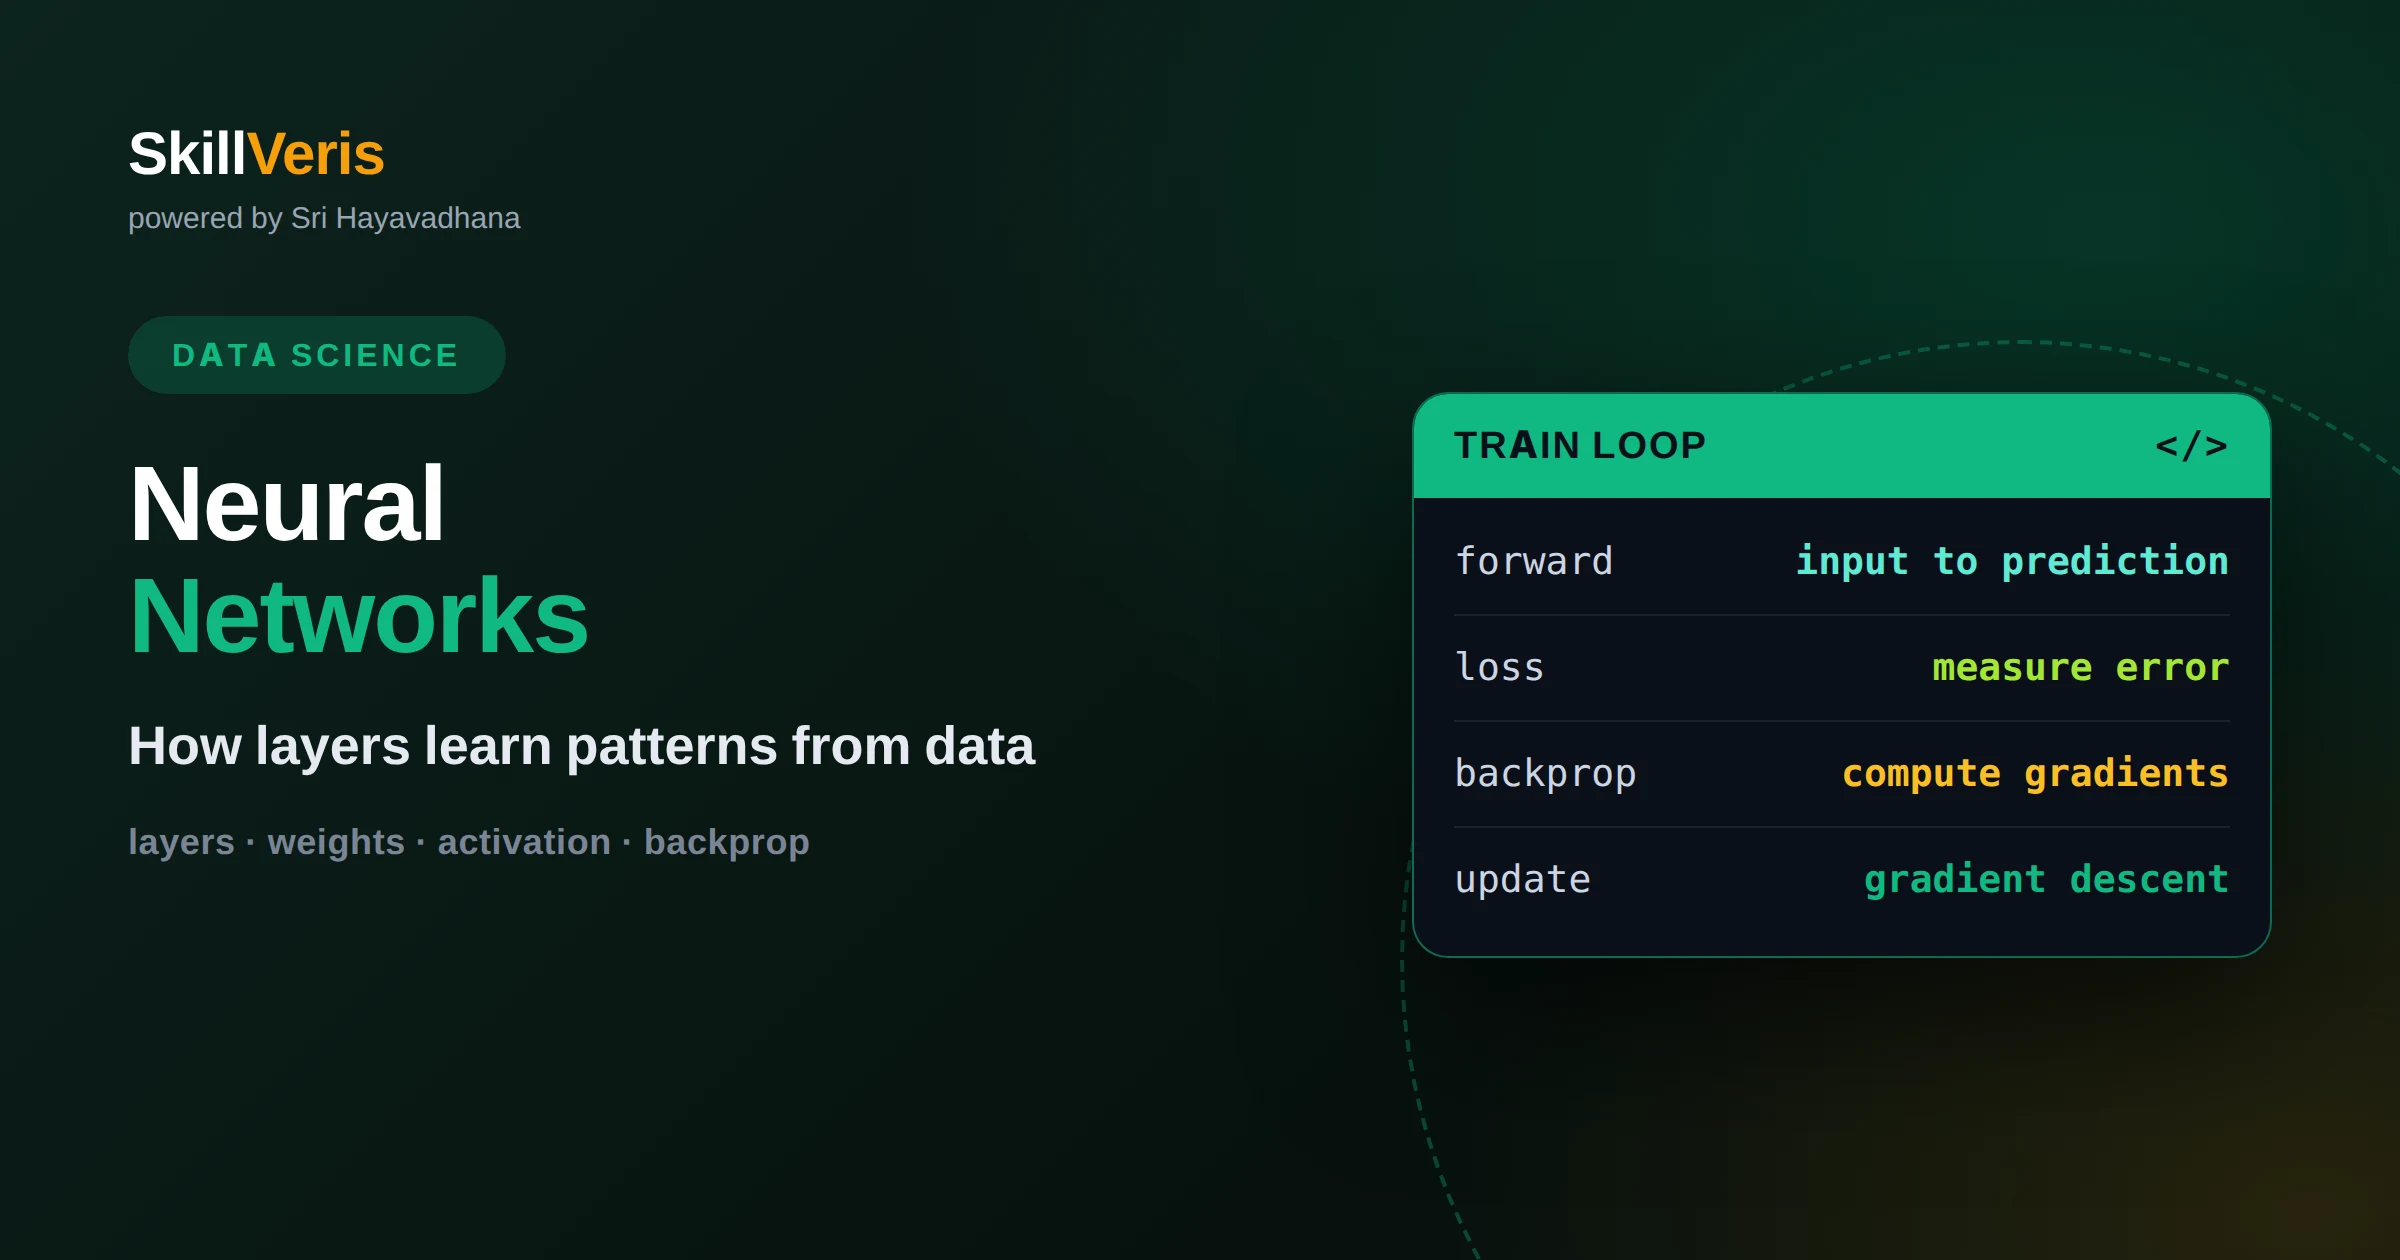
Neural Networks Explained: A Visual Guide
A neural network learns patterns by passing data through layers of weighted connections that adjust during training. Here is how each piece works together.
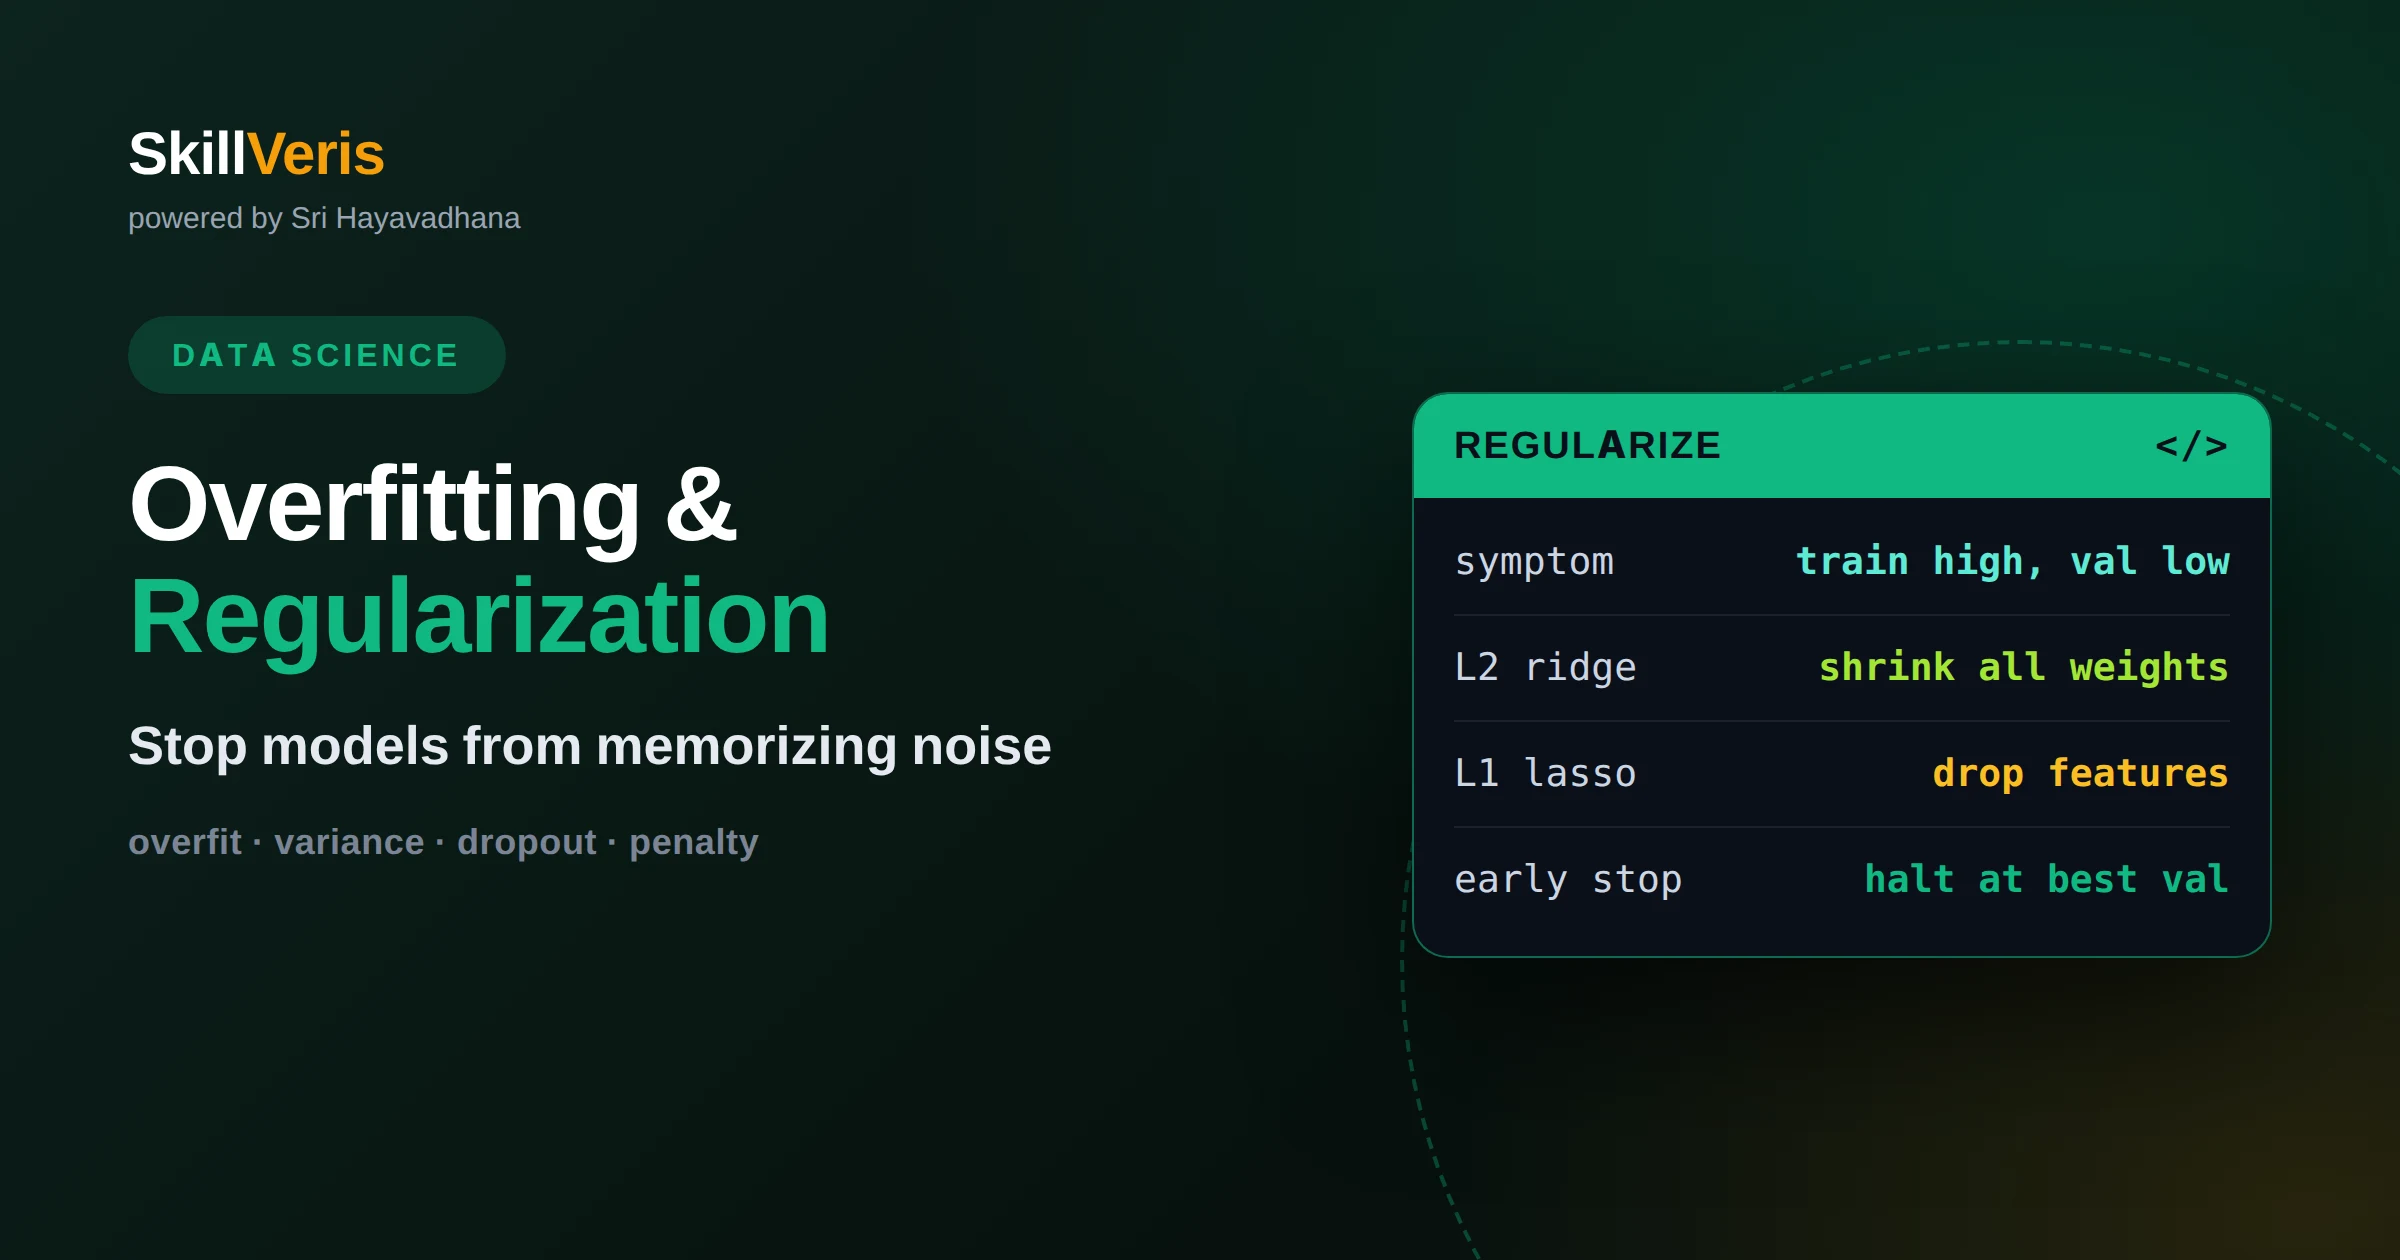
Overfitting and Regularization Explained
Overfitting is when a model memorizes training data instead of learning general patterns. Regularization fights it. Learn to spot, measure, and prevent both.
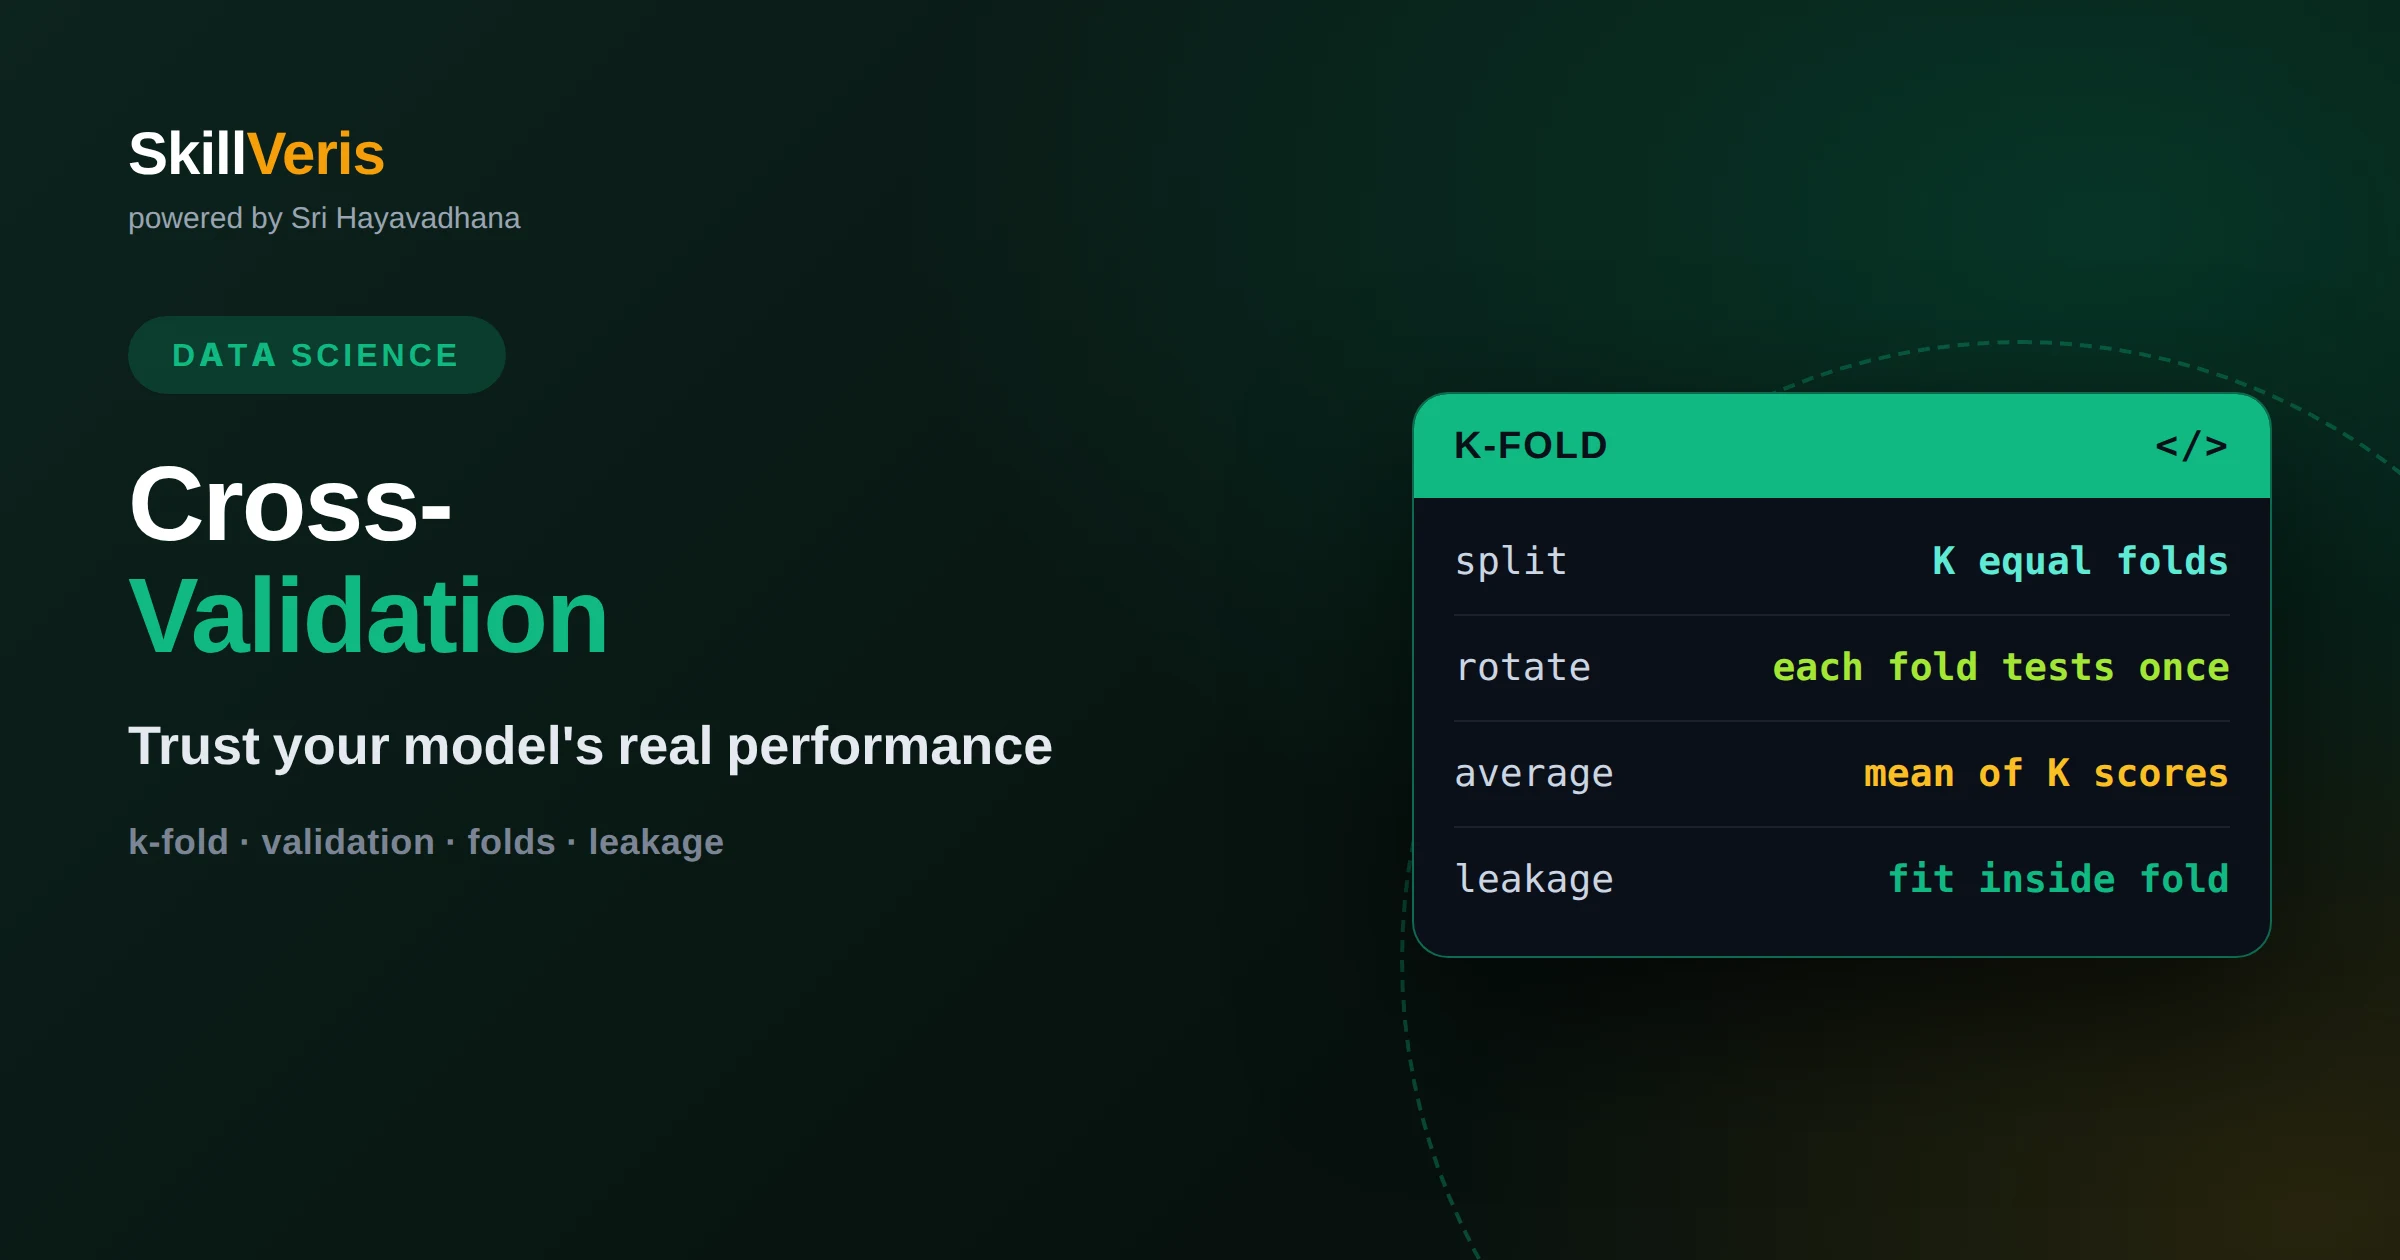
Cross-Validation: How to Trust Your Model
Cross-validation tests a model on multiple held-out splits so its score reflects real-world performance, not luck. Learn k-fold, its variants, and common pitfalls.
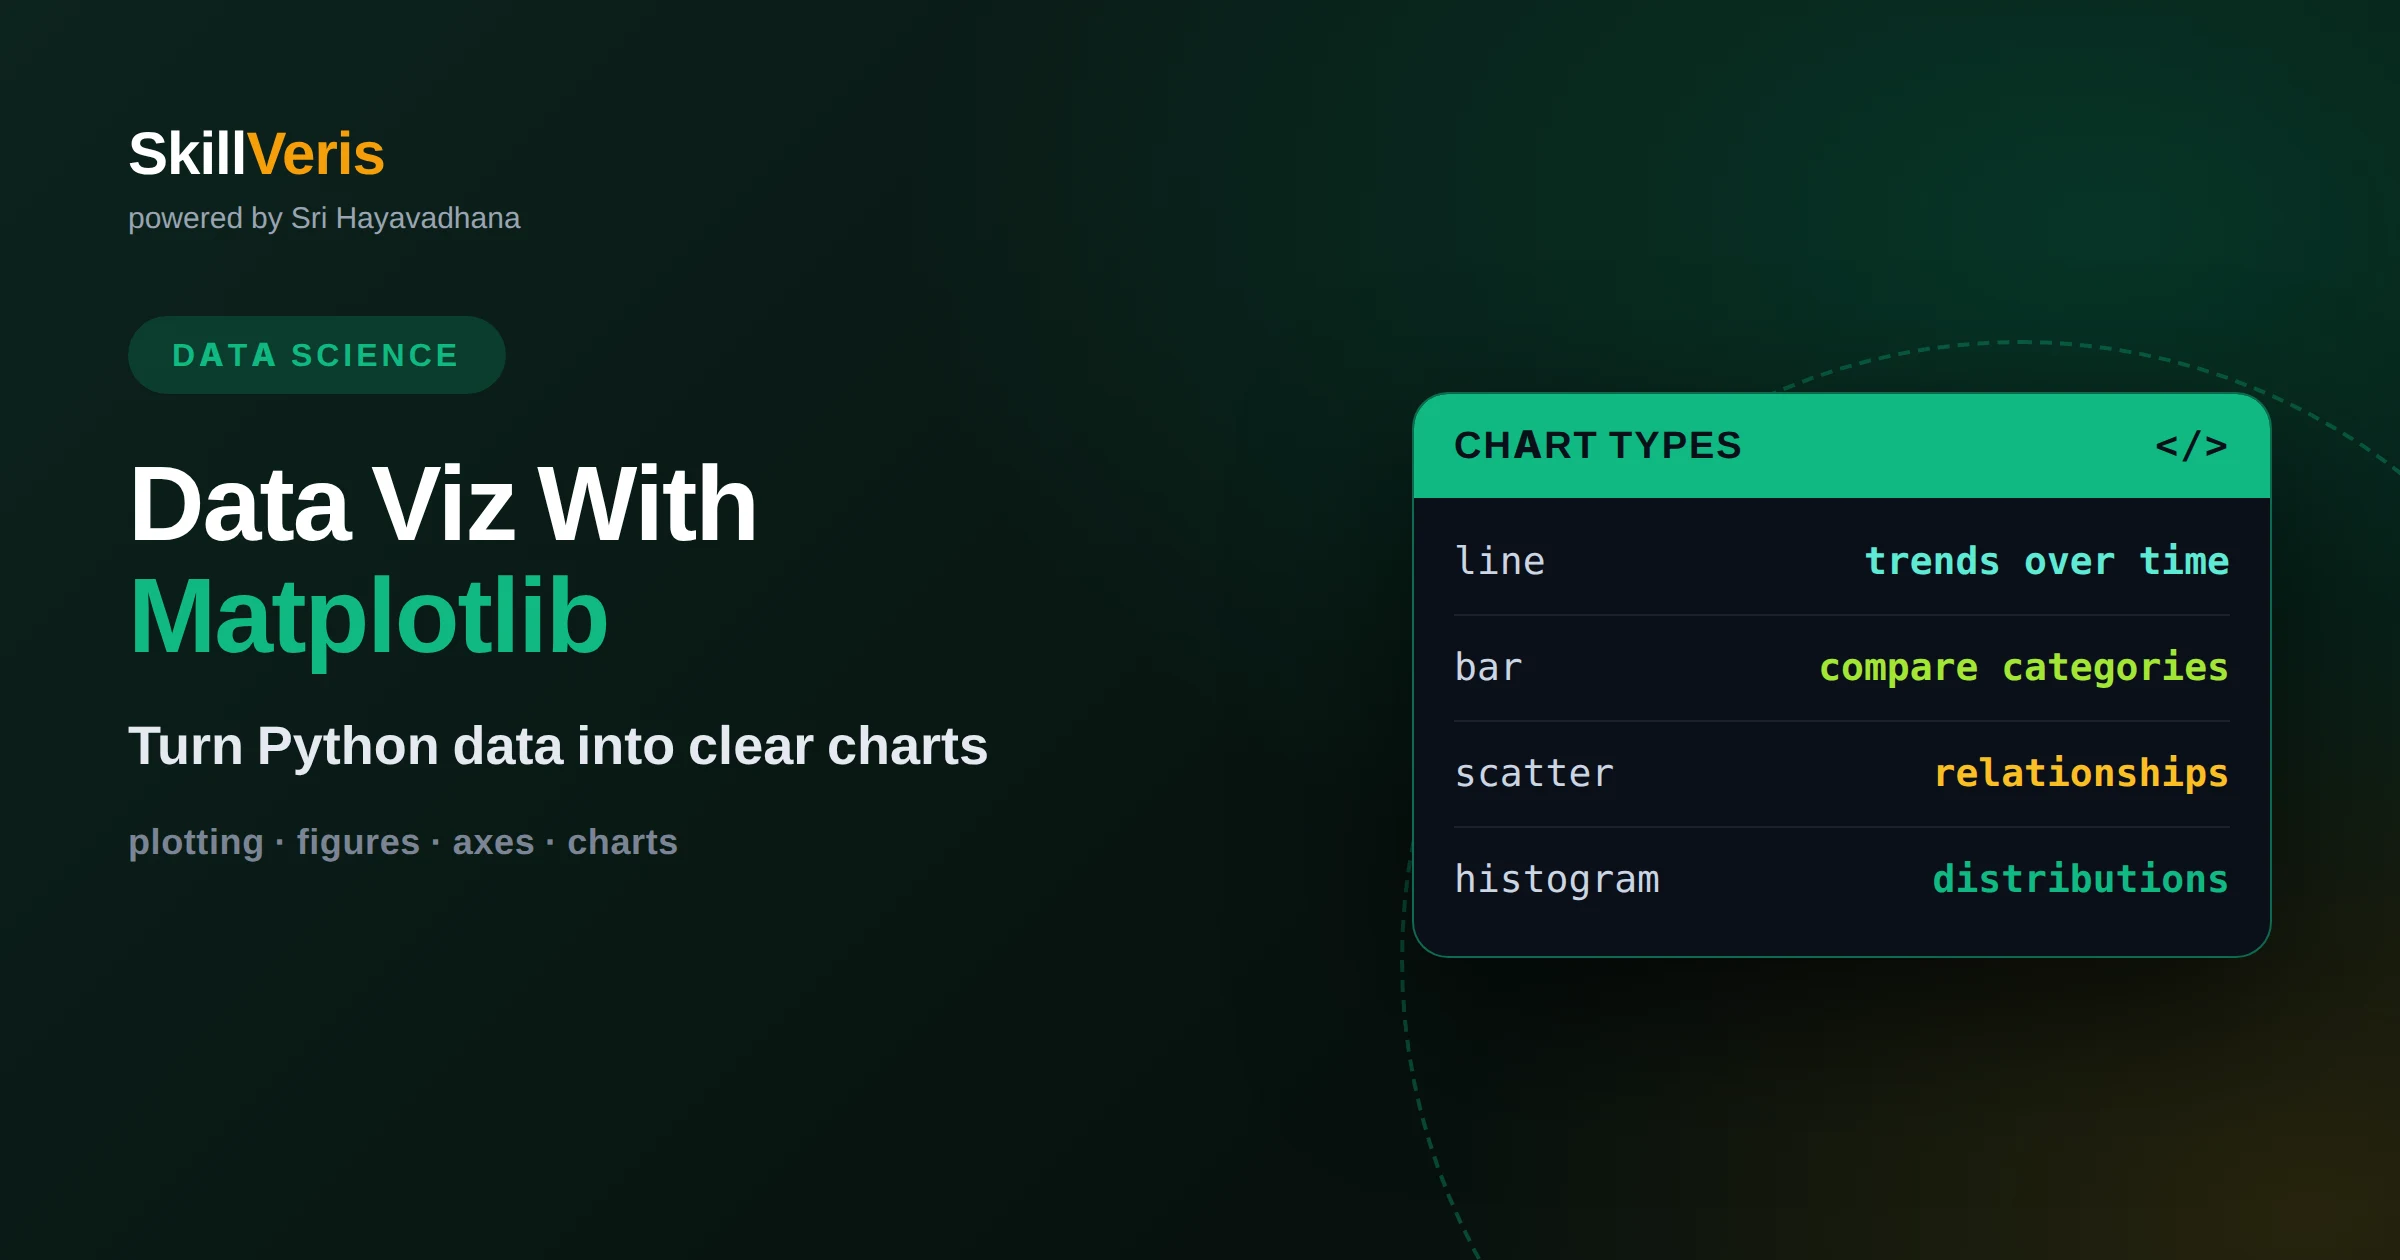
Data Visualization With Matplotlib: A Practical Guide
Matplotlib is Python's foundational plotting library. Learn its figure-and-axes model, core chart types, and styling to turn raw data into clear visuals.
Statistics for Data Science: The Essentials
The core statistics every data scientist needs: distributions, sampling, probability, hypothesis testing, and correlation, explained in plain language.
NumPy for Beginners: A Complete Tutorial
NumPy is Python's core library for fast numerical computing, built around the ndarray. Learn arrays, indexing, broadcasting, and vectorization in this beginner tutorial.
Data Cleaning in Python: A Practical Guide
Data cleaning fixes missing values, duplicates, wrong types, and outliers so analysis is trustworthy. This practical guide walks through the process with pandas.
How to Perform Exploratory Data Analysis in Python
Exploratory data analysis (EDA) summarizes and visualizes a dataset to understand its structure before modeling. Learn a repeatable EDA workflow with pandas.
Matplotlib vs Seaborn: Which to Learn First?
Learn matplotlib basics first, then seaborn. Matplotlib is the flexible foundation; seaborn is a friendlier layer on top for fast statistical charts. Here is why.
Understanding Statistics for Data Science
Statistics is the backbone of data science: it summarizes data, quantifies uncertainty, and tests hypotheses. Learn the core concepts every data scientist needs.
What Is Feature Engineering in Machine Learning?
Feature engineering is transforming raw data into inputs that help models learn. Good features often matter more than the algorithm. Learn the core techniques here.
Supervised vs Unsupervised Learning Explained
Supervised learning trains on labeled data to predict outcomes; unsupervised learning finds hidden structure in unlabeled data. Here is how they differ.
How to Handle Missing Data in a Dataset
Handle missing data by first understanding why it is missing, then choosing to delete or impute. This guide covers the methods and the pitfalls with pandas.
What Is Overfitting and How to Prevent It
Overfitting is when a model memorizes training data instead of learning patterns. Learn how to spot it and prevent it with cross-validation and regularization.
Introduction to Time Series Analysis
Time series analysis studies data ordered in time to find trends, seasonality, and patterns you can forecast. Learn the core concepts, methods, and tools here.
What Is A/B Testing? A Data-Driven Guide
A/B testing compares two versions of something to see which performs better using real data. Learn how to design, run, and interpret experiments correctly.
Building Your First Machine Learning Model
Build your first machine learning model step by step with scikit-learn: load data, split it, train, evaluate, and predict. A practical beginner walkthrough.
Data Visualization Best Practices for Beginners
Great data visualization makes insights obvious at a glance. Learn how to choose the right chart, cut clutter, use color well, and avoid misleading graphics.
What Is a Data Pipeline and How to Build One
A data pipeline moves data from source to destination, transforming it along the way. Learn the stages, ETL vs ELT, tools, and how to build a reliable one.
Pandas GroupBy Explained With Examples
Pandas GroupBy splits a DataFrame into groups, applies an aggregation, and combines the results. Learn the split-apply-combine pattern with clear examples.
Merging and Joining DataFrames in Pandas
Combine Pandas DataFrames with merge, join, and concat. Learn inner, left, right, and outer joins, how keys work, and how to avoid duplicated rows.
Pandas Apply, Map and Applymap Explained
apply, map, and applymap all transform Pandas data but at different scopes. Learn when to use each, and why vectorised operations usually beat them all.
How to Read CSV and Excel Files With Pandas
Load CSV and Excel files into Pandas with read_csv and read_excel. Learn to handle encodings, delimiters, dtypes, dates, and messy real-world files.
Handling Duplicates and Outliers in Data
Clean data by finding and removing duplicates and outliers. Learn duplicated, drop_duplicates, the IQR and z-score methods, and when to keep extremes.
Data Normalization vs Standardization Explained
Normalization scales data to a fixed range; standardization rescales to zero mean and unit variance. Learn when to use each and how to avoid data leakage.
What Is a Correlation and How to Measure It
Correlation measures how two variables move together, from -1 to +1. Learn Pearson, Spearman, correlation vs causation, and how to measure it in Python.
Descriptive vs Inferential Statistics Explained
Descriptive statistics summarise the data you have; inferential statistics draw conclusions about a larger population from a sample. Learn how each works.
Understanding Probability Distributions
A probability distribution describes how likely each outcome of a random variable is. Learn normal, binomial, and Poisson distributions and where they apply.
What Is Hypothesis Testing in Statistics
Hypothesis testing is a method for deciding whether data supports a claim about a population. Learn null vs alternative hypotheses, p-values, and errors.
What Is a p-value Explained Simply
A p-value measures how surprising your data would be if nothing interesting were happening. Learn what it means, how to read it, and the traps to avoid.
Understanding Confidence Intervals
A confidence interval is a range of plausible values for an unknown quantity, with a stated level of confidence. Learn to build, read, and avoid misreading them.
Linear Regression Explained for Beginners
Linear regression fits a straight line through data to predict a number from one or more inputs. Learn how it works, how to fit one, and when to trust it.
Logistic Regression Explained Simply
Logistic regression predicts the probability of a yes-or-no outcome by fitting an S-shaped curve. Learn how it works, how to read it, and where it shines.
What Is a Train-Test Split and Why It Matters
A train-test split holds back part of your data to test a model on examples it never saw, giving an honest estimate of real-world performance. Here is how and why.
What Is Feature Scaling in Machine Learning
Feature scaling puts numeric inputs on a comparable range so no single feature dominates a model. Learn normalization, standardization, and when each matters.
How to Choose the Right Chart for Your Data
The right chart depends on your goal: comparison, trend, distribution, relationship, or composition. Learn a simple framework for picking the best visualization.
Building Dashboards With Plotly and Dash
Dash lets you build interactive analytics dashboards in pure Python using Plotly charts and callbacks. Learn the layout, callbacks, and how to ship your first app.
What Is ETL vs ELT in Data Engineering
ETL transforms data before loading it; ELT loads raw data first and transforms it inside the warehouse. Learn the difference and how to choose between them.
Introduction to Apache Spark for Beginners
Apache Spark is a fast, distributed engine for processing huge datasets across many machines. Learn what it is, how it works, and how to run your first job.
What Is a Data Warehouse vs Data Lake
A data warehouse stores structured, cleaned data for fast analytics; a data lake stores raw data of any type cheaply. Learn when to use each and how they combine.
SQL Joins Explained With Examples
SQL joins combine rows from two or more tables using a related column. Learn INNER, LEFT, RIGHT, and FULL joins with clear examples and when to use each.
SQL Window Functions for Beginners
SQL window functions compute values across a set of rows related to the current row without collapsing them. Learn ROW_NUMBER, RANK, running totals, and more.
SQL Aggregations and GROUP BY Explained
SQL aggregations summarize many rows into single values using functions like SUM and COUNT, and GROUP BY splits rows into groups. Learn both with clear examples.
How to Optimize Slow SQL Queries
Optimize slow SQL queries by reading the execution plan, adding the right indexes, avoiding full-table scans, and selecting only the columns you need.
What Is Data Modeling in Databases
Data modeling is the process of designing how data is structured and related in a database. Learn conceptual, logical, and physical models plus normalization.
How to Learn Data Analytics for Free in 2026
Learn data analytics for free in 2026 with a practical self-study plan covering spreadsheets, SQL, Python, and dashboards, plus projects that make you job-ready.
Free Data Analyst Course: What to Study and in What Order
A free data analyst course laid out module by module: what to study and in what order, from spreadsheets and SQL to statistics, Python, and dashboards.
Data Analytics vs Data Analysis: What They Really Mean
Data analytics vs data analysis explained clearly: what each term really means, how they overlap, and why the distinction matters when you apply for jobs.
The Data Analyst Skill Stack: SQL, Spreadsheets, Python, BI
The data analyst skill stack explained: SQL, spreadsheets, Python, and BI tools, what each pillar does, and free ways to practise every one of them.
SQL for Data Analysts: A Free Beginner Course
A free beginner SQL course for data analysts: learn SELECT to window functions through real business questions, with practice tips and a clear learning order.
Exploratory Data Analysis Explained Step by Step
Exploratory data analysis explained step by step: profile your data, inspect distributions, handle outliers, check correlations, and surface your first insights.
How to Clean Messy Data with Pandas
Learn how to clean messy data with Pandas step by step: fix missing values, correct dtypes, drop duplicates, tidy strings, and reshape frames for analysis.
Data Visualization Best Practices for New Analysts
Master data visualization best practices as a new analyst: choose the right chart, use color with intent, label clearly, and avoid misleading visuals that lie.
Descriptive vs Predictive vs Prescriptive Analytics
Understand descriptive vs predictive vs prescriptive analytics with clear examples: what each level answers, the tools involved, and when your team needs each.
Top 12 Free Datasets to Practice Data Analysis
Discover the top 12 free datasets to practice data analysis, where to find each one, and a concrete project idea for every dataset to build a real portfolio.
From Spreadsheet to Dashboard: A Full Analytics Walkthrough
A full analytics walkthrough from spreadsheet to dashboard: import a raw CSV, clean it, analyze it, and build an interactive dashboard that answers real questions.
Statistics You Actually Need for Data Analytics
The statistics you actually need for data analytics: distributions, sampling, significance, and correlation vs causation, explained practically without heavy math.
A/B Testing Explained for Aspiring Analysts
A/B testing explained for aspiring analysts: form a hypothesis, size your sample, read p-values correctly, dodge common pitfalls, and interpret results with confidence.
How to Write SQL That Answers Business Questions
Learn how to write SQL that answers business questions by turning vague asks into precise queries with the right joins, filters, and aggregations that stakeholders trust.
Power BI vs Tableau vs Looker Studio: Which to Learn First
Power BI vs Tableau vs Looker Studio compared honestly for beginners, including which is free, which employers hire for, and which one you should learn first.
Data Analyst vs Data Scientist vs Data Engineer
Data analyst vs data scientist vs data engineer explained: the day-to-day work, skills, salary ranges, and which role a beginner should realistically target first.
What a Data Analyst Actually Does All Day
What a data analyst actually does all day: a realistic look at the daily workflow, meetings, tools, and deliverables behind the job title, minus the glamour.
Excel to Python: Level Up Your Data Analysis
Move from Excel to Python for data analysis and map your spreadsheet habits to pandas, so you gain power and repeatability without losing everyday productivity.
Building Your First Data Analytics Portfolio
Build your first data analytics portfolio with three project ideas, a clear way to present each analysis, and the best free places to host your work for employers.
Pandas GroupBy: The Analyst's Most Useful Tool
Master pandas GroupBy, the analyst's most useful tool, with the split-apply-combine pattern, real business questions, and clear examples you can reuse immediately.
Data Storytelling: Turning Charts Into Decisions
Learn data storytelling: how to structure a narrative, write executive summaries, and present charts to non-technical stakeholders so your analysis drives real decisions.
How to Do Cohort Analysis From Scratch
Learn how to do cohort analysis from scratch: build retention cohorts step by step with a worked example, read a retention curve, and turn it into product decisions.
KPIs and Metrics Every Analyst Should Understand
Master the KPIs and metrics every analyst should understand: north-star metrics, vanity versus actionable metrics, and how to design metrics that actually drive decisions.
Time Series Basics for Data Analysts
Learn time series basics for data analysts: understand trend and seasonality, smooth data with moving averages, and build simple forecasts you can actually explain.
Regular Expressions for Data Cleaning
Learn regular expressions for data cleaning: practical regex patterns analysts use to validate, extract, and standardize messy text data quickly and reliably.
How to Build an Interactive Dashboard for Free
Learn how to build an interactive dashboard for free using tools like Looker Studio and Streamlit, with a step-by-step walkthrough from data source to shareable link.
Correlation vs Causation: The Analyst's Trap
Understand correlation vs causation, the analyst's trap: why correlation misleads, how confounders fool you, and practical ways to reason about cause and effect.
Data Analytics Interview: SQL Questions and Answers
Master the SQL questions data analytics interviews actually ask — joins, window functions, aggregation and dedup — with worked answers you can explain out loud.
The Modern Data Stack Explained Simply
Understand the modern data stack in plain English — ingestion, warehouse, transformation and BI — and how the pieces fit into one reliable analytics pipeline.
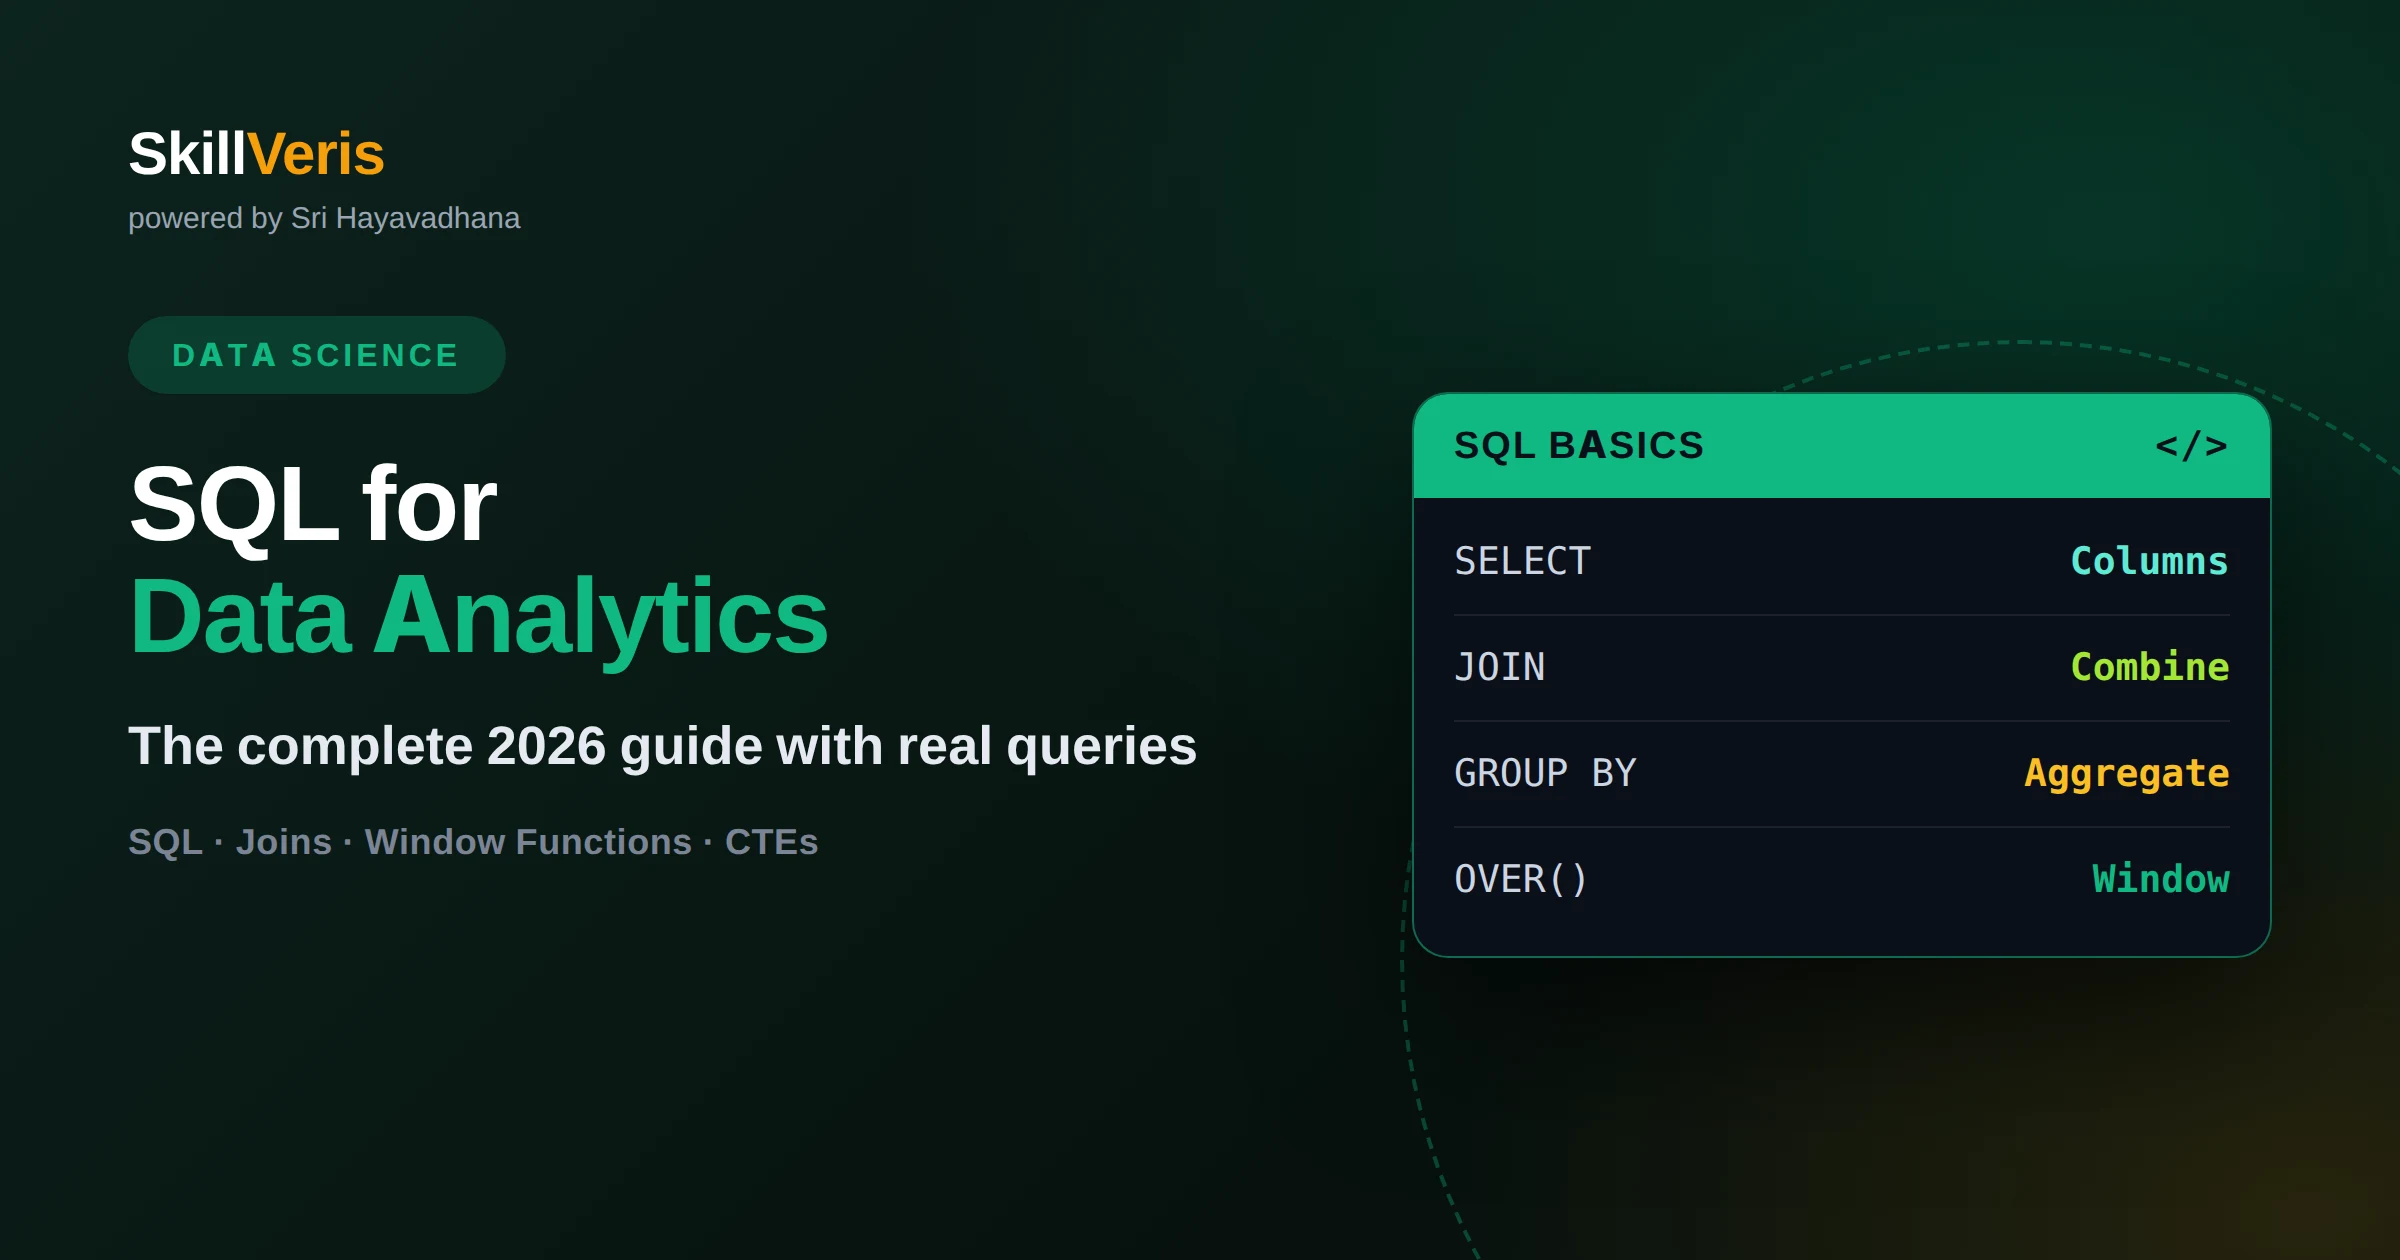
SQL for Data Analytics: Complete Guide
SQL for data analytics means using SELECT, JOIN, GROUP BY, and window functions to turn raw tables into answers fast.
What Is Data Analysis? Definition, Process, and Examples
Data analysis is the process of inspecting, cleaning, and modeling data to uncover useful patterns and support decisions, spanning descriptive, diagnostic, predictive, and prescriptive approaches used across every industry.
What Is Data? A Clear Definition and Practical Guide
Data is any collected fact, measurement, or observation that can be processed to produce information. This guide defines data clearly, covers its main types, and explains how it becomes usable insight.
What Is a Database? A Plain-English Guide
A database is an organized collection of data stored so it can be easily accessed, managed, and updated by software. This guide explains the core types, how databases work, and why nearly every application depends on one.
What Is Data Annotation in Machine Learning?
Data annotation is the process of labeling raw data so a machine learning model can learn from it. This guide explains how annotation works, common types, quality control, and what a data annotator role actually involves.
SQL Join Types Explained With Examples
SQL joins combine rows from two or more tables based on a related column, and the five main types are INNER, LEFT, RIGHT, FULL OUTER, and CROSS join. This guide explains what each join returns and when to use it, with clear examples for every type.
Data Collection Methods: A Practical Overview
Choosing the right data collection method shapes everything that follows in an analysis. This guide compares surveys, observation, experiments, interviews, and existing records, plus how to choose one.
AI in Data Science: How the Two Fields Connect
AI in data science refers to how artificial intelligence techniques, especially machine learning, are used within the broader data science workflow to build predictive models and automate analysis. This guide explains how the two fields overlap.
Best Data Analysis Tools and How to Choose One
The right data analysis tool depends on your data size, technical skill, and whether you need visualization, statistics, or database querying. This guide covers spreadsheet, SQL, BI, and programming-based tools and when each one makes sense.
What Is Market Analysis and How Do You Do It?
Market analysis is the process of evaluating an industry, its customers, and its competitors to guide business decisions like pricing, expansion, or product launches. This guide covers the main components and a practical step-by-step approach.
What Does a Database Analyst Do? Role, Skills, and Path
A database analyst designs, maintains, and optimizes the databases that store an organization's data, ensuring it stays accurate, secure, and fast to query. This guide covers the role's daily work, required skills, and how to break into it.
SQL Commands Every Data Analyst Should Know
SQL commands let you create, query, update, and manage data inside a relational database. This guide covers the core command categories, the most commonly used statements, and how they fit together in real queries.
Data Scientist Salary: What Really Drives the Range
A data scientist's pay depends far more on location, seniority, and specialization than on the job title alone. This guide breaks down the real factors that move compensation up or down, without inventing numbers you can't rely on.
Types of Data: A Clear Guide to How Data Is Classified
Data is generally classified as qualitative or quantitative, and further split into structured, unstructured, and semi-structured formats. Knowing these categories shapes how you store, query, and analyze information correctly from the start.
What Does SQL Stand For? A Beginner's Guide
SQL stands for Structured Query Language, the standard language used to store, retrieve, and manage data in relational databases. This guide covers what SQL means, how it works, and why it remains essential for data roles today.
How Much Do Data Analysts Make? A Salary Guide
Data analyst pay varies by experience, industry, location, and skill set, generally rising as analysts add SQL, visualization, and statistical skills. This guide explains what drives data analyst earning potential and how to grow it.
Big Data Analytics: What It Is and How It Works
Big data analytics is the process of examining extremely large, fast-moving, and varied datasets to uncover patterns that traditional tools can't handle. This guide explains the core concepts, tools, and use cases you need to know.
What Does a Data Engineer Do, and How Do You Become One?
A data engineer builds and maintains the pipelines and infrastructure that move and organize data so analysts and models can use it reliably. This guide explains the role's core responsibilities and the skills needed to break into it.
Types of Data Structures Every Developer Should Know
Data structures are organized ways of storing and accessing data, and each type - arrays, linked lists, stacks, trees, and more - trades off speed and memory differently. This guide breaks down the essentials.
Data Interpretation: How to Read Data Like an Analyst
Data interpretation is the process of reviewing data through tables, charts, or graphs to draw meaningful conclusions from it. This guide covers common formats, the skills involved, and how to avoid common interpretation mistakes.
How to Learn Data Structures and Algorithms the Right Way
Learning data structures and algorithms well means understanding how each structure behaves and why, not memorizing solutions. This guide lays out a practical learning order, study techniques, and how to actually prepare for coding interviews.
What Does a SQL Developer Do? Skills, Tools, and Path
A SQL developer designs, writes, and optimizes database queries and structures that power applications and reports. This guide covers what the role actually involves day to day, the core skills required, and how to break into the field.
Certified Data Protection Officer: Role and Path Explained
A Certified Data Protection Officer oversees how an organization collects, stores, and processes personal data in line with privacy law. This guide explains the role's responsibilities, required skills, and how to start building toward it.
Semantic Analysis: How Machines Understand Meaning
Semantic analysis is the process of extracting meaning from text or data rather than just matching keywords or patterns. This guide explains how it works, where it's used, and how it connects to modern natural language processing.
What Is Data Mining? A Practical Introduction
Data mining is the process of discovering patterns, correlations, and anomalies in large datasets to support decisions. This guide explains the core techniques, the typical workflow, and where data mining fits alongside analytics and machine learning.
Data Analyst vs Business Analyst: Key Differences
A data analyst works primarily with numbers, queries, and dashboards to find patterns in data, while a business analyst focuses on translating business needs into requirements and process improvements. This guide compares both roles clearly.
What Is a Data Model? A Practical Introduction
A data model defines how data is structured, related, and stored so systems and people can work with it consistently. This guide covers the three levels of data modeling and why they matter for reliable software.
The Financial Analysis Tools Every Analyst Should Know
Financial analysis tools range from spreadsheets to SQL and dedicated BI platforms, each suited to different tasks. This guide explains what each tool is best for and how analysts typically combine them in a real workflow.
Data Science Course Fees: What Actually Affects the Cost
Data science course fees vary widely depending on format, institution, and depth, ranging from free self-study resources to structured paid programs. This guide explains the factors that drive cost so you can evaluate options without a fixed number.
What Is BigQuery and How Does It Work?
BigQuery is Google Cloud's fully managed data warehouse built for running fast SQL queries over massive datasets without managing servers. This guide explains how it works, its architecture, and when it fits into a data analytics workflow.
Is a Data Science Bootcamp Worth It? A Practical Guide
A data science bootcamp is an intensive, short-term program designed to build job-ready skills in weeks rather than years. This guide explains what bootcamps cover, who they suit, and how to evaluate one before enrolling.
Business Statistics 101: How Data Drives Decisions
Business statistics applies statistical methods to real commercial questions, from forecasting demand to testing whether a marketing change actually worked. This guide covers the core concepts every analyst and manager should understand.
What Is Metadata? Data About Your Data, Explained
Metadata is structured information that describes other data, such as a file's creation date, a photo's location, or a database column's data type. This guide explains what metadata is, its main types, and why it matters for data work.
Data Granularity: What It Means and Why It Matters
Data granularity refers to the level of detail at which data is recorded, from individual transactions to yearly totals. This guide explains the concept, why it matters for analysis, and how to choose the right granularity for a task.
How Spark Executes Your Job: Stages, Shuffles and Partitions
Spark turns your DataFrame code into a logical plan, optimises it, and splits it into stages separated by shuffles, with one task per partition. Once you can read that chain, slow jobs stop being mysterious — you can point at the stage, the shuffle and the skewed key causing them.
Analytical SQL: Patterns for Turning Tables Into Answers
Analytical SQL becomes reliable when you treat it as a sequence of patterns rather than one clever query. This guide walks the repeatable steps — define the grain, filter, aggregate, window, validate — and shows how grain mistakes, NULL semantics and hidden fan-out produce numbers that look plausible and are wrong.
PyTorch Deep Learning: How Training Loops Actually Work
A PyTorch training loop is four explicit steps — forward pass, loss, backward pass, optimiser step — and understanding them is what lets you debug a model rather than guess at it. This guide walks the loop end to end, explains autograd's graph, and names the failure modes each step produces.
Analytics Engineering With dbt: Modelling the Warehouse
dbt makes SQL transformation behave like software: models in version control, tests that fail a build, dependencies resolved from a graph, and documentation generated from the code that produces the tables. This article covers the modelling layers, the testing strategy and the failure modes that appear as a project grows.
The Scientific Python Stack: NumPy, SciPy and Friends
The scientific Python stack is built on one data structure: NumPy's ndarray, a typed block of contiguous memory with shape and stride metadata. SciPy, pandas, scikit-learn and the deep learning frameworks all sit on that foundation, and understanding it explains their performance, their errors and their interoperability.
Building Data Pipelines: Ingestion, Transformation, Orchestration
A production data pipeline has four layers — ingestion, storage, transformation and orchestration — and each must guarantee specific reliability properties. This guide walks the layers, states what each has to promise, and shows how idempotency, partitioning, quality checks and freshness monitoring turn a fragile nightly script into something you can operate.
The scikit-learn Workflow: From Raw Data to Evaluated Model
The scikit-learn workflow is one repeatable loop: split before you look, compose every preprocessing step into a Pipeline, cross-validate with a splitter that matches your data, choose a metric that matches the cost of errors, and tune inside the same pipeline. This guide walks that loop and the leakage traps at each step.
Choosing the Right Chart: A Data Visualization Guide
Pick a chart by naming the question first: comparison, distribution, composition or relationship. Each of those four question types has a small set of forms that encode it honestly and a larger set that distorts it. This guide gives the decision path, the perceptual reasoning behind it, and the failure modes to avoid.
Statistical Inference for Practitioners: Sample to Decision
Inference is one workflow, not a box of formulas: you sample, you estimate with uncertainty, you decide, and you state what would change your mind. This guide connects sampling variation, estimation, testing and decision-making so the tools stop feeling arbitrary and start answering the question you actually asked.
Data Wrangling With Pandas: A Practical Field Guide
Wrangling in pandas follows a repeatable arc: load with explicit types, inspect, clean, reshape, join, aggregate, then export in a format that preserves what you fixed. This guide walks that arc, names the failure at each stage, and shows the habits that keep a pipeline reproducible.
TensorFlow and Keras: How the Two Fit Together
Keras is the model-building API and TensorFlow is the tensor runtime beneath it. Learn which layer each task belongs in — models and callbacks in Keras, data pipelines and graph compilation in TensorFlow — so shape errors, retracing surprises and deployment questions stop being confusing.
A Practical Feature Engineering Playbook for Tabular Data
Feature engineering for tabular data is best organised by data type and model family, with a validation loop that proves each feature earns its place. Learn how to treat numeric, categorical, temporal and event data differently, avoid leakage, and decide which transformations gradient-boosted trees genuinely need versus which only linear models do.
Text Analytics Pipelines: From Raw Documents to Insight
A text analytics pipeline moves documents through ingestion, encoding repair, normalisation, representation, modelling and evaluation. This guide shows what each stage owns, how a decision made early constrains everything downstream, and how to spot the stage responsible when the final numbers look wrong.
Forecasting Time Series: Choosing a Model and Proving It Works
Start with a naive baseline, add candidate models only when they beat it, and evaluate everything with rolling-origin backtesting that never lets future data inform a past prediction. This guide walks the full protocol: diagnosing the series, choosing model families, selecting metrics that survive your data, and detecting leakage before deployment.
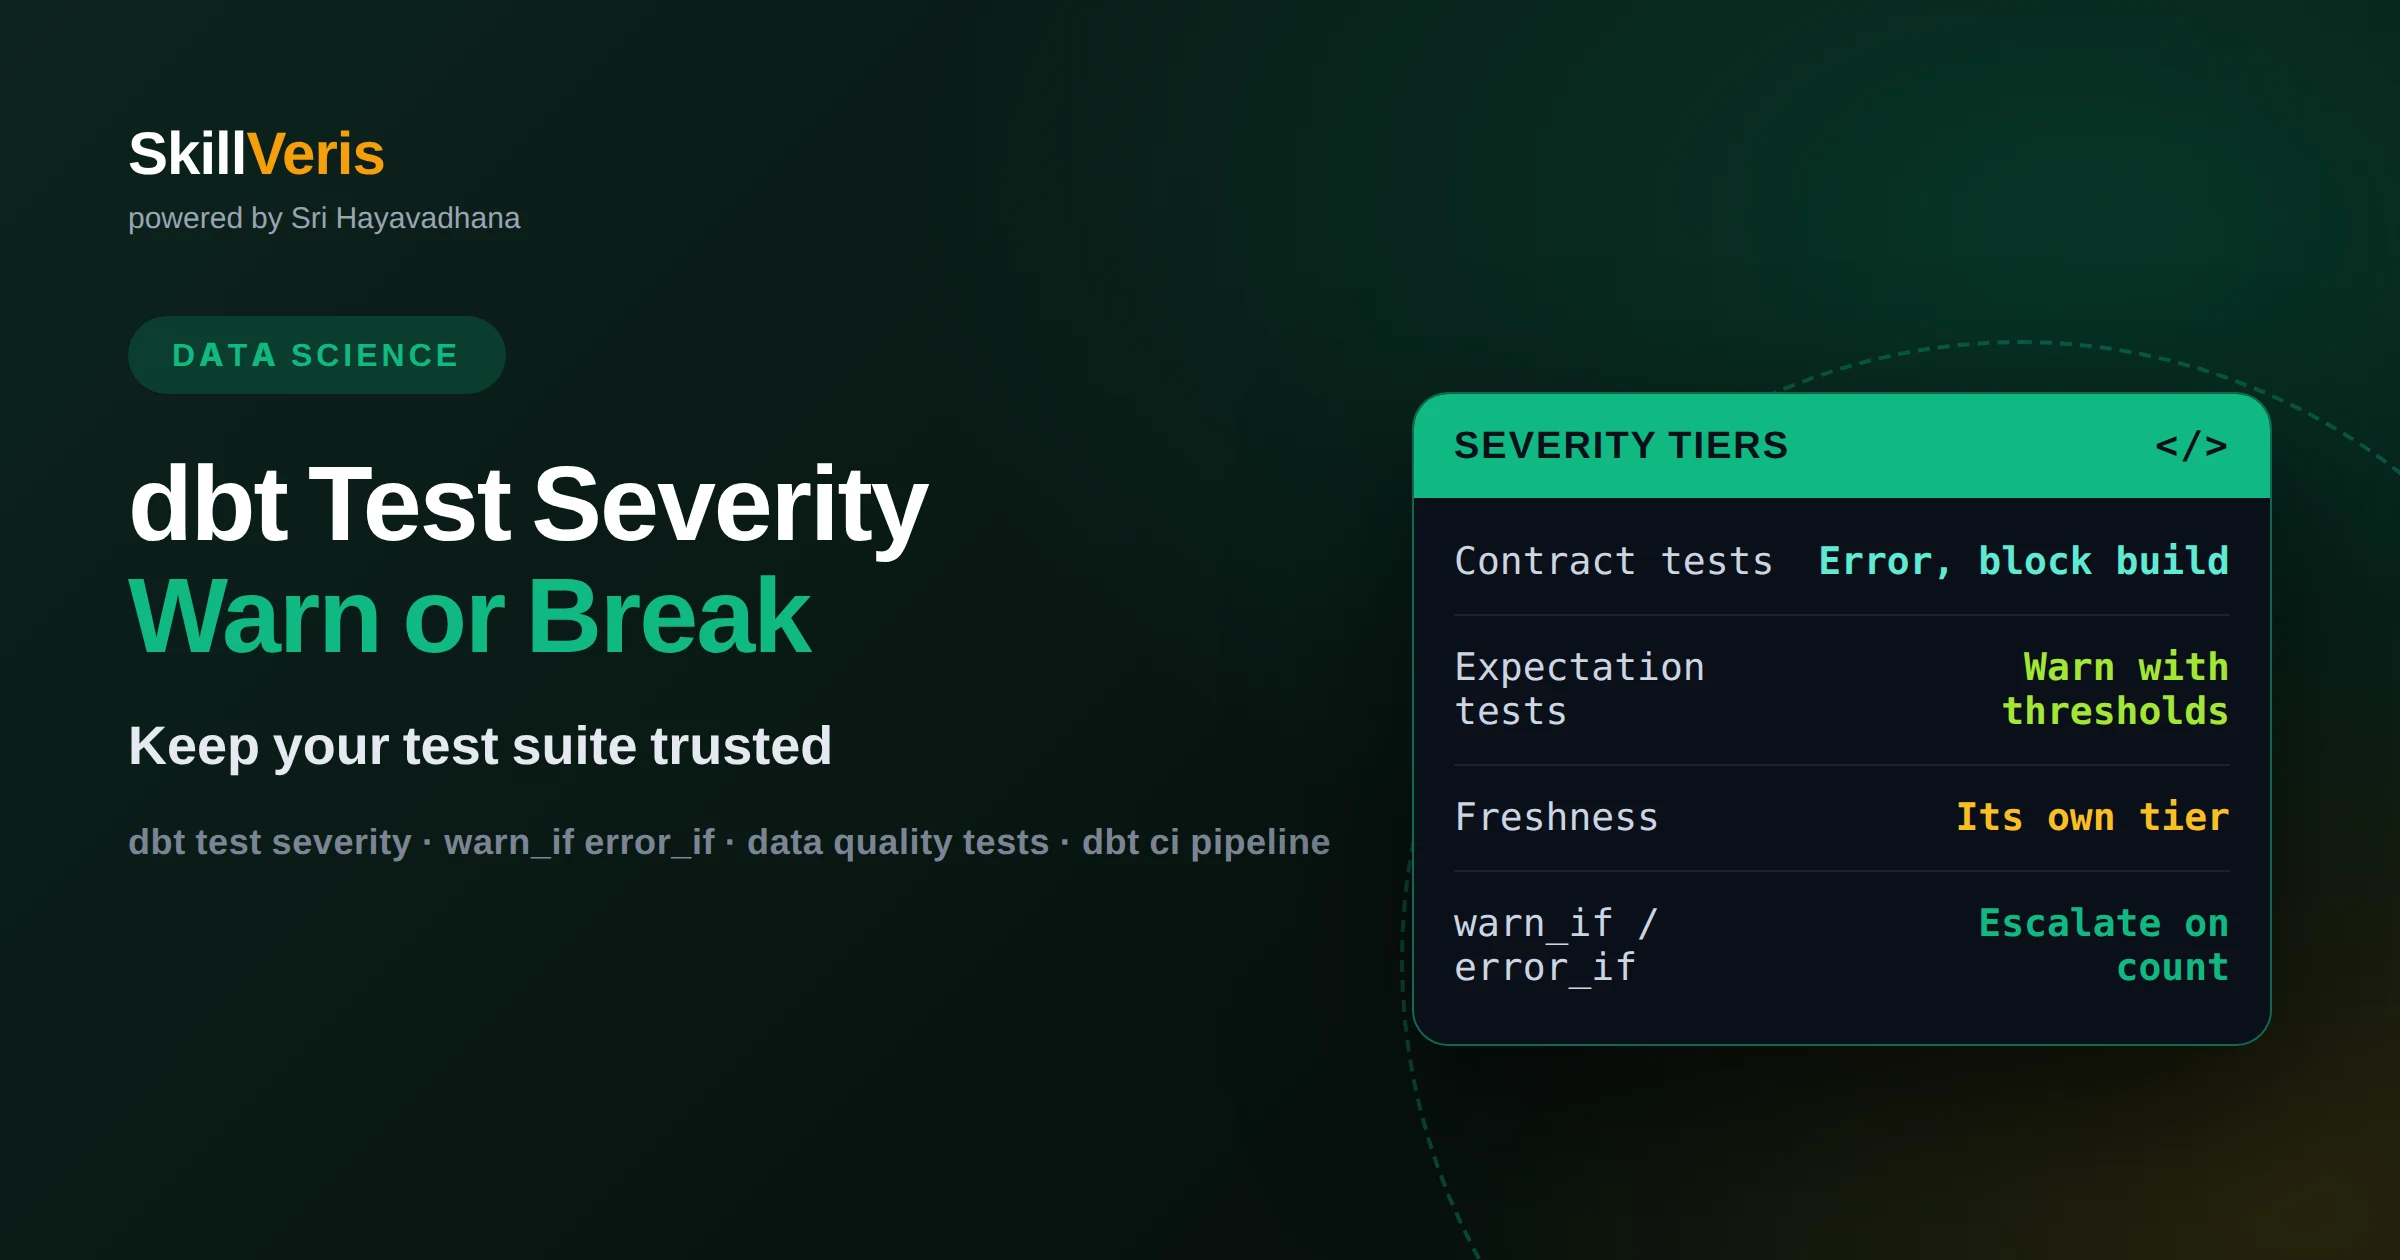
dbt test severity: when a failing test should warn and when it should break the build
Tier your dbt tests by what they guarantee. Tests that protect a key or a grain error and block the build. Tests that describe expected but not guaranteed data shape warn with a threshold. Freshness gets its own tier. A suite everyone ignores is worse than a smaller suite that is always green.
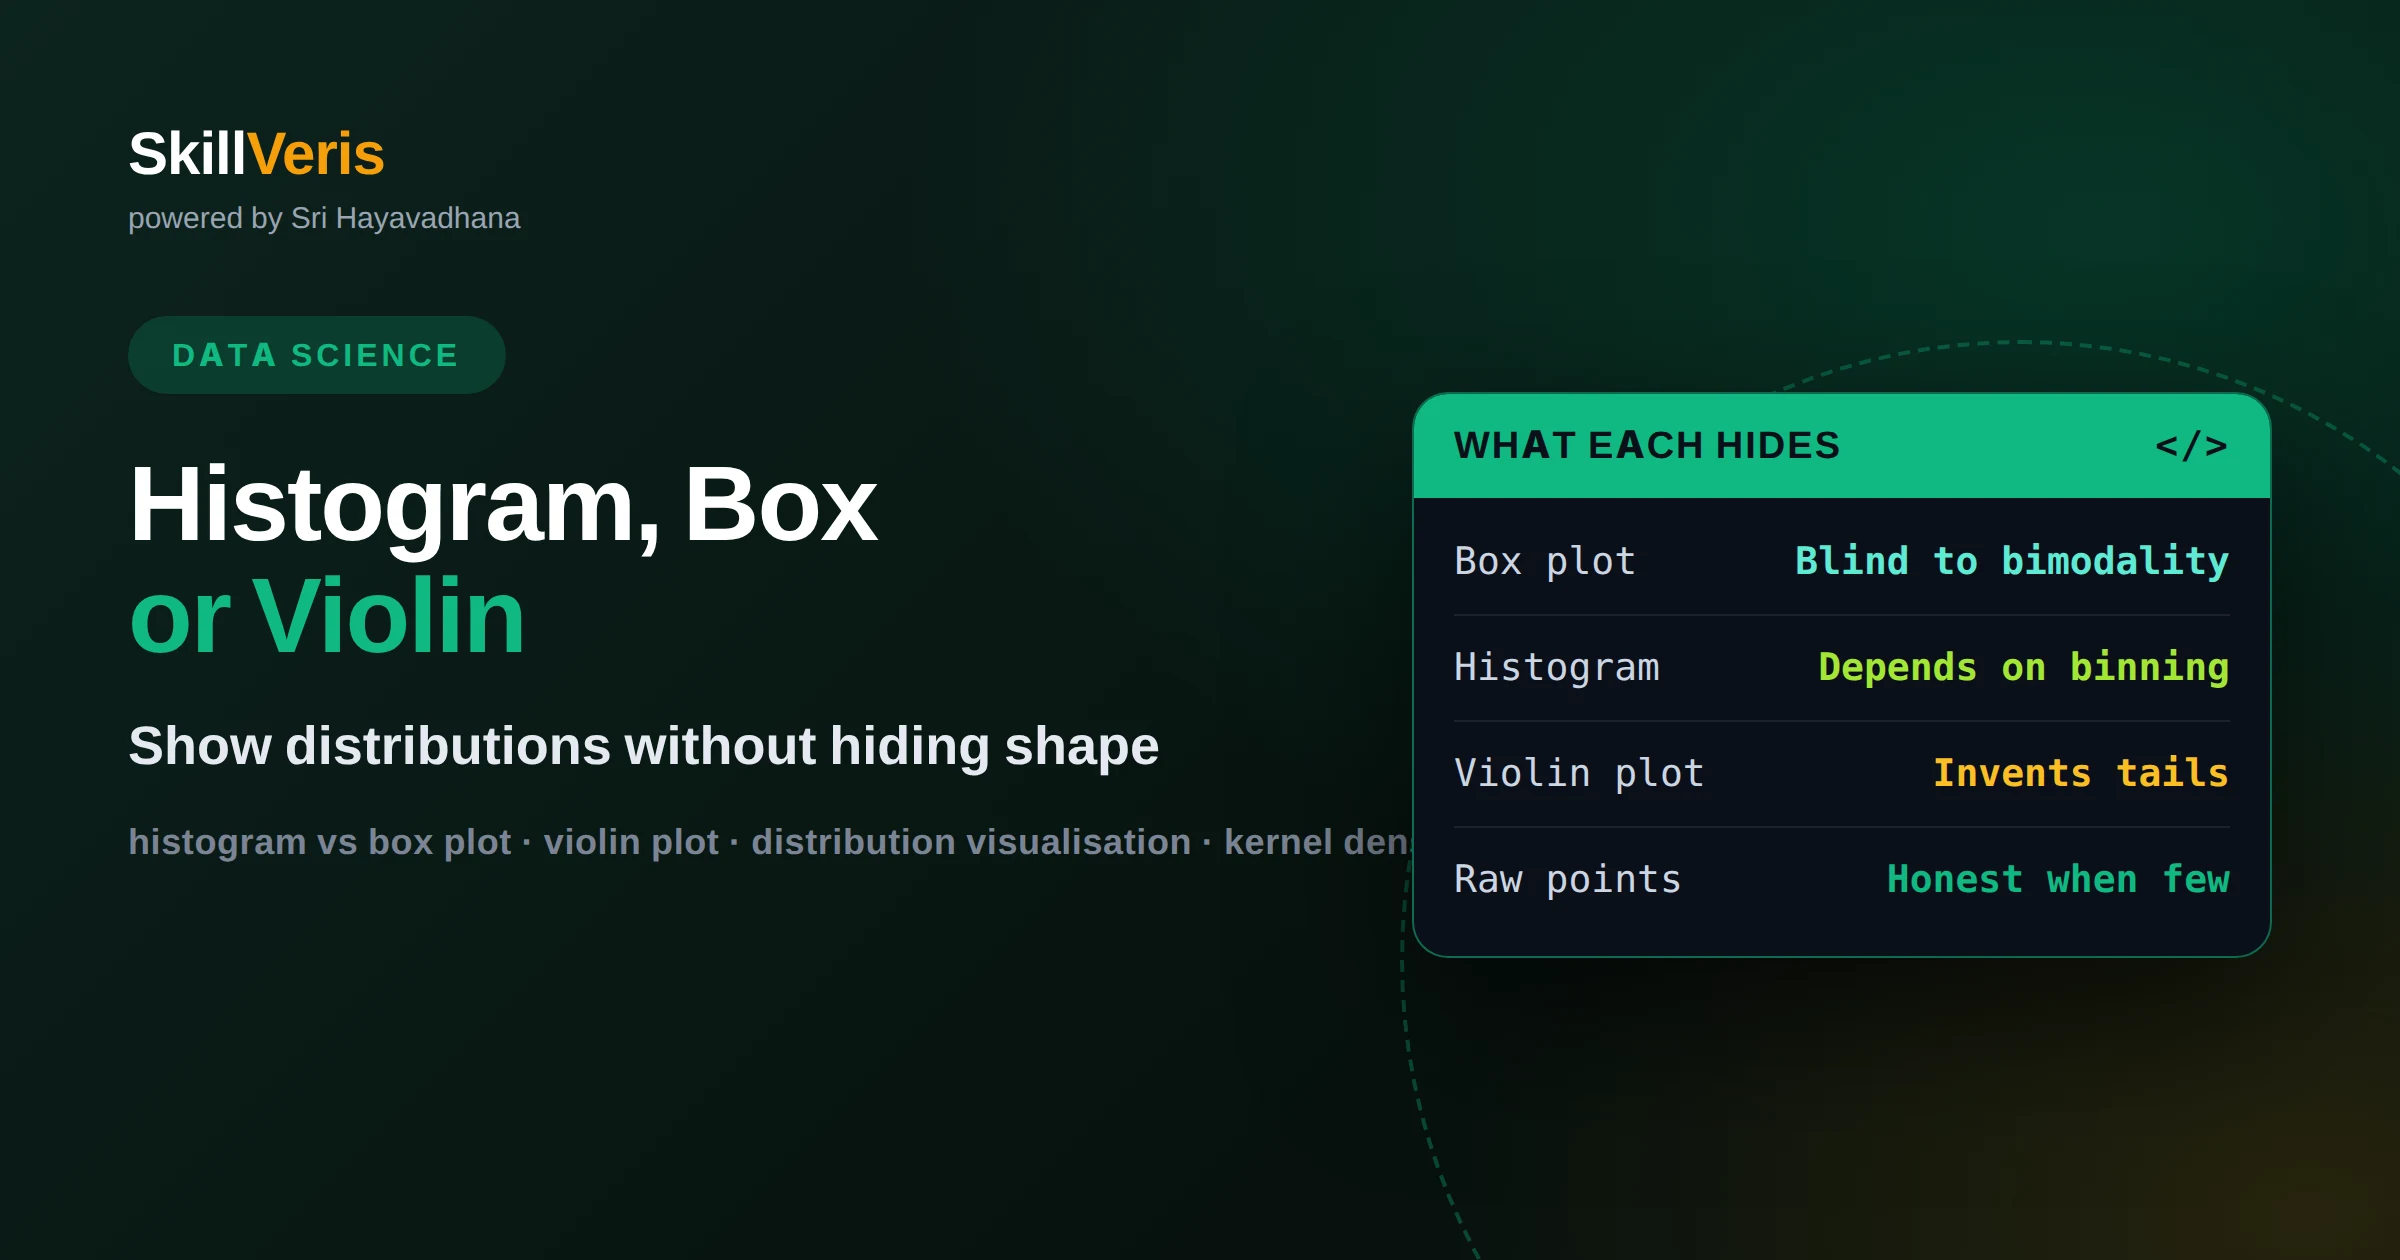
Histogram vs box plot vs violin plot: which shows your distribution honestly
Choose by what each form conceals. A box plot hides bimodality behind five summary numbers, a histogram's shape depends on bin width so any single binning is an argument rather than a fact, and a violin's smoothing invents tails at small sample sizes. This article gives a decision rule based on sample size, audience and whether you are comparing groups.
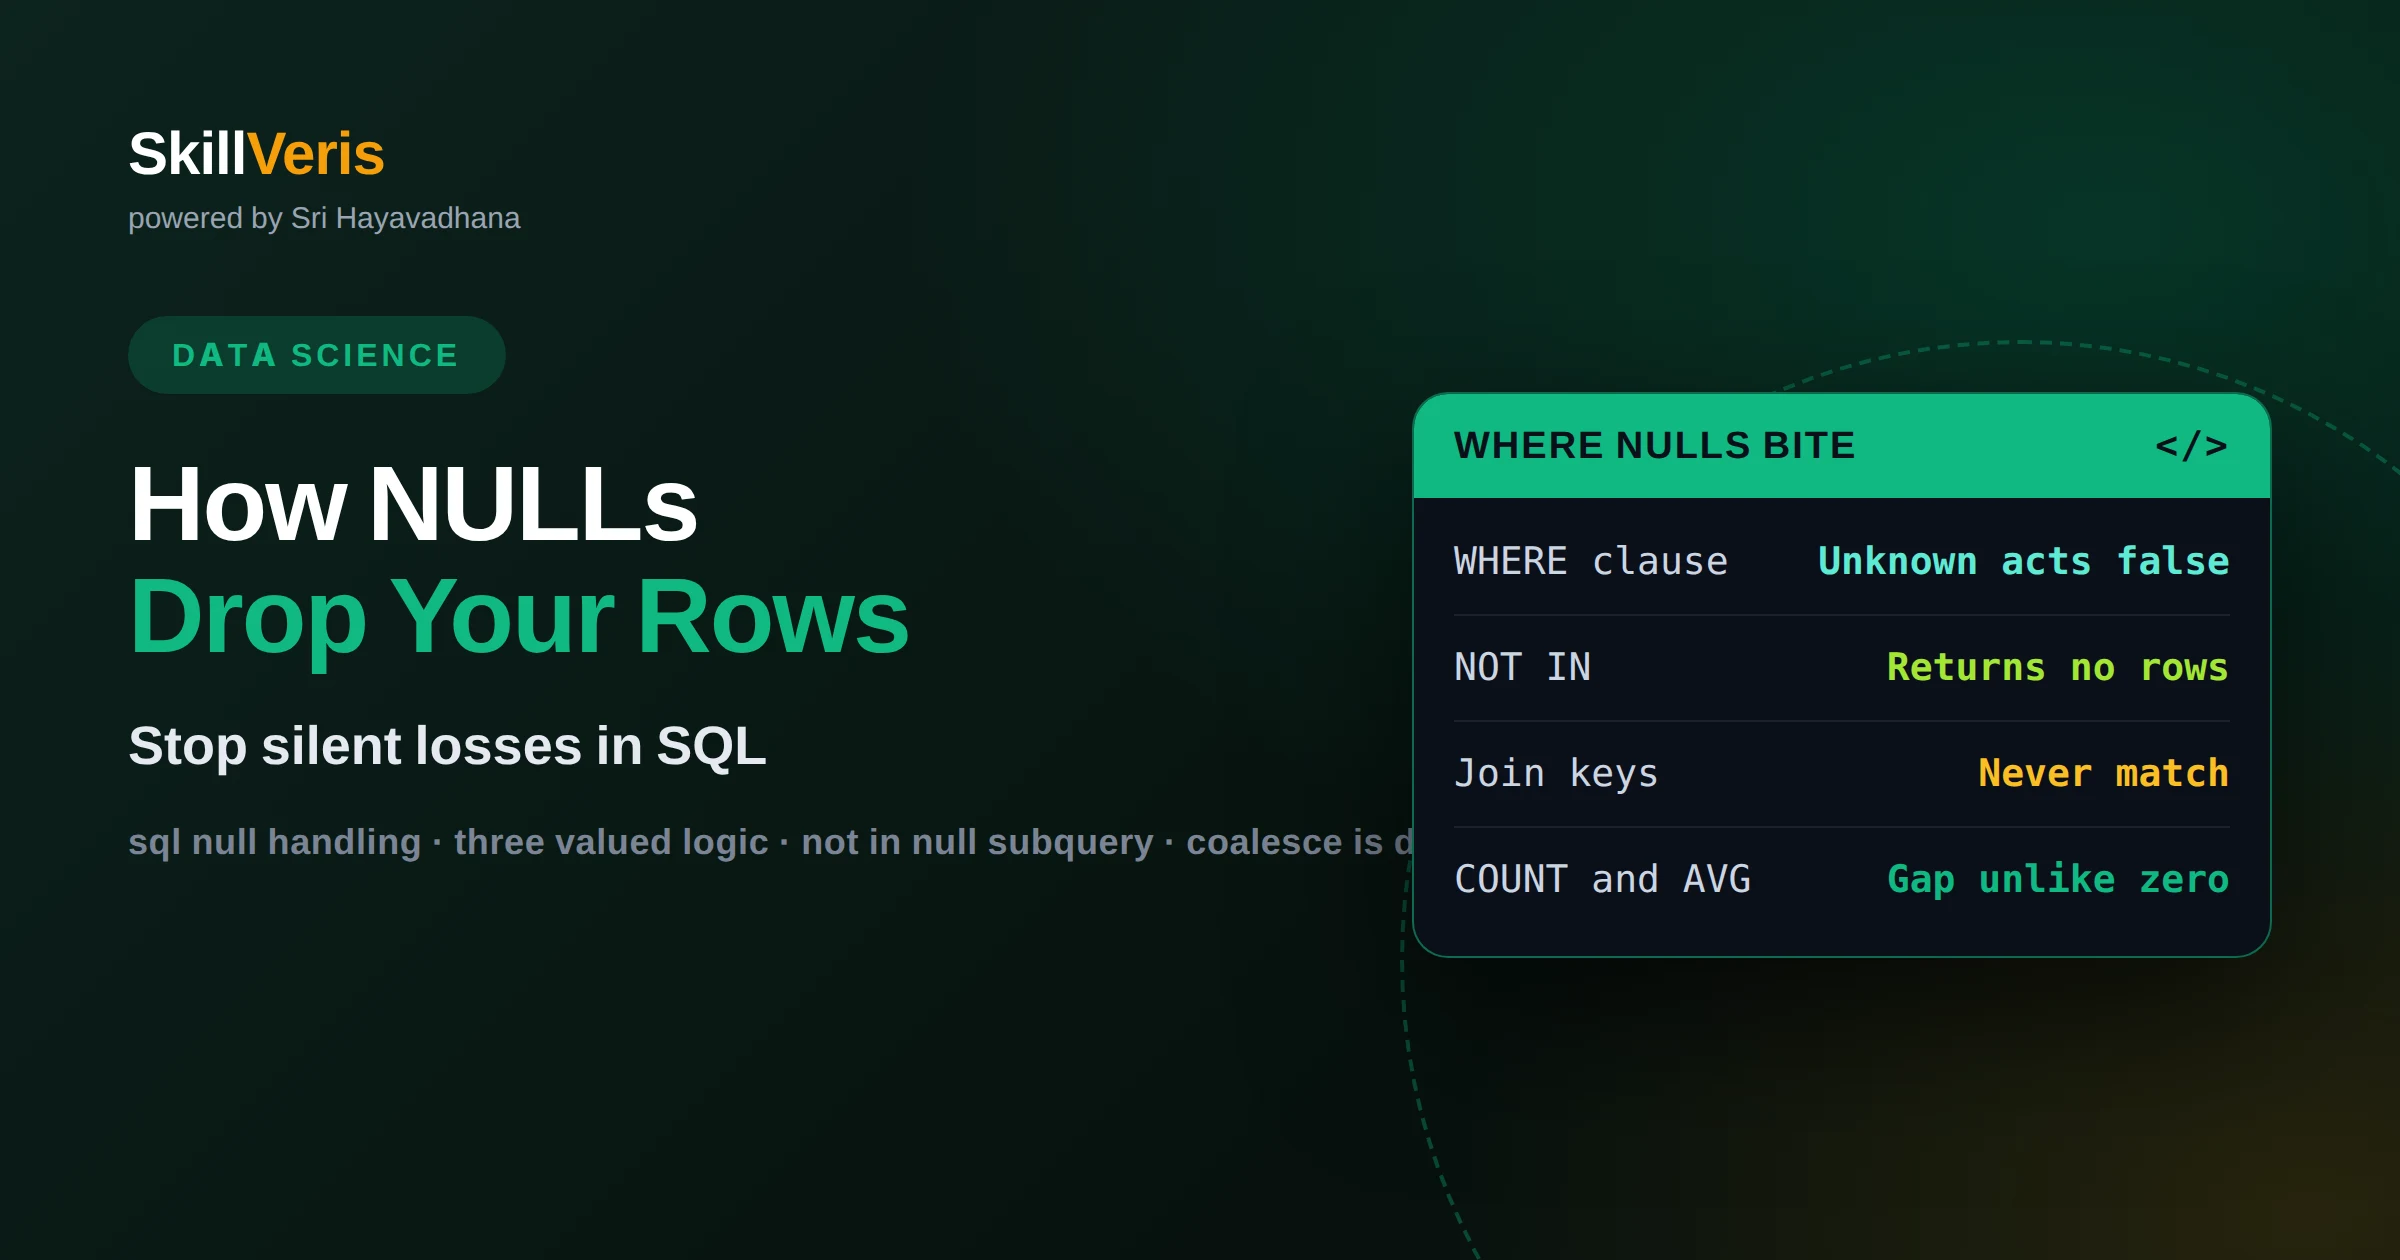
How NULLs quietly drop rows from your SQL filters and aggregates
NULL is unknown, not a value, so comparisons against it return unknown and filters discard those rows without warning. Learn the five places three-valued logic changes an answer — NOT IN, inequality filters, COUNT, join keys and aggregates — and how to state intent with COALESCE or IS DISTINCT FROM.
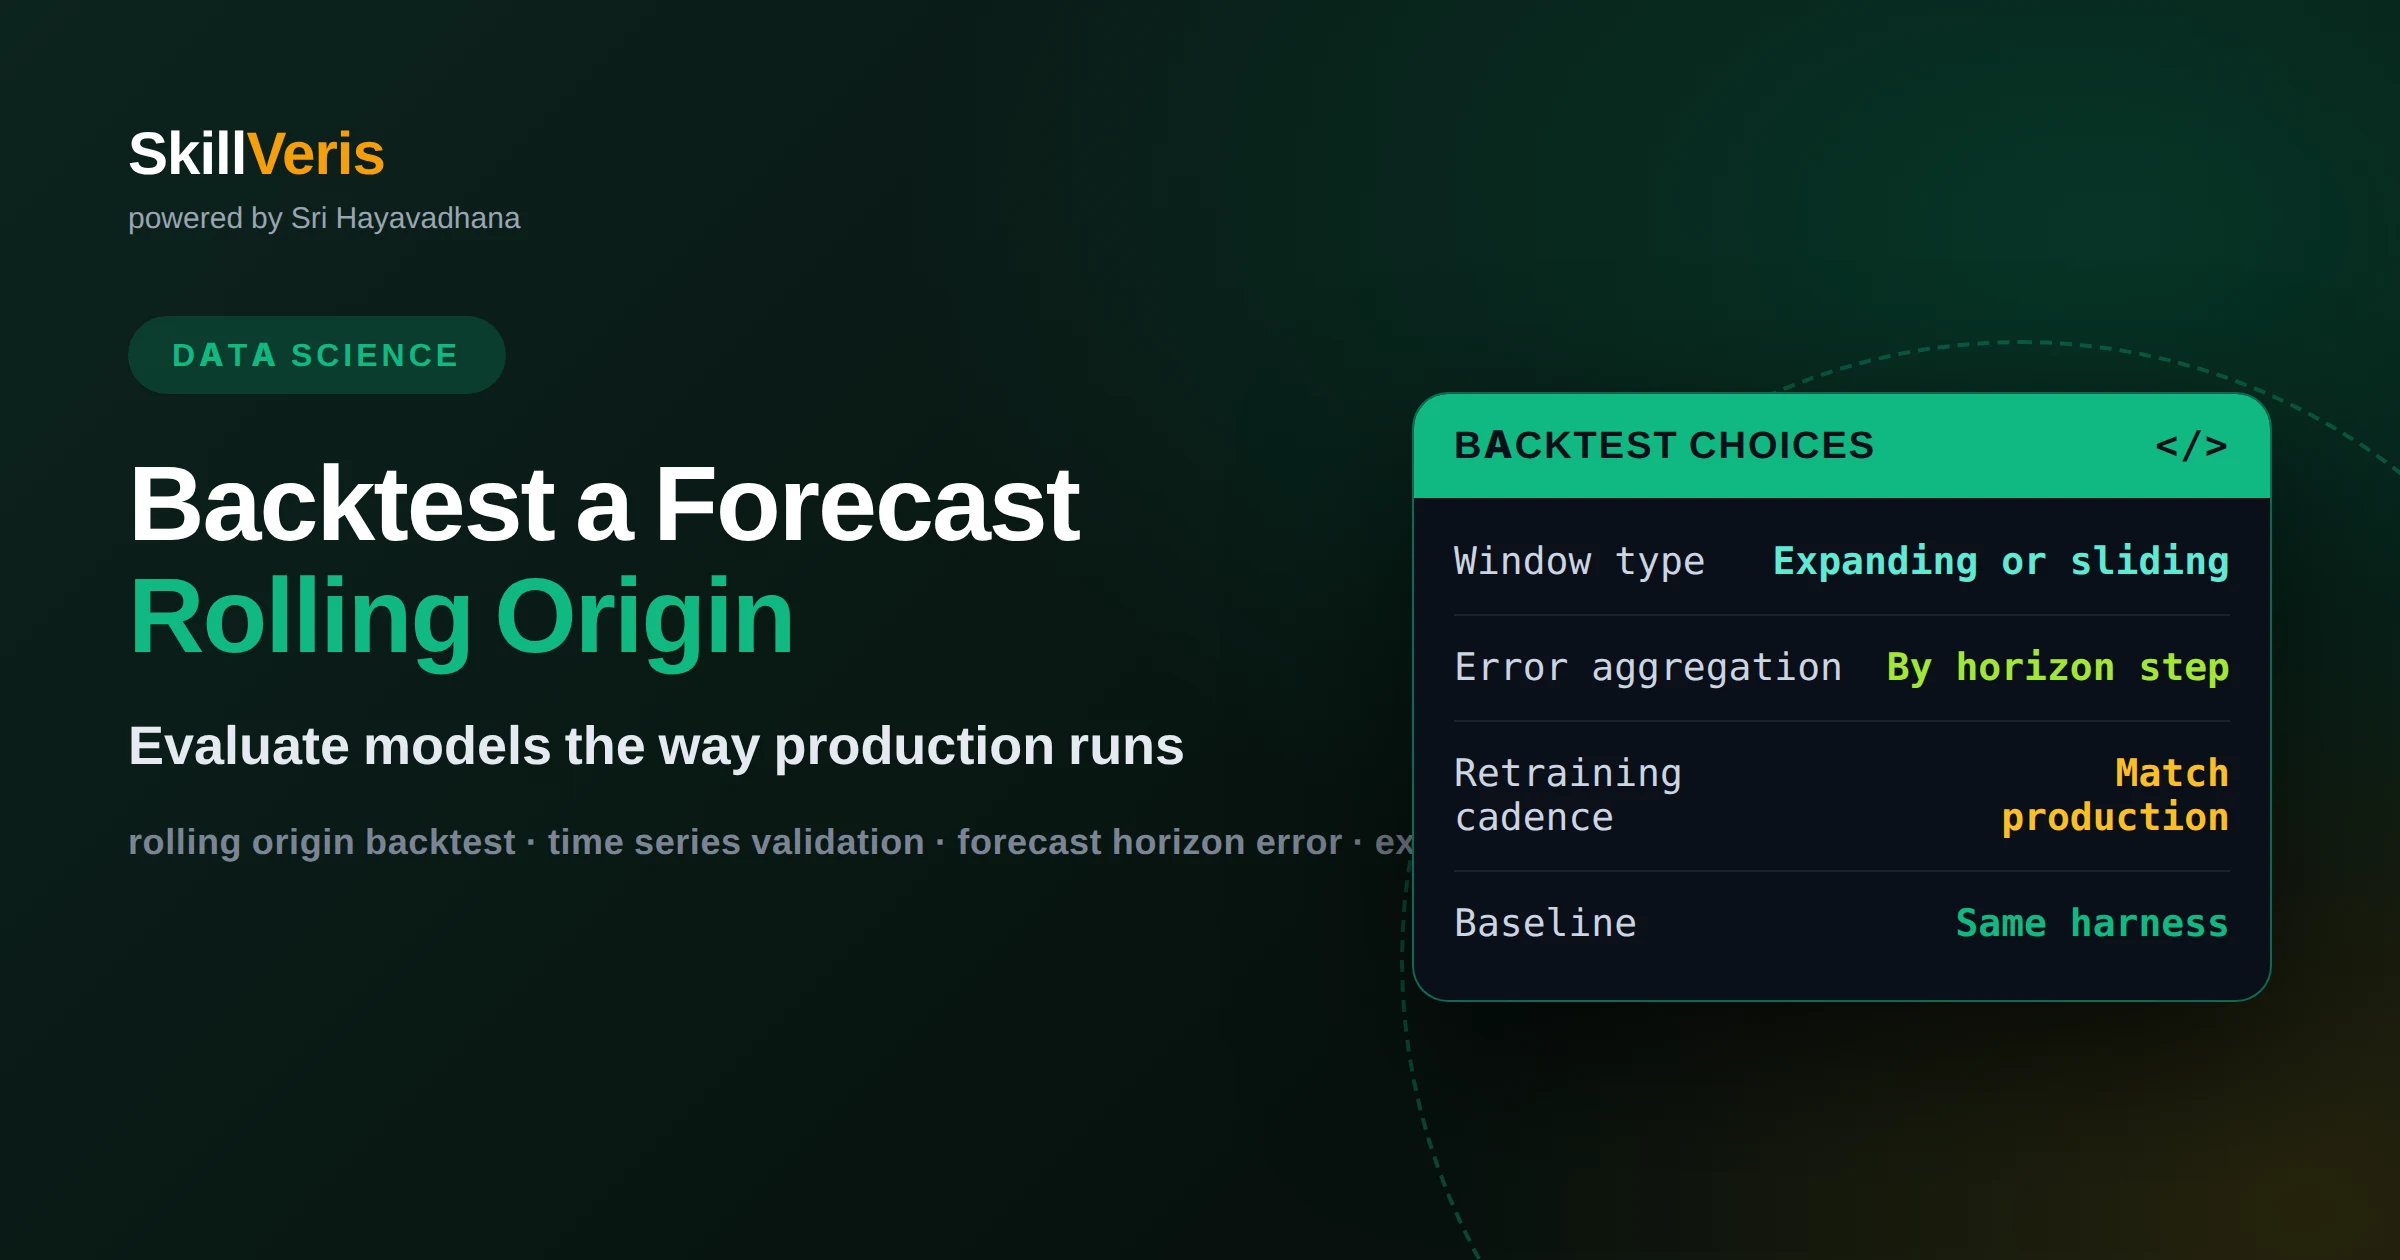
How to backtest a forecast with rolling-origin evaluation
Rolling-origin backtesting picks a cut-off, fits on history only, forecasts the full horizon, then rolls the cut-off forward and repeats. Aggregate the errors by horizon step rather than overall, because a model can be excellent one step ahead and useless at the horizon the business plans on. This article walks the mechanics and the choices inside them.
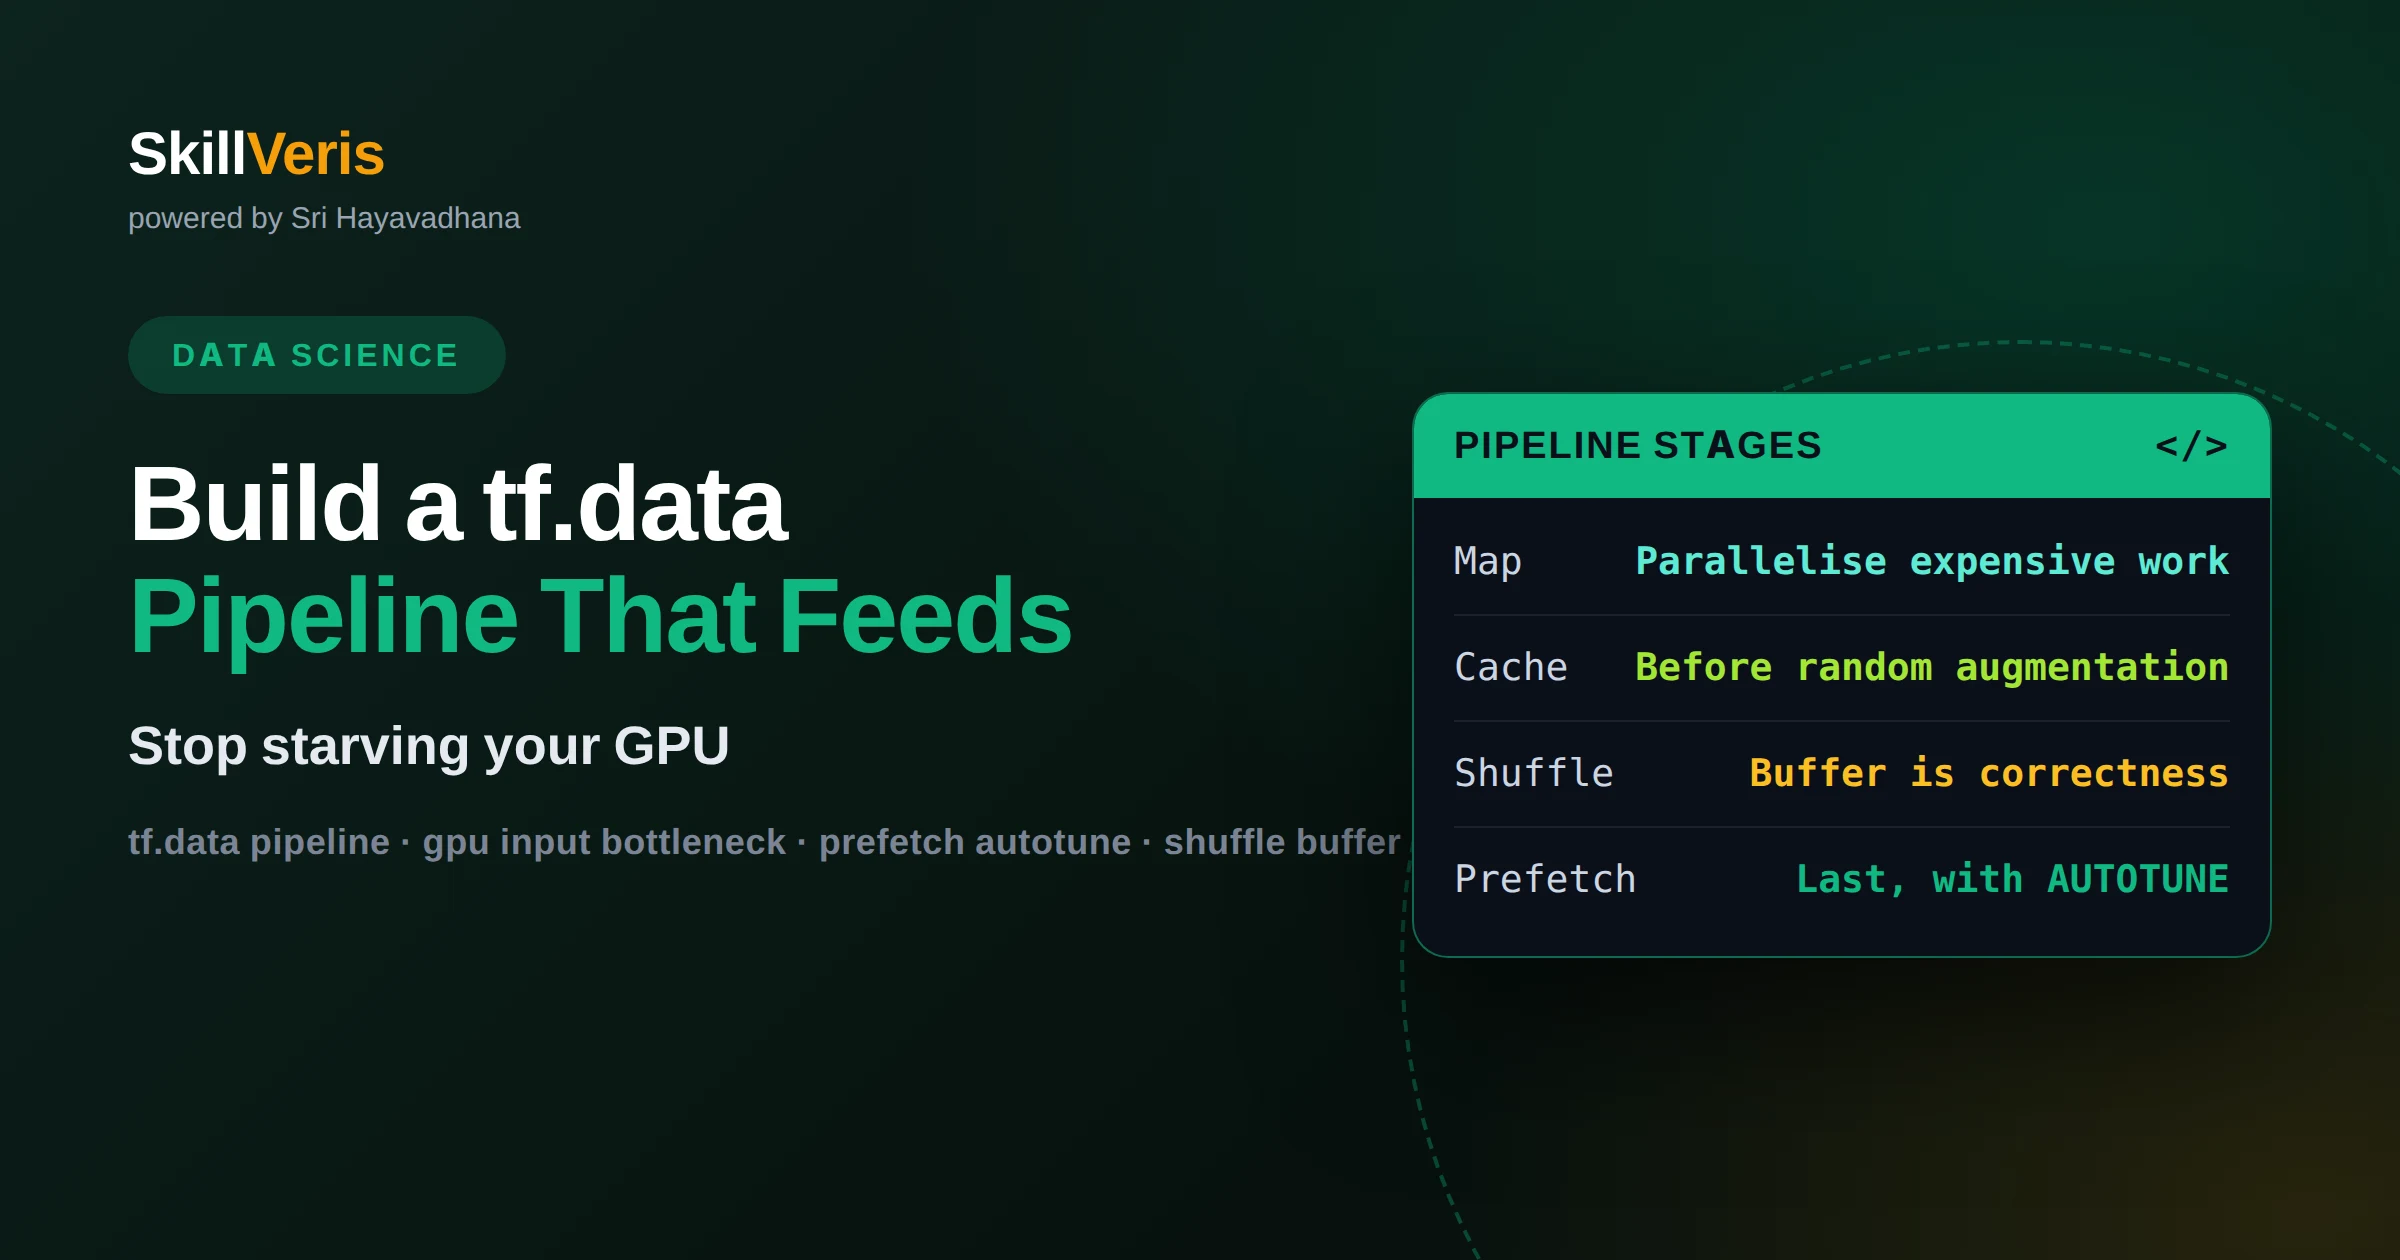
How to build a tf.data pipeline that stops starving your GPU
Low GPU utilisation usually means the input pipeline cannot keep up. Confirm it by timing the pipeline alone, then order the operations correctly — map, cache, shuffle, batch, prefetch — and parallelise the expensive stages. Ordering affects correctness as well as throughput.
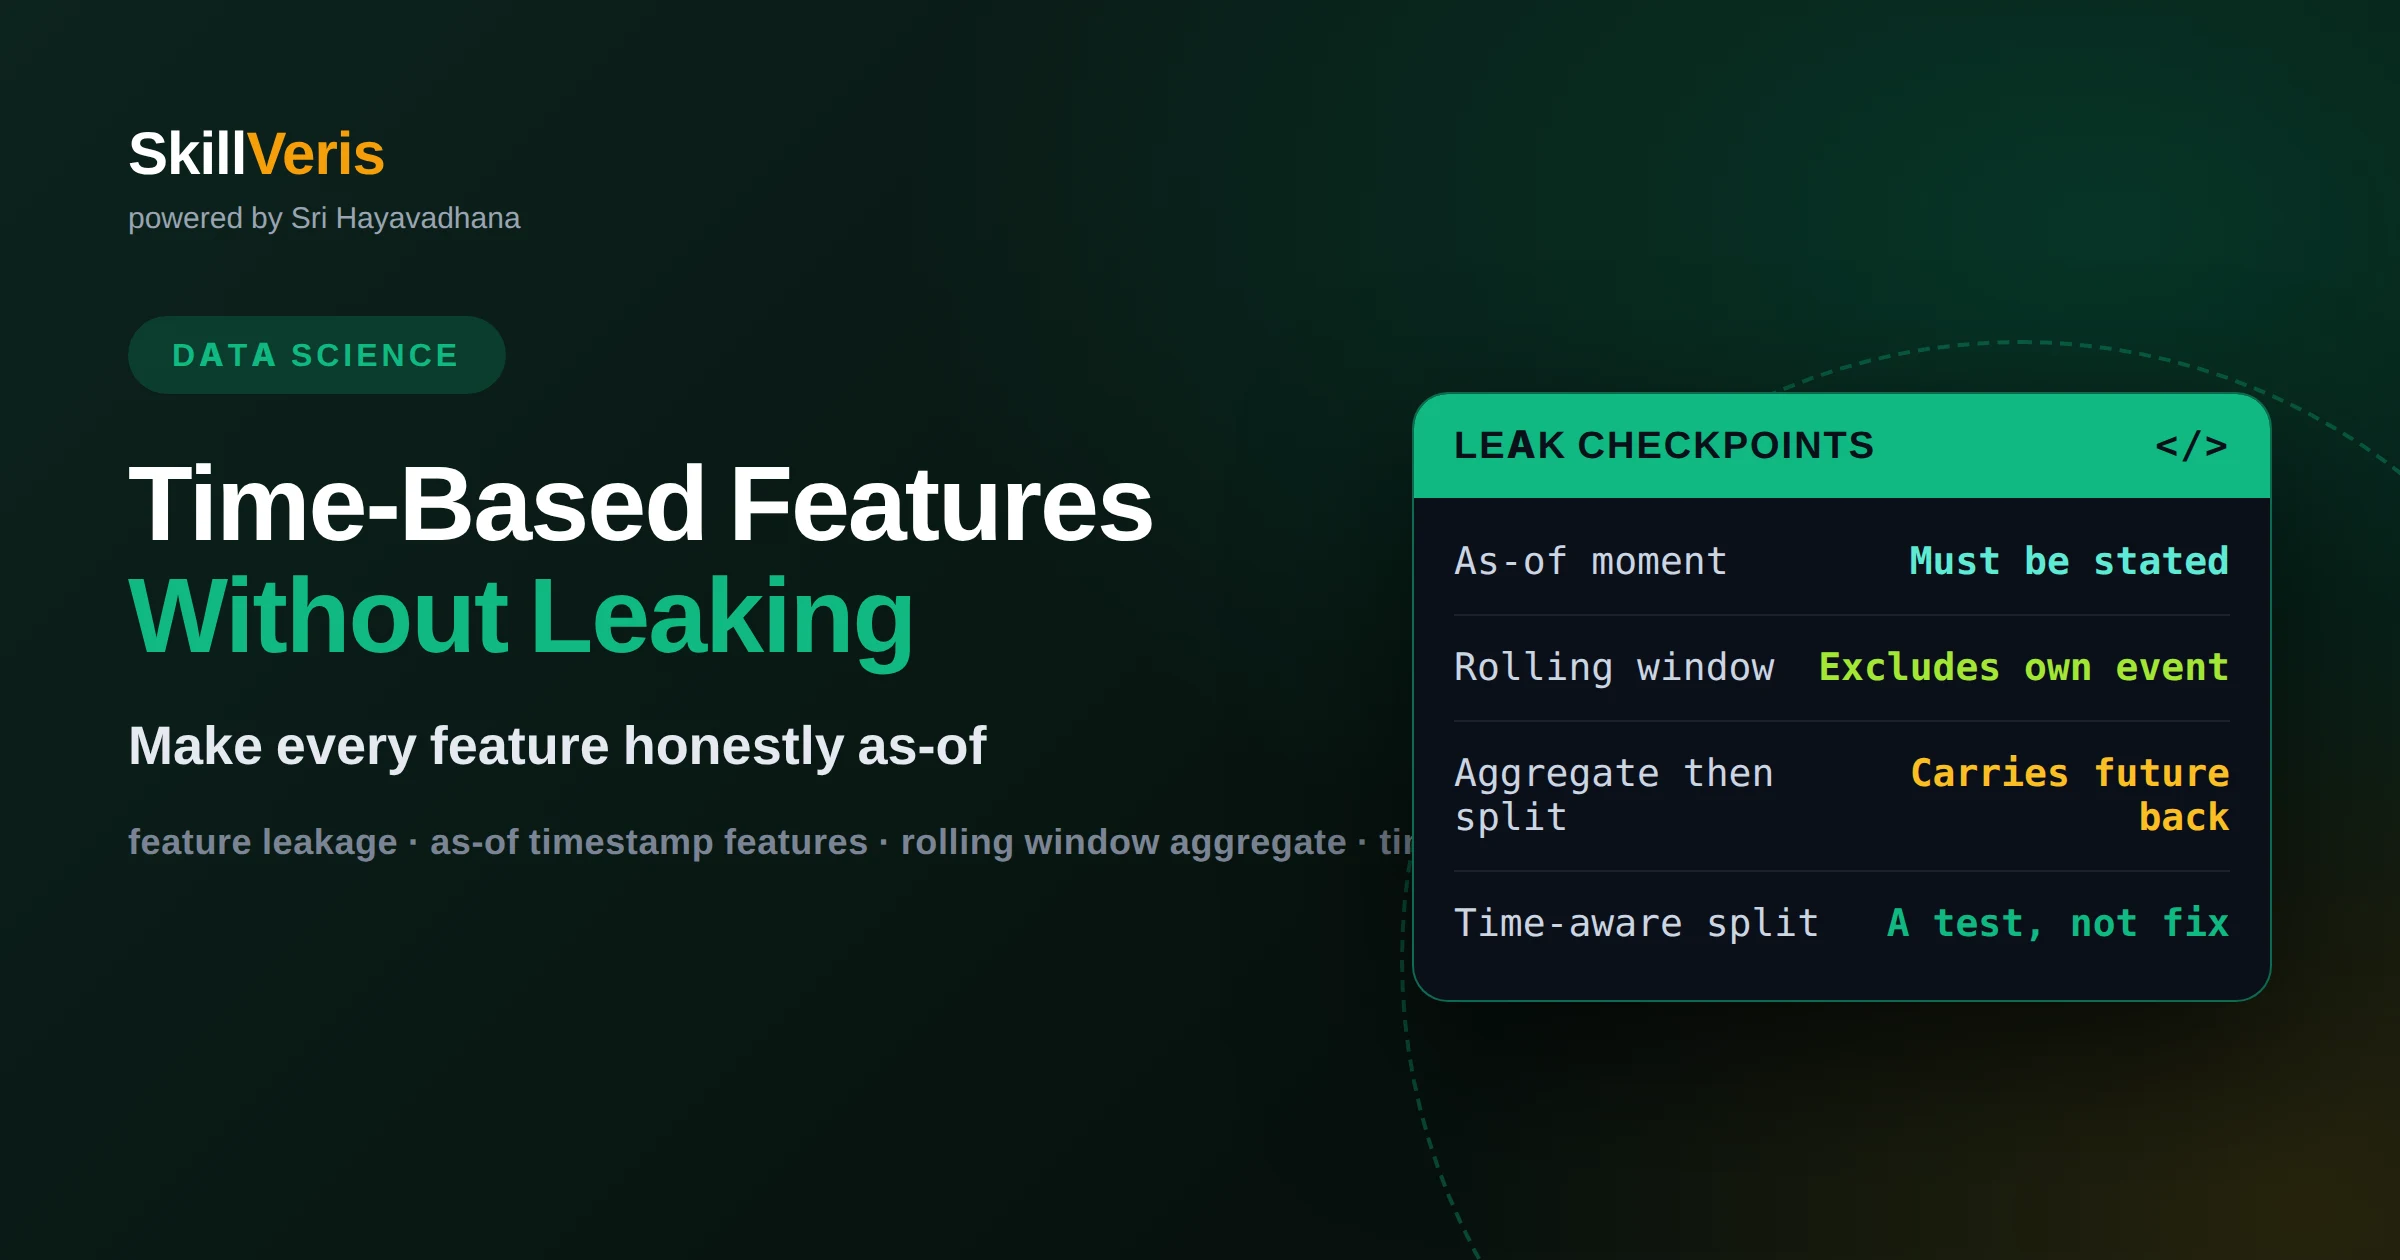
How to build time-based features from a single timestamp without leaking
Every temporal feature needs a stated as-of moment: the instant beyond which no information may be used. Define recency, tenure and rolling aggregates as lookbacks bounded by each row's own reference time, then validate the definition with a time-aware split. This article shows how to write those definitions and how to catch the two leaks that survive review.
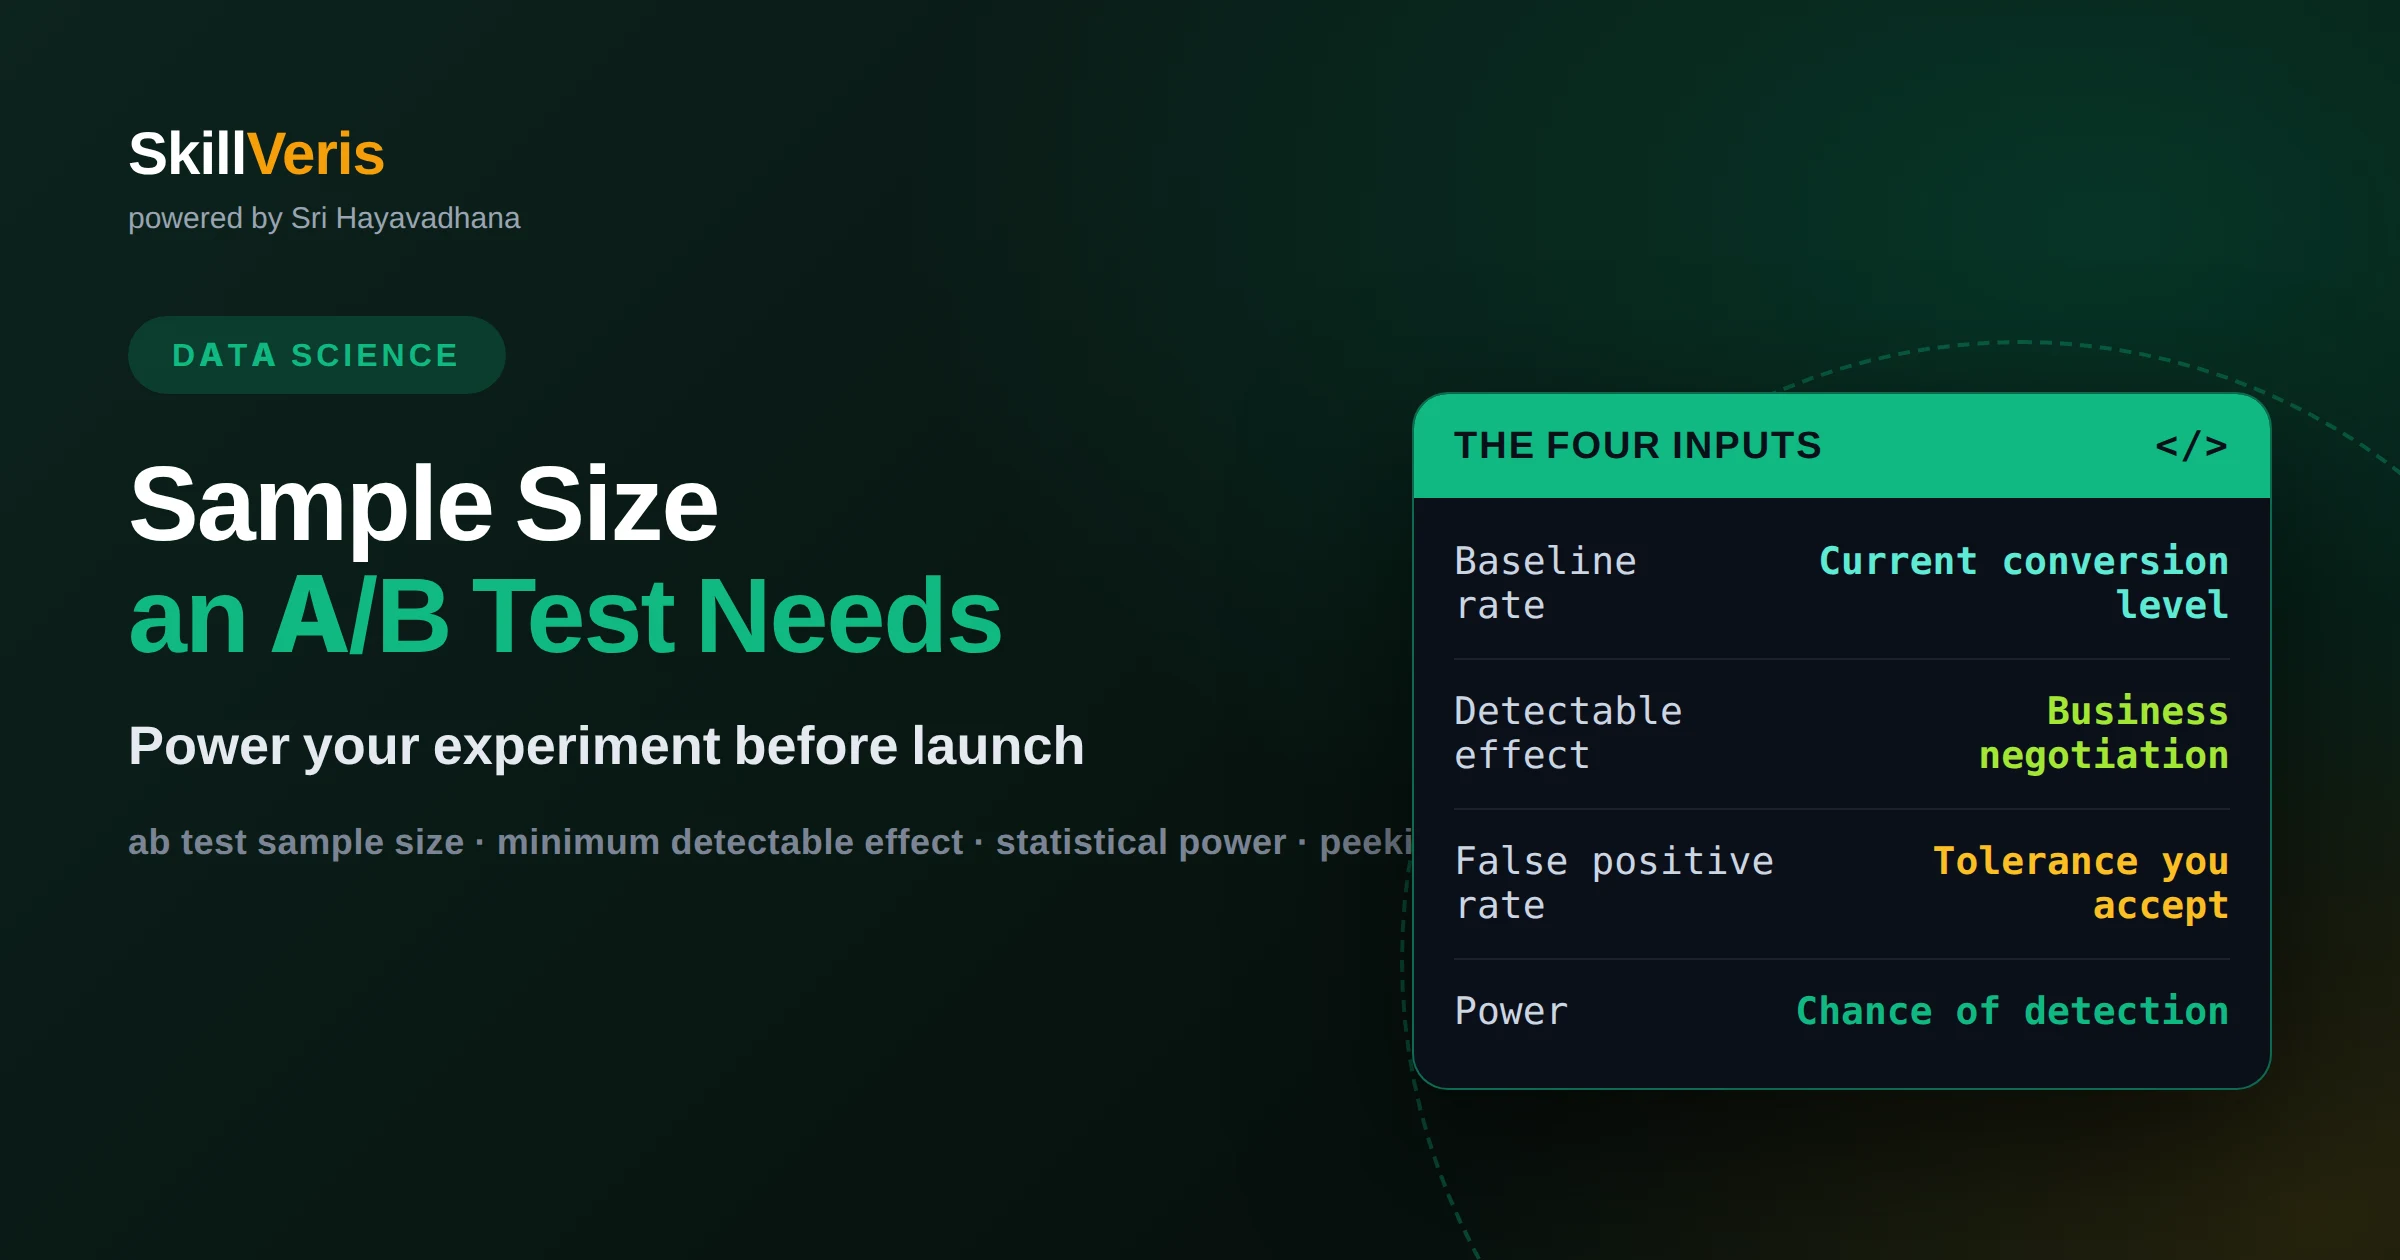
How to calculate the sample size an A/B test actually needs
Four inputs determine sample size: the baseline rate, the smallest effect worth acting on, the tolerated false positive rate and the desired power. The arithmetic is solved; the hard part is negotiating the minimum detectable effect with the people who will act on the result. This article covers both, plus what to do when the test cannot be powered.
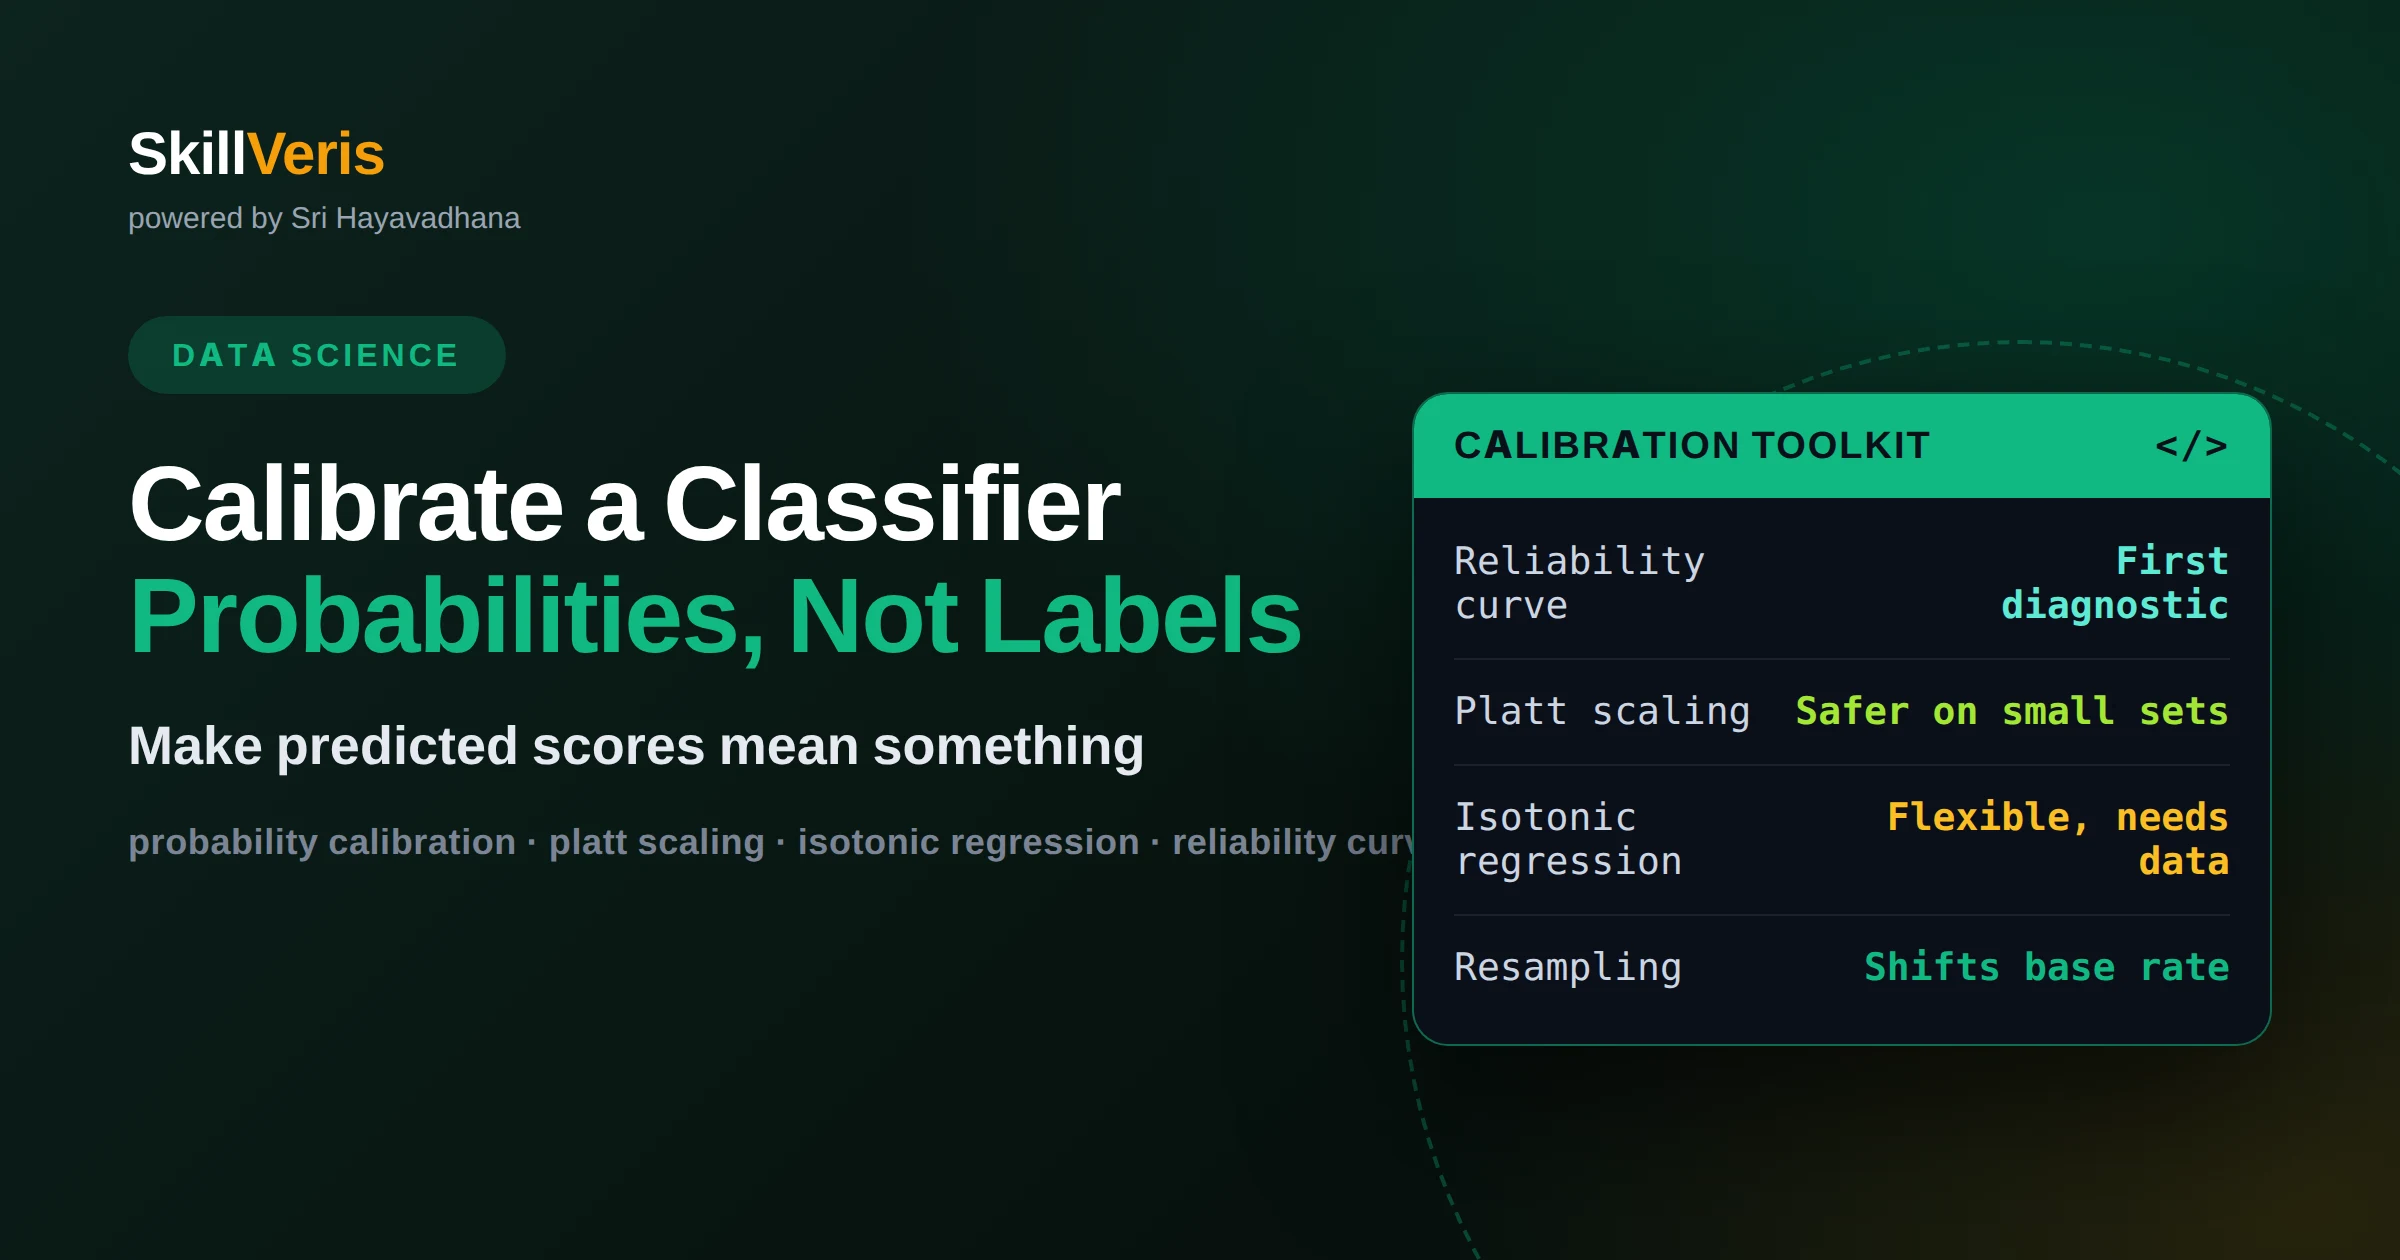
How to calibrate a classifier when you need probabilities, not labels
predict_proba returns a score, not a probability, until you have checked it against outcomes. Read a reliability curve, then fit Platt scaling or isotonic regression on held-out data, choosing between them by how much data you have. Ranking quality and calibration are independent.
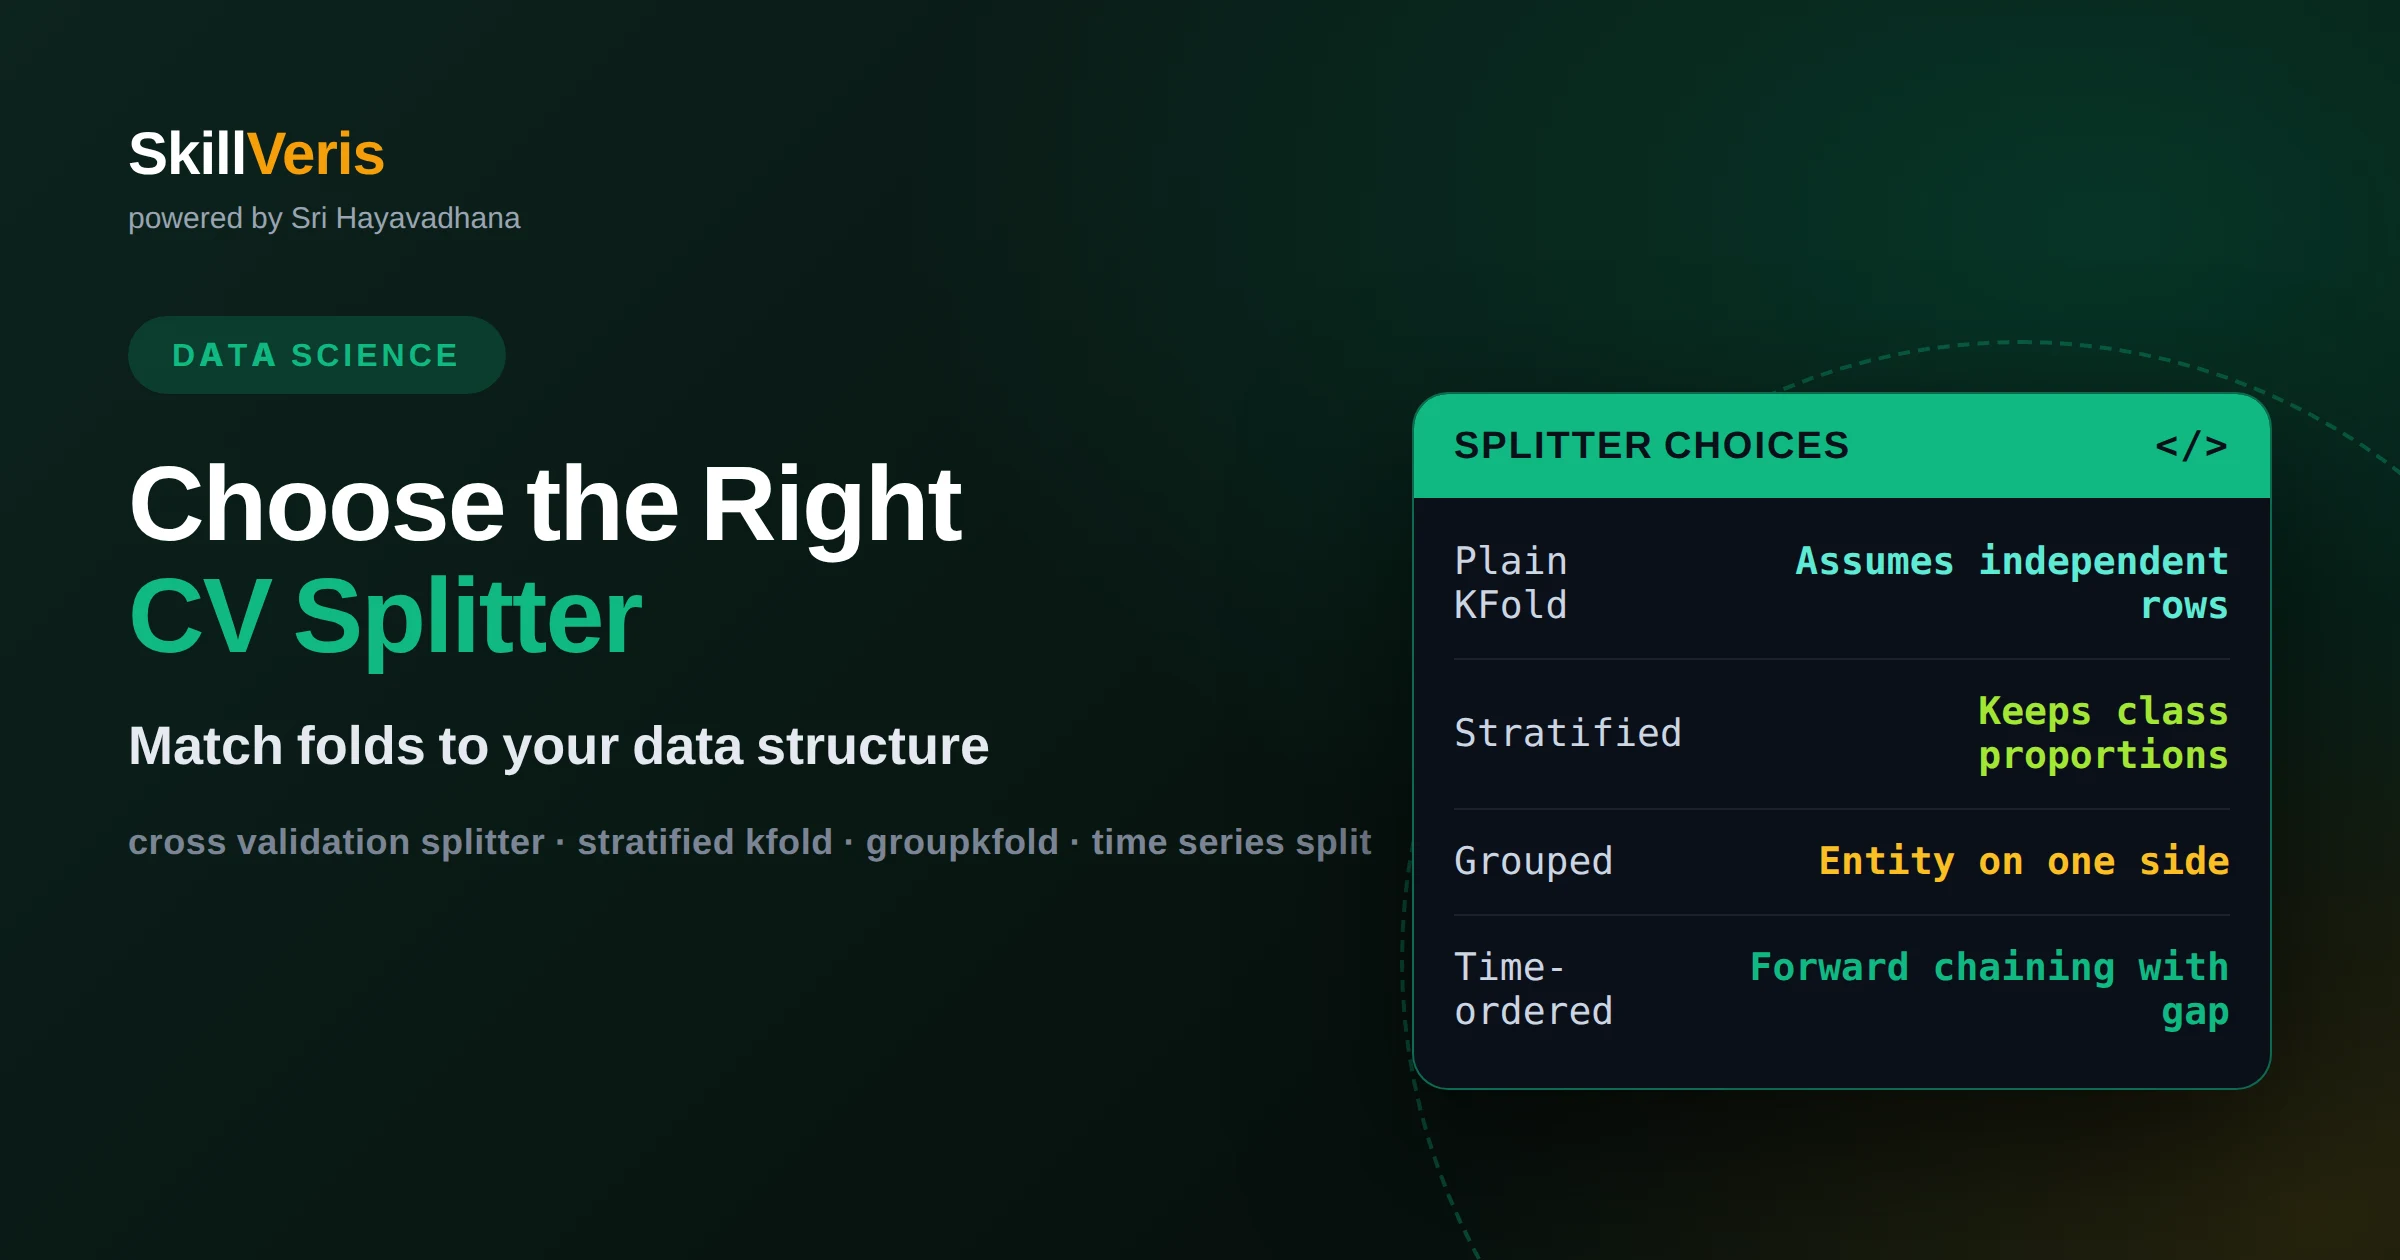
How to choose the right cross-validation splitter for your data
The splitter follows from the structure of your data, not from convention. Stratify when classes are imbalanced, group when rows share an entity, split by time when order carries information, and combine when several apply. A mismatched splitter gives an optimistic score no tuning can fix.
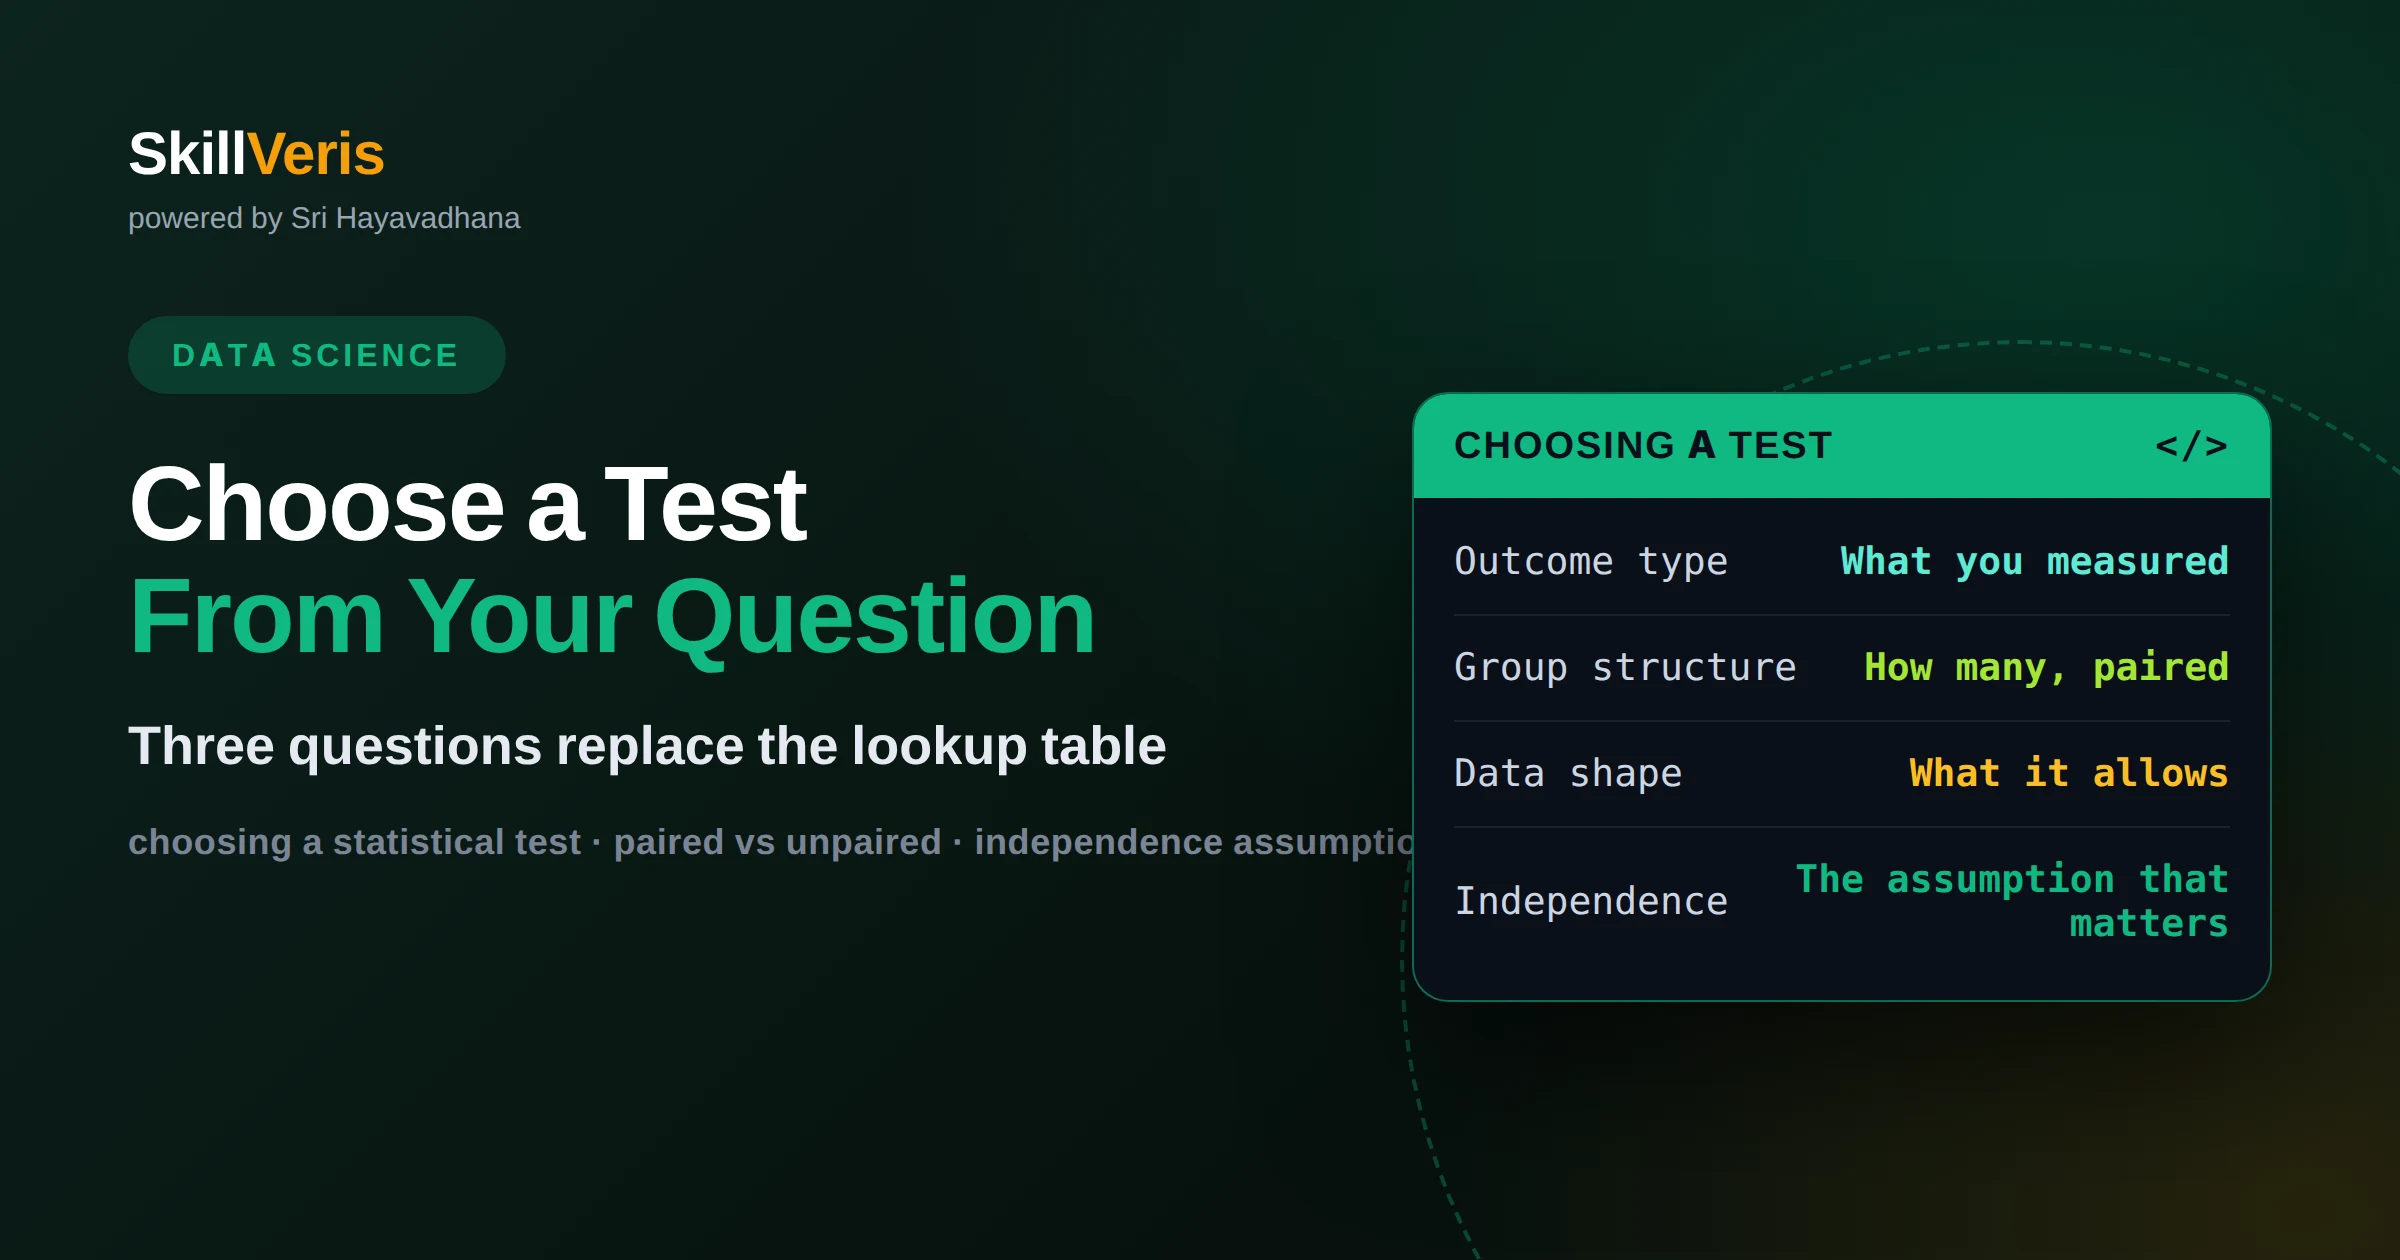
How to choose a statistical test from your question, not a lookup table
Three questions narrow the choice to one or two tests every time: what type is the outcome, how many groups are you comparing and are they paired, and what does the shape of the data allow. Answering them in order is more reliable than memorising a table, and it surfaces the assumption that actually matters — independence.
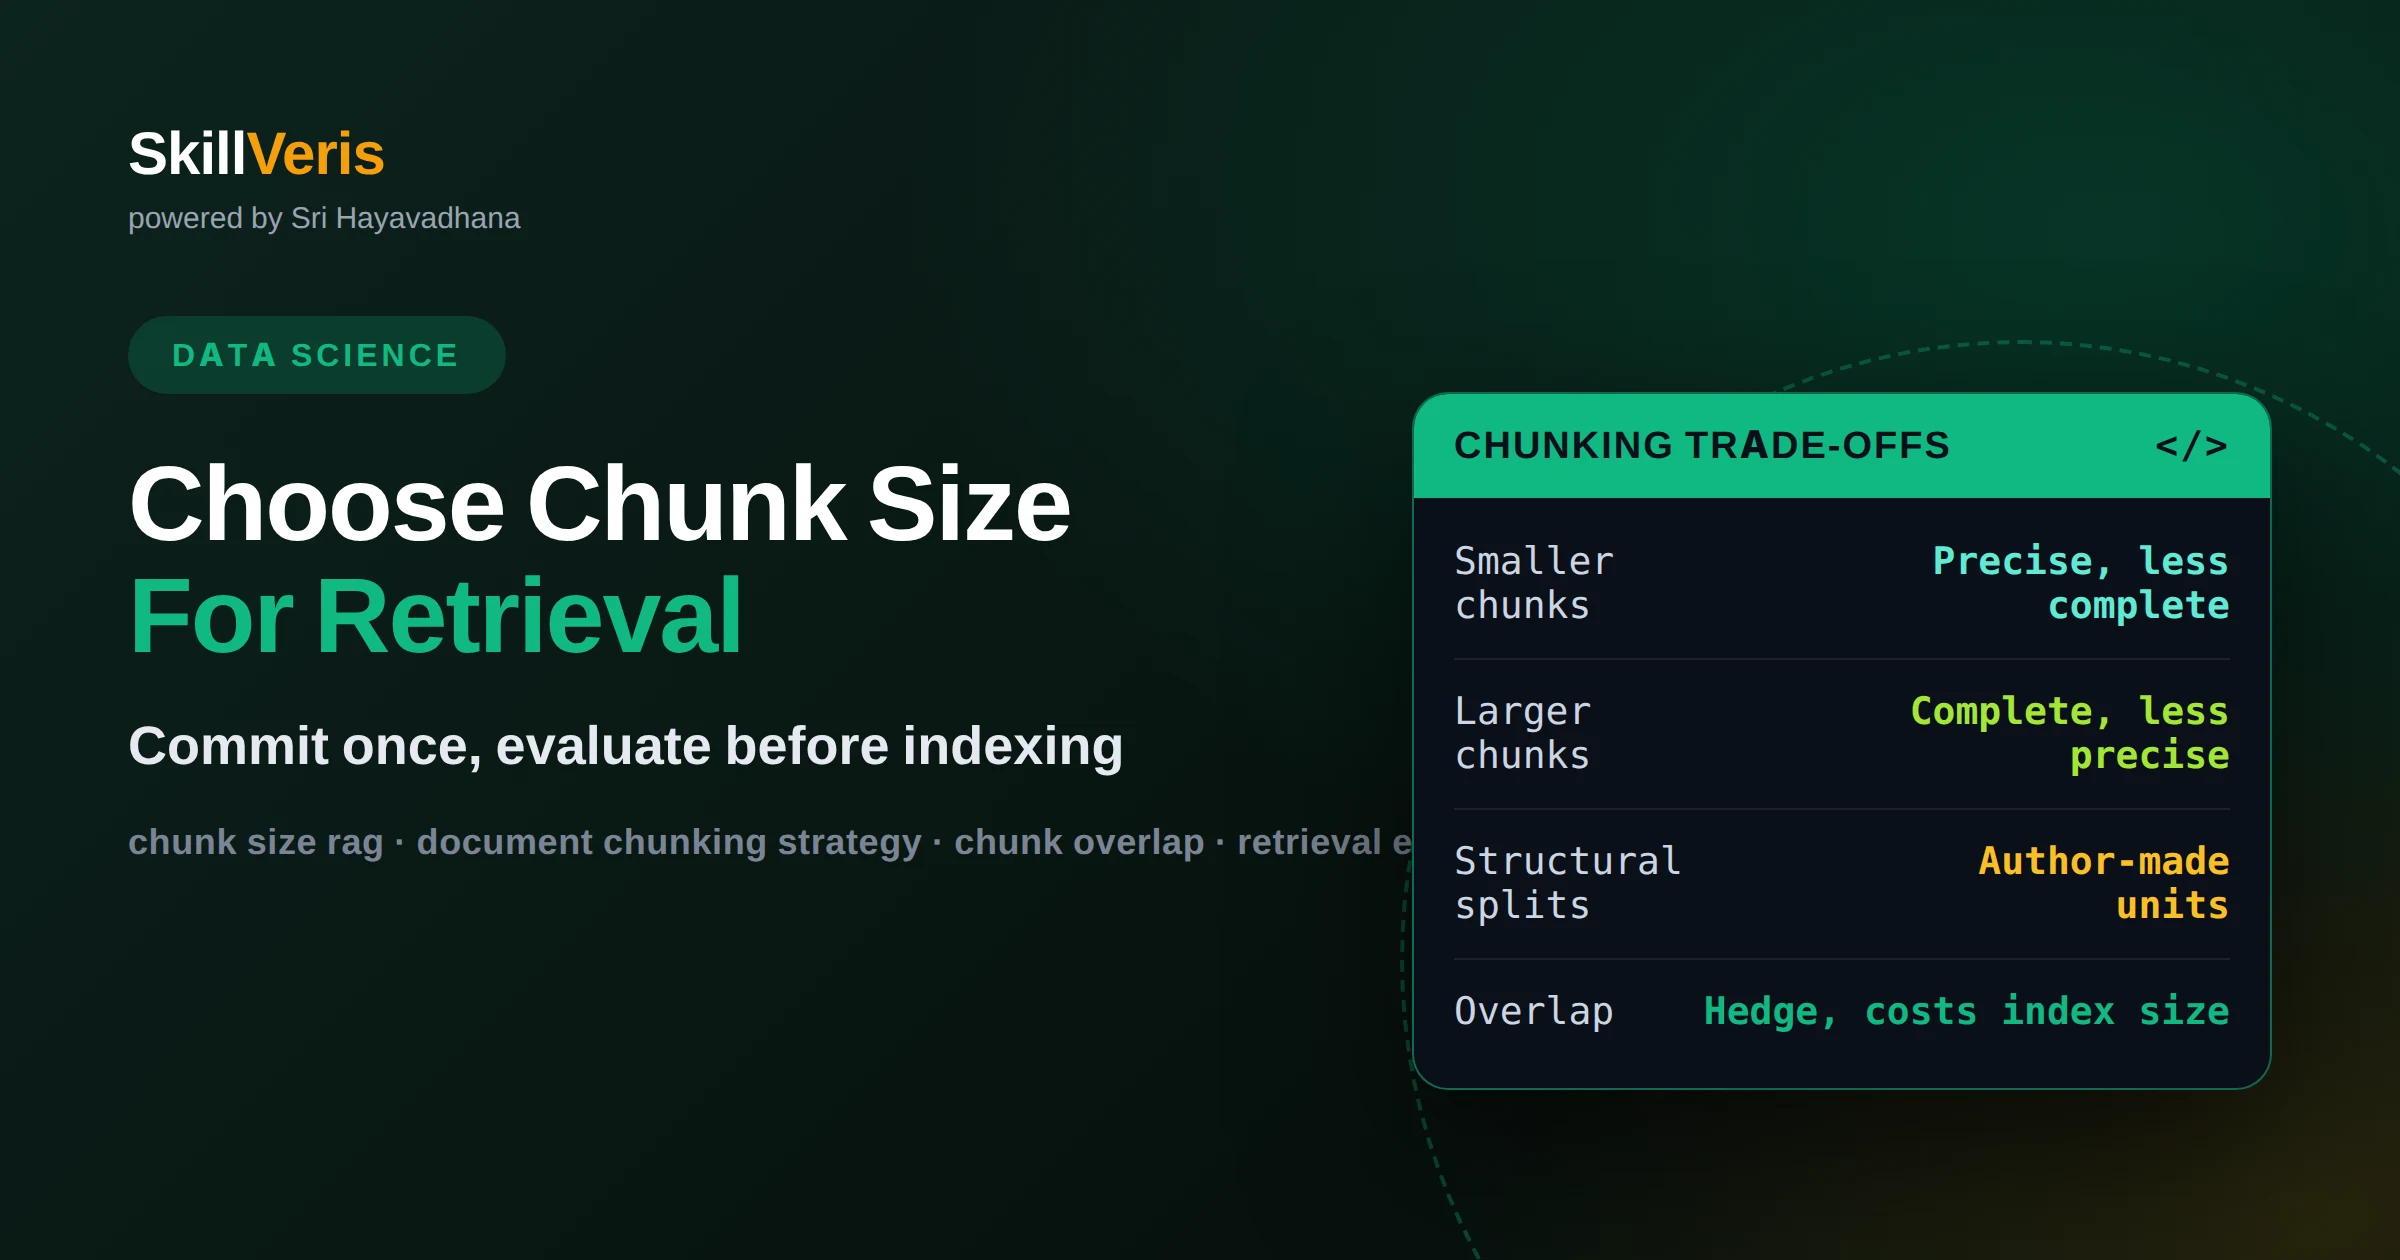
How to choose chunk size for document retrieval, and why it is hard to change later
Chunk size is a commitment made at index time that trades retrieval precision against answer completeness. The right unit is the document's own structure — sections, clauses, conversational turns — rather than a fixed character count. This article covers overlap as a hedge, why re-chunking forces a full re-index, and how to evaluate a choice before committing the corpus.
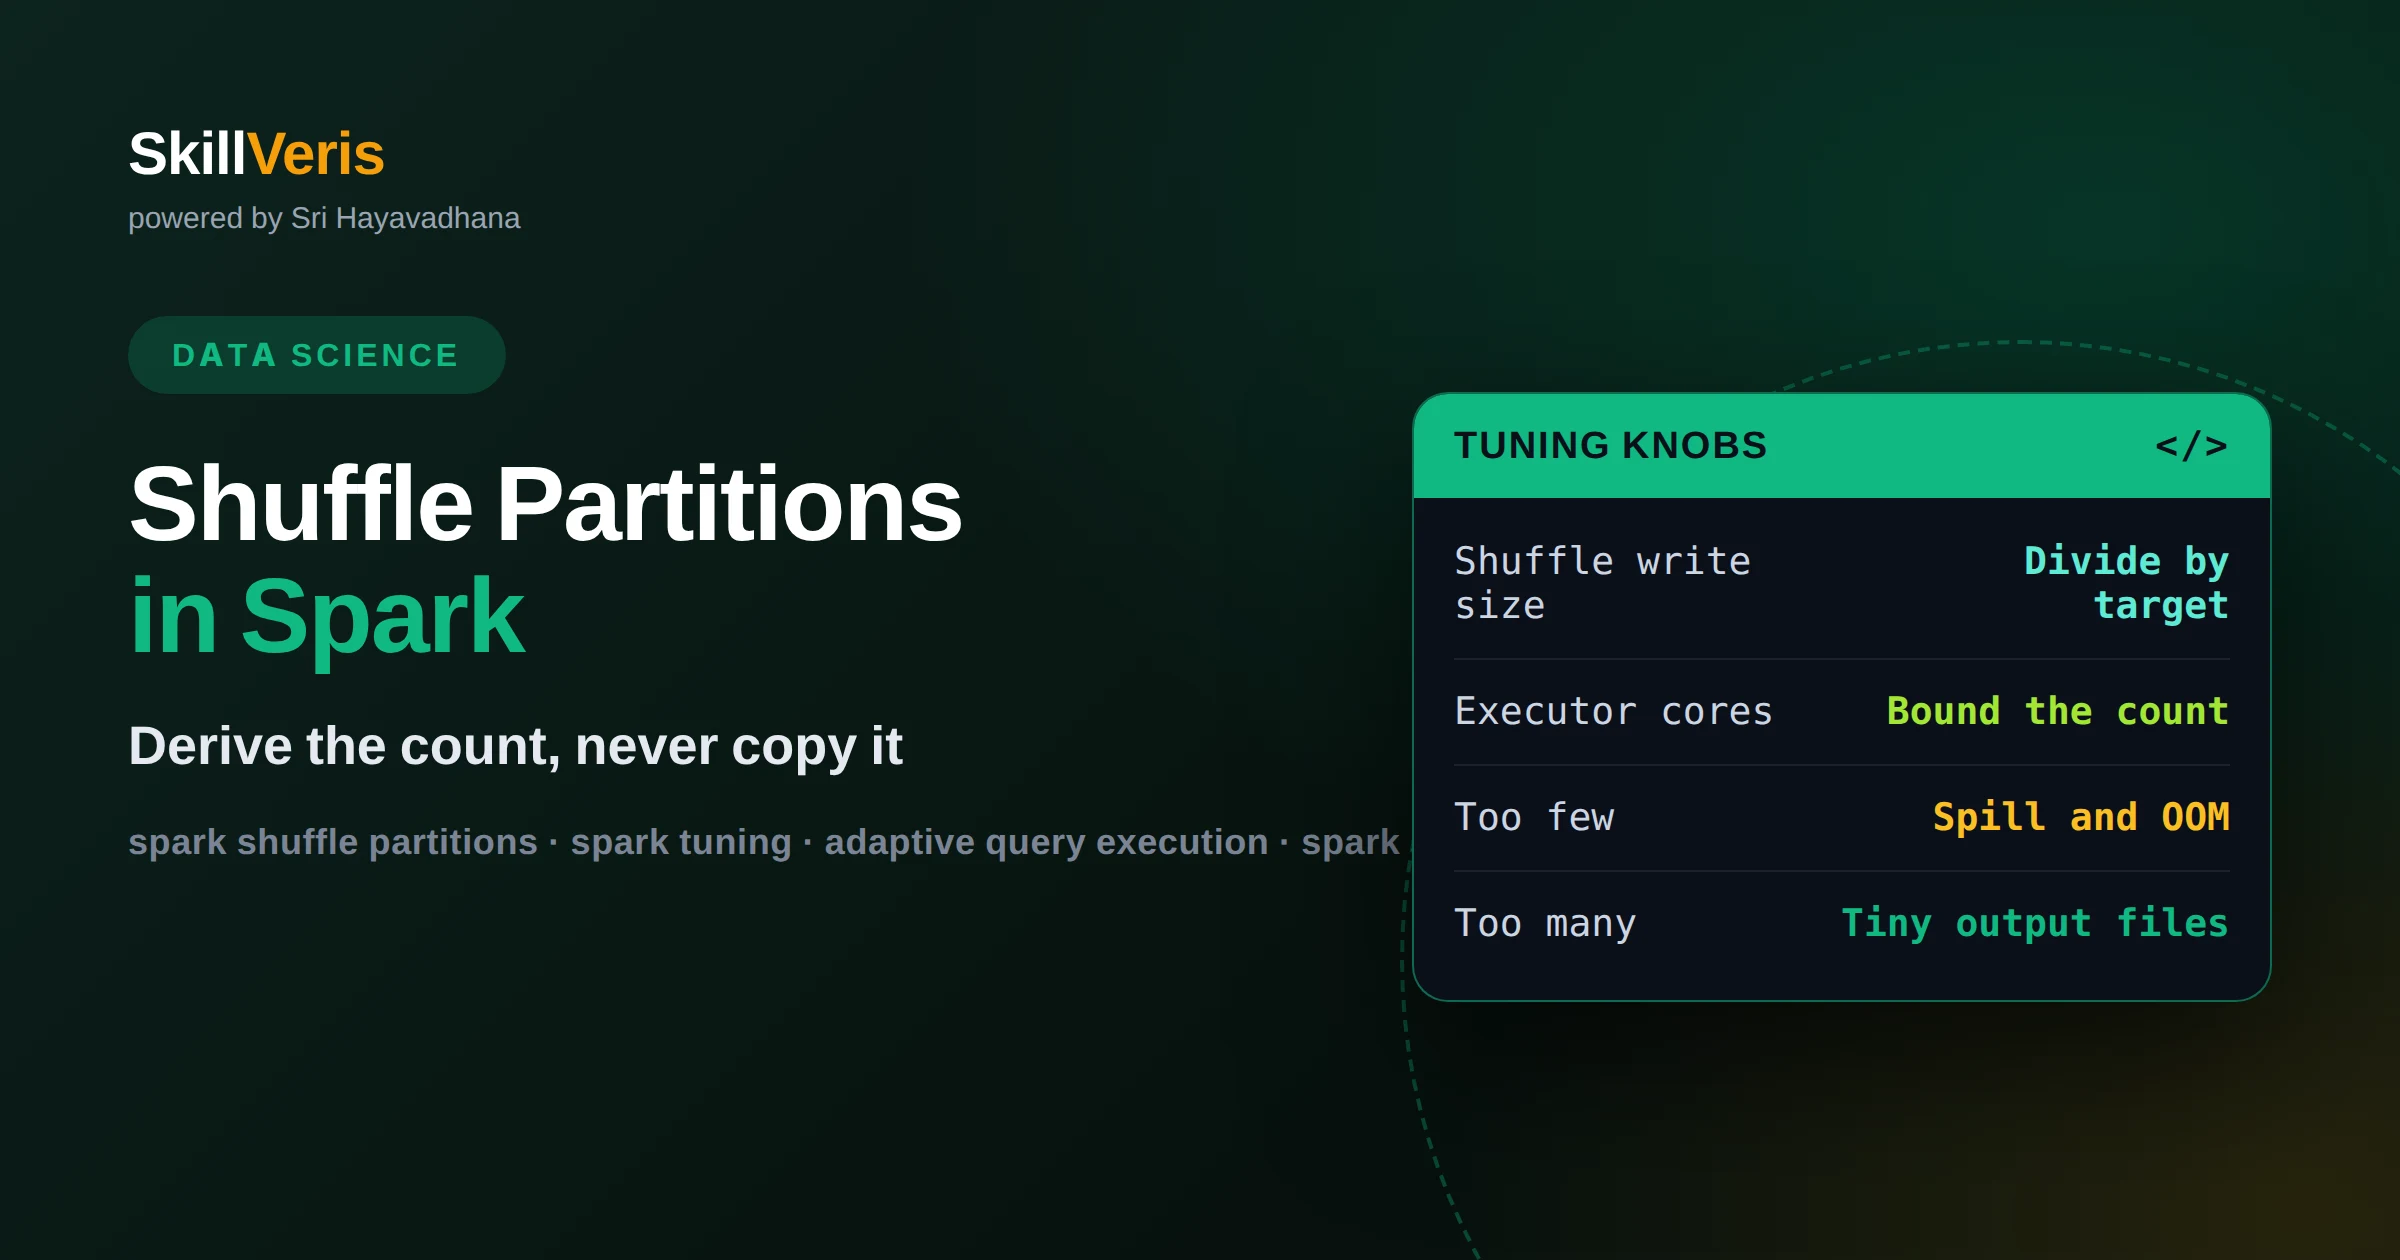
How to choose the right number of shuffle partitions in Spark
Derive the shuffle partition count rather than copying a default. Divide the stage's shuffle write size by a target partition size, then bound the result by the cores available. Too few partitions cause spill and out-of-memory failures; too many create scheduler overhead and tiny output files.
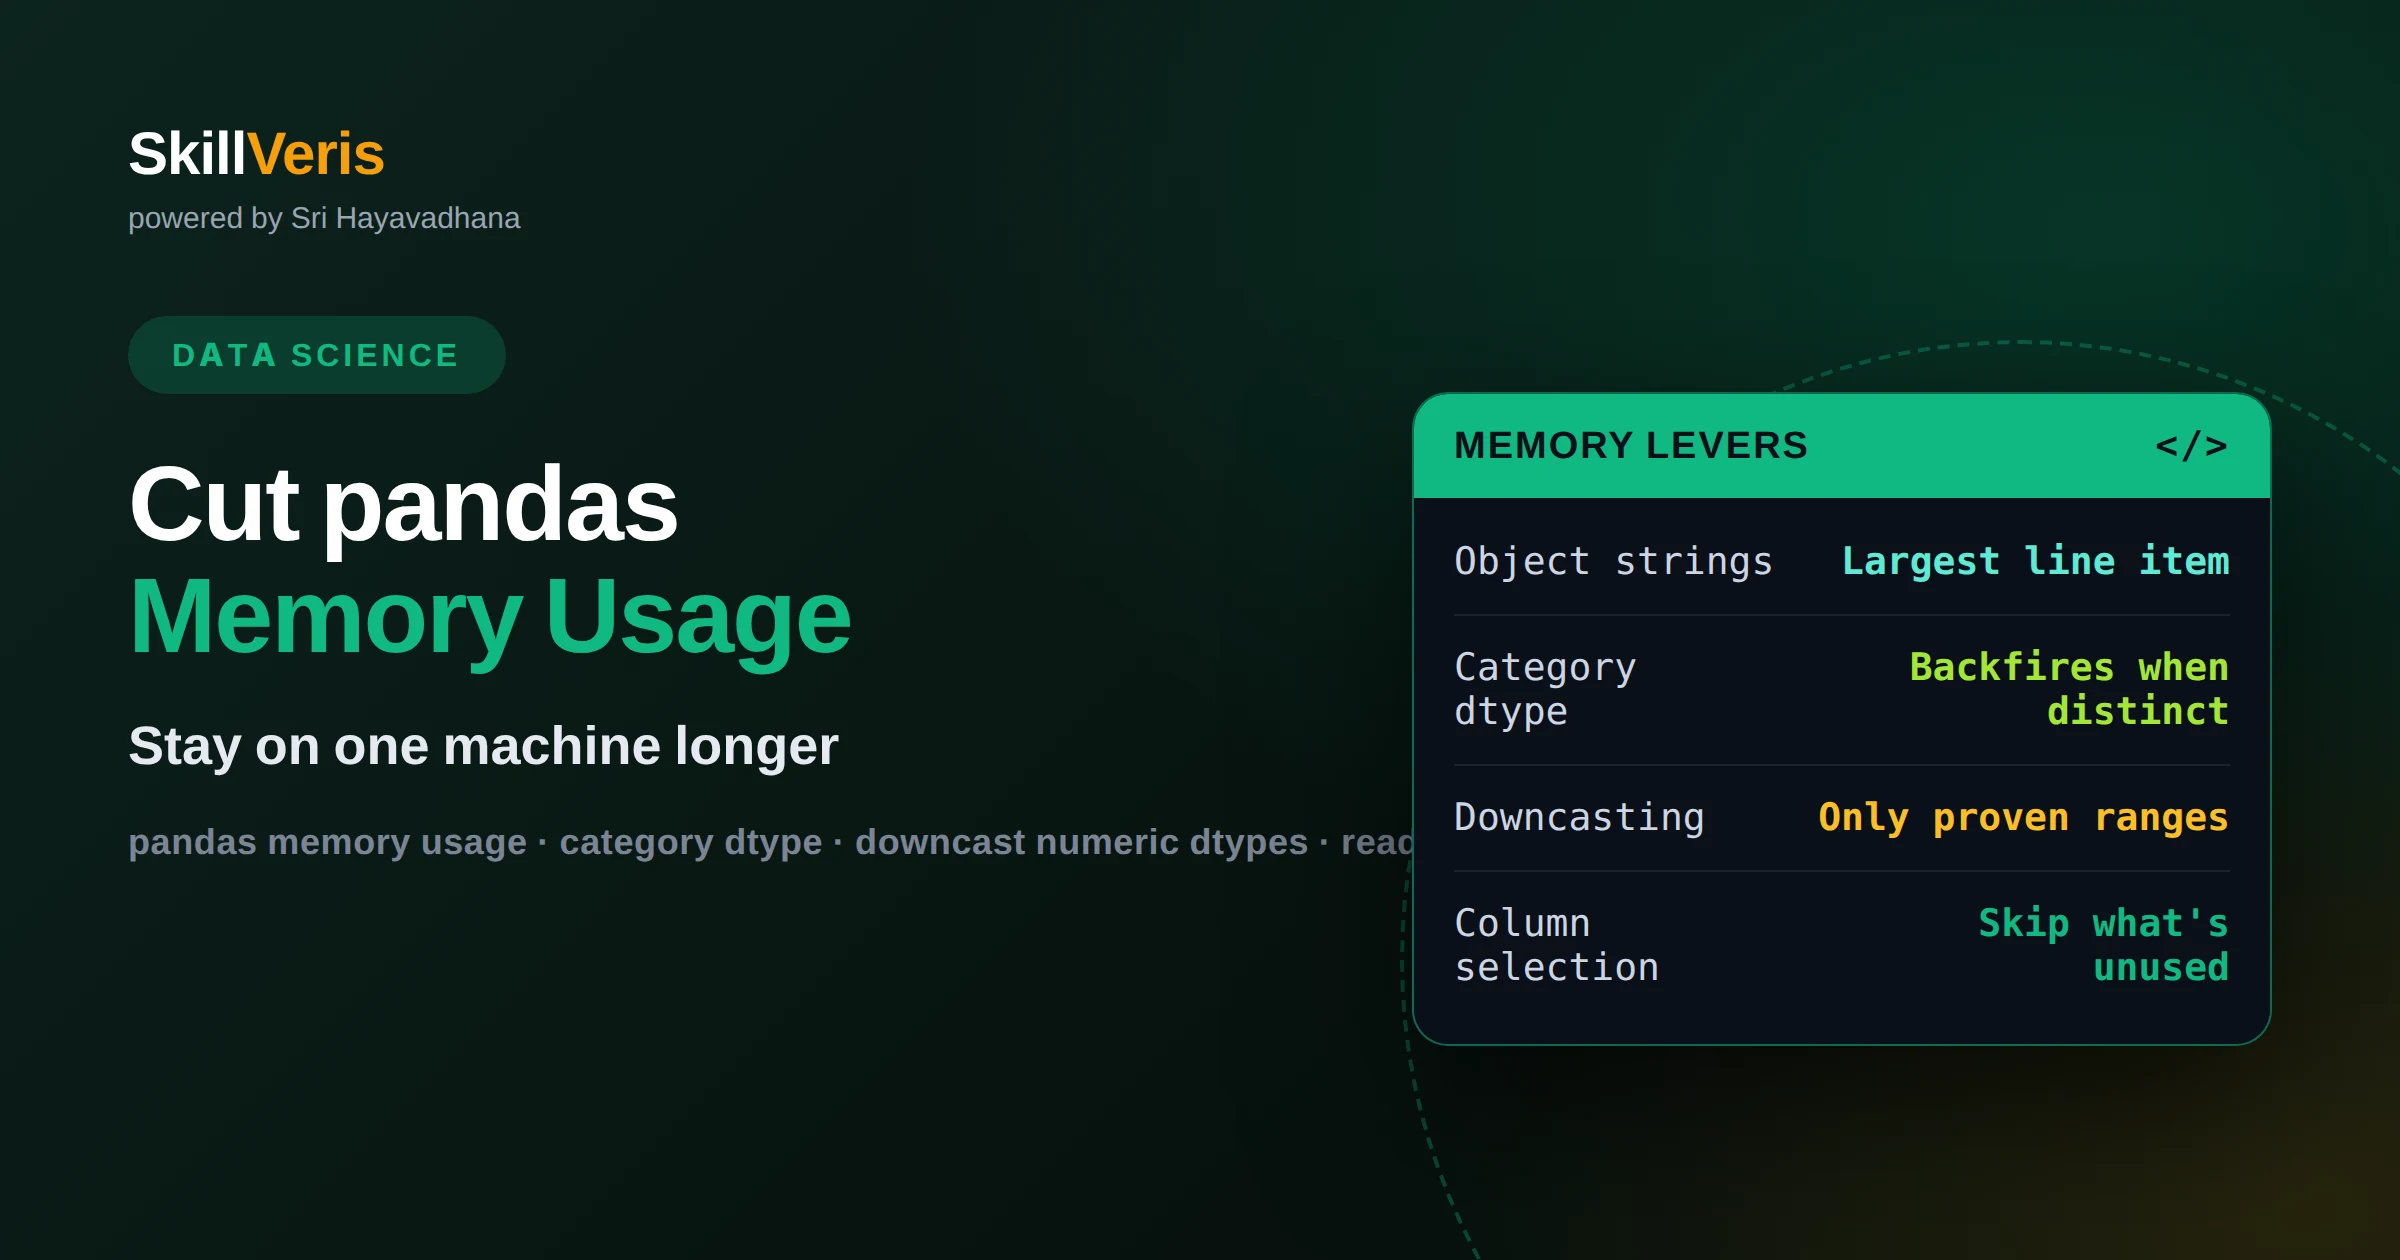
How to cut a pandas DataFrame's memory use before you reach for Spark
Most oversized DataFrames are oversized for three fixable reasons: strings stored as Python objects, 64-bit numerics that never needed the range, and columns you loaded but never used. Declaring dtypes at read time, converting low-cardinality text to category and selecting columns usually recovers enough room to stay on one machine.
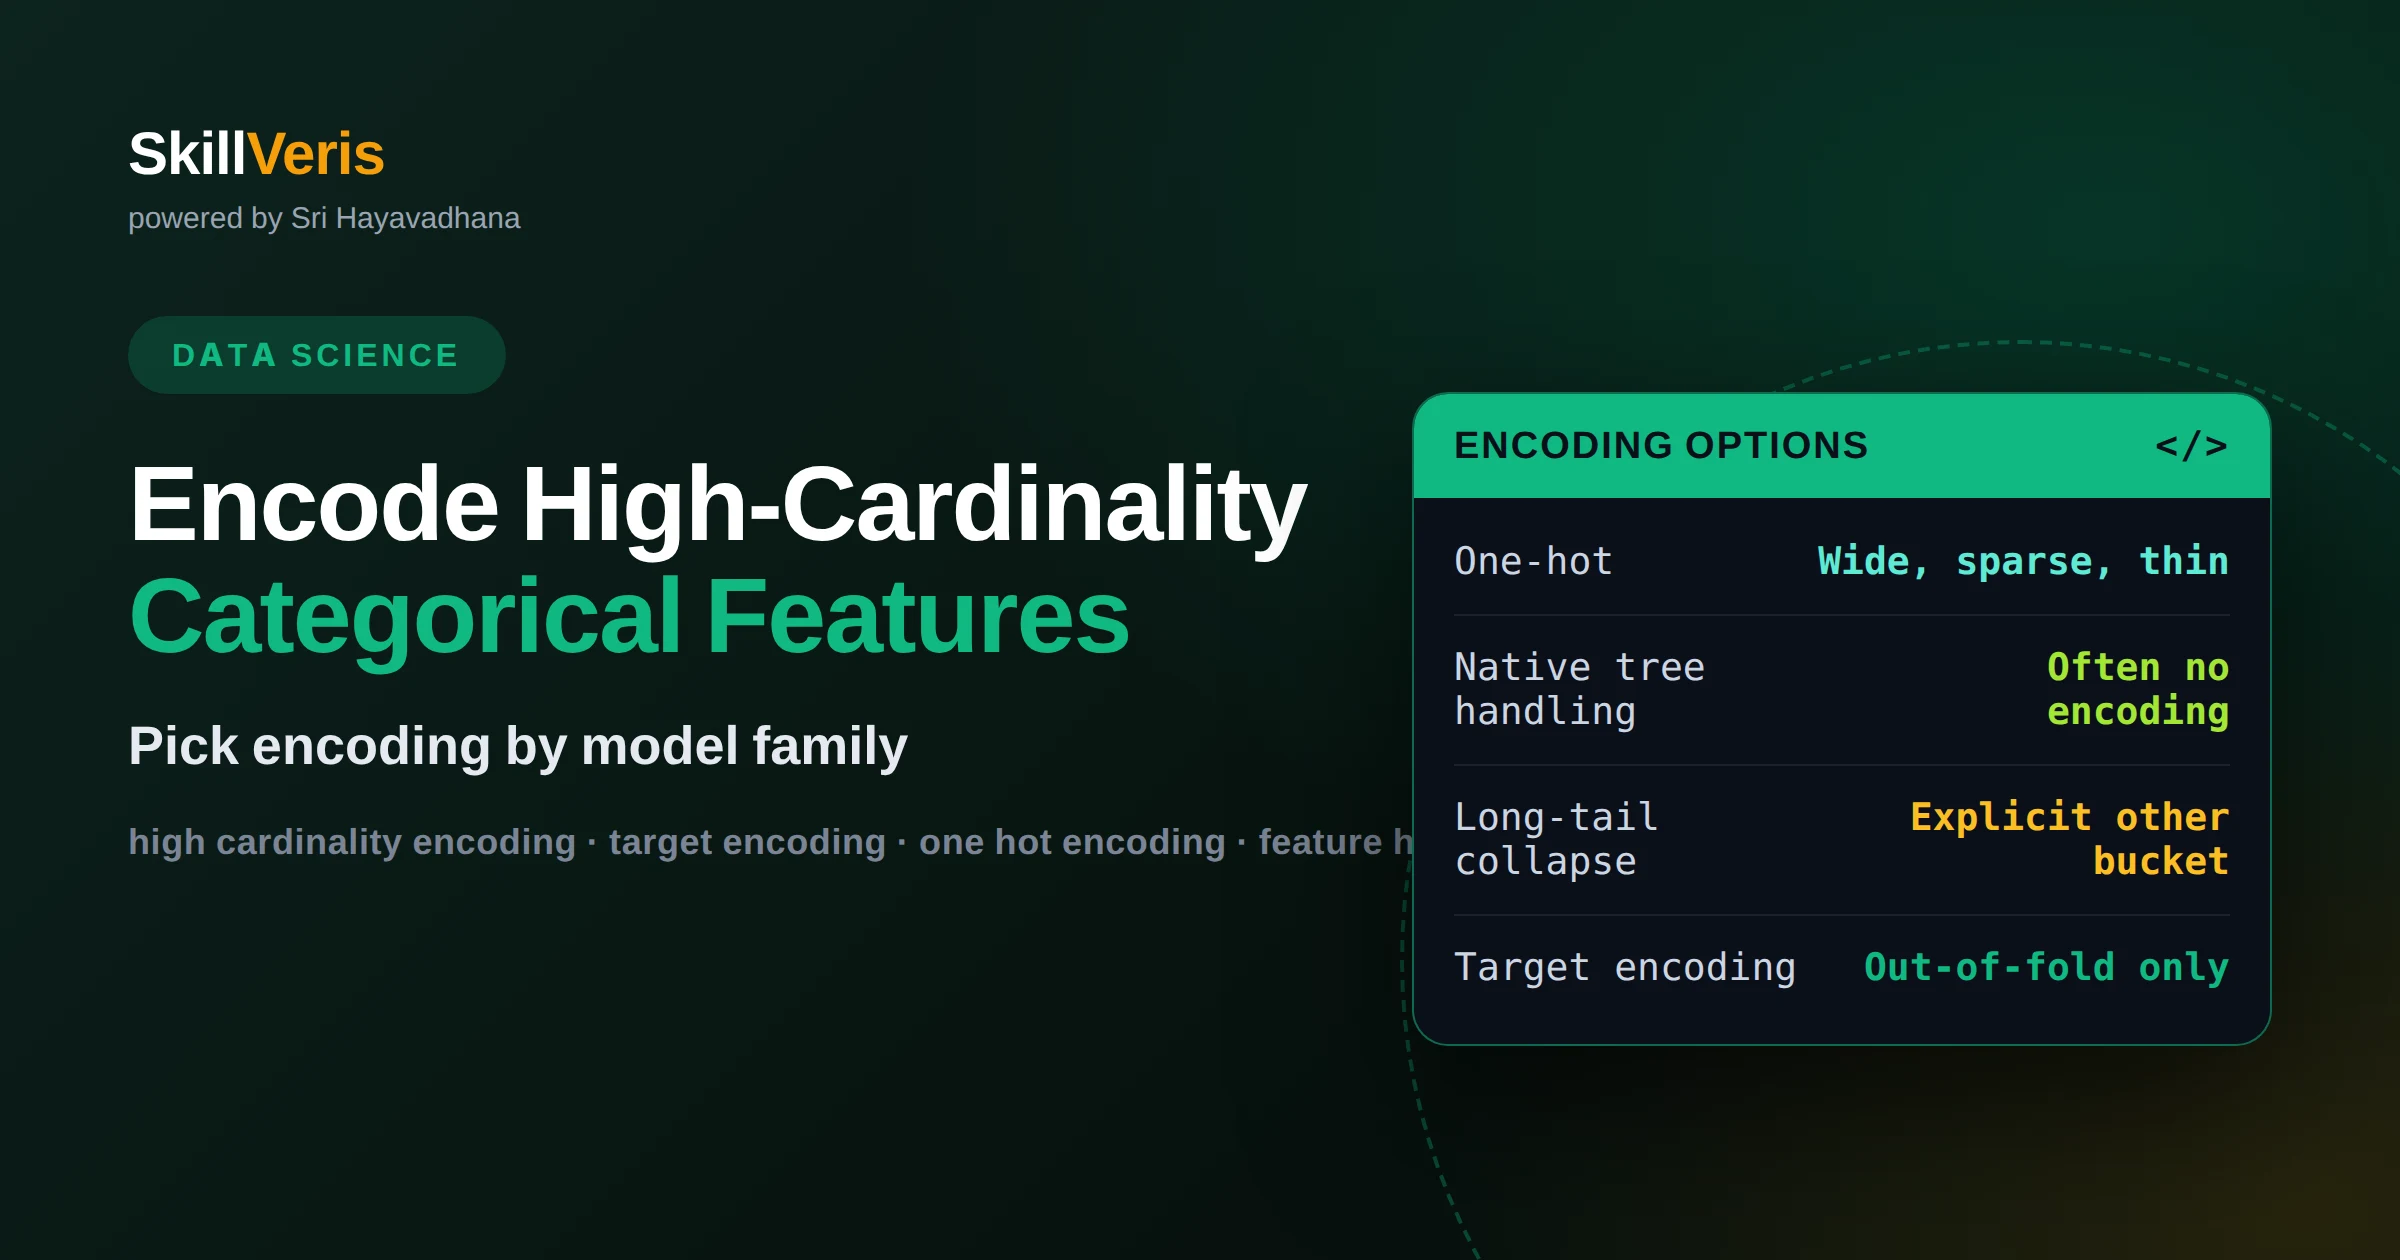
How to encode high-cardinality categorical features without blowing up the model
Two axes decide the encoding: how many distinct values the column has, and which model family consumes it. Gradient-boosted trees often need no encoding at all, linear models need one-hot on a reduced vocabulary, and target encoding is safe only when computed out of fold.
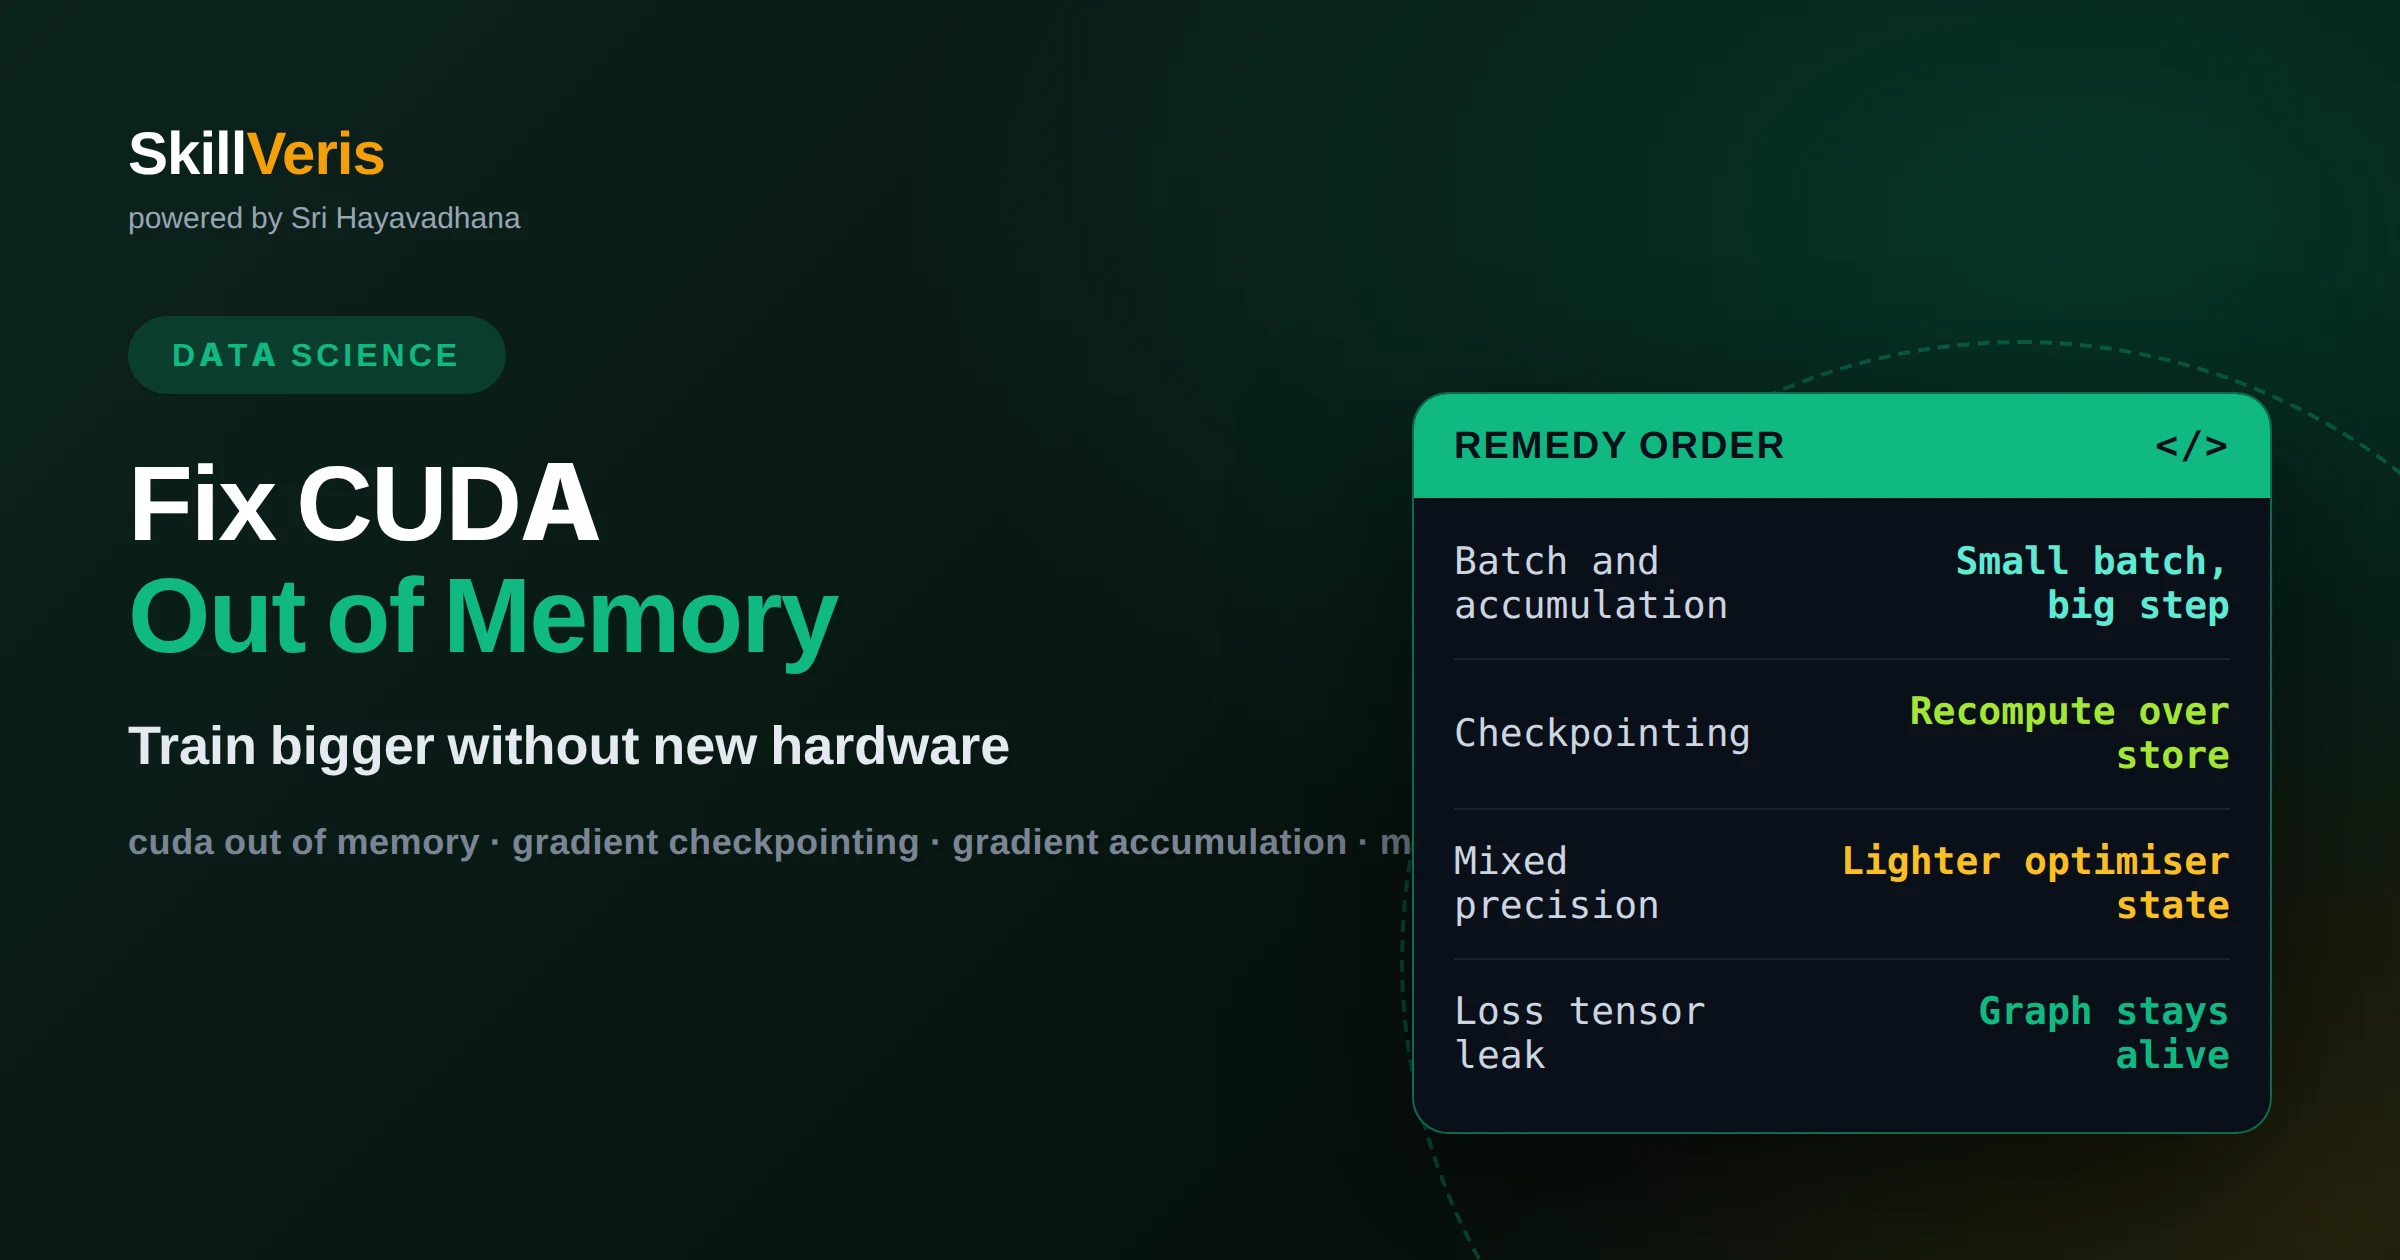
How to fix CUDA out of memory in PyTorch without buying a bigger GPU
GPU memory splits into parameters, gradients, optimiser state and activations, and only the activation term responds to batch size. Measure the breakdown first, then apply remedies in that order: batch size and accumulation, gradient checkpointing, mixed precision, then a leaner optimiser.
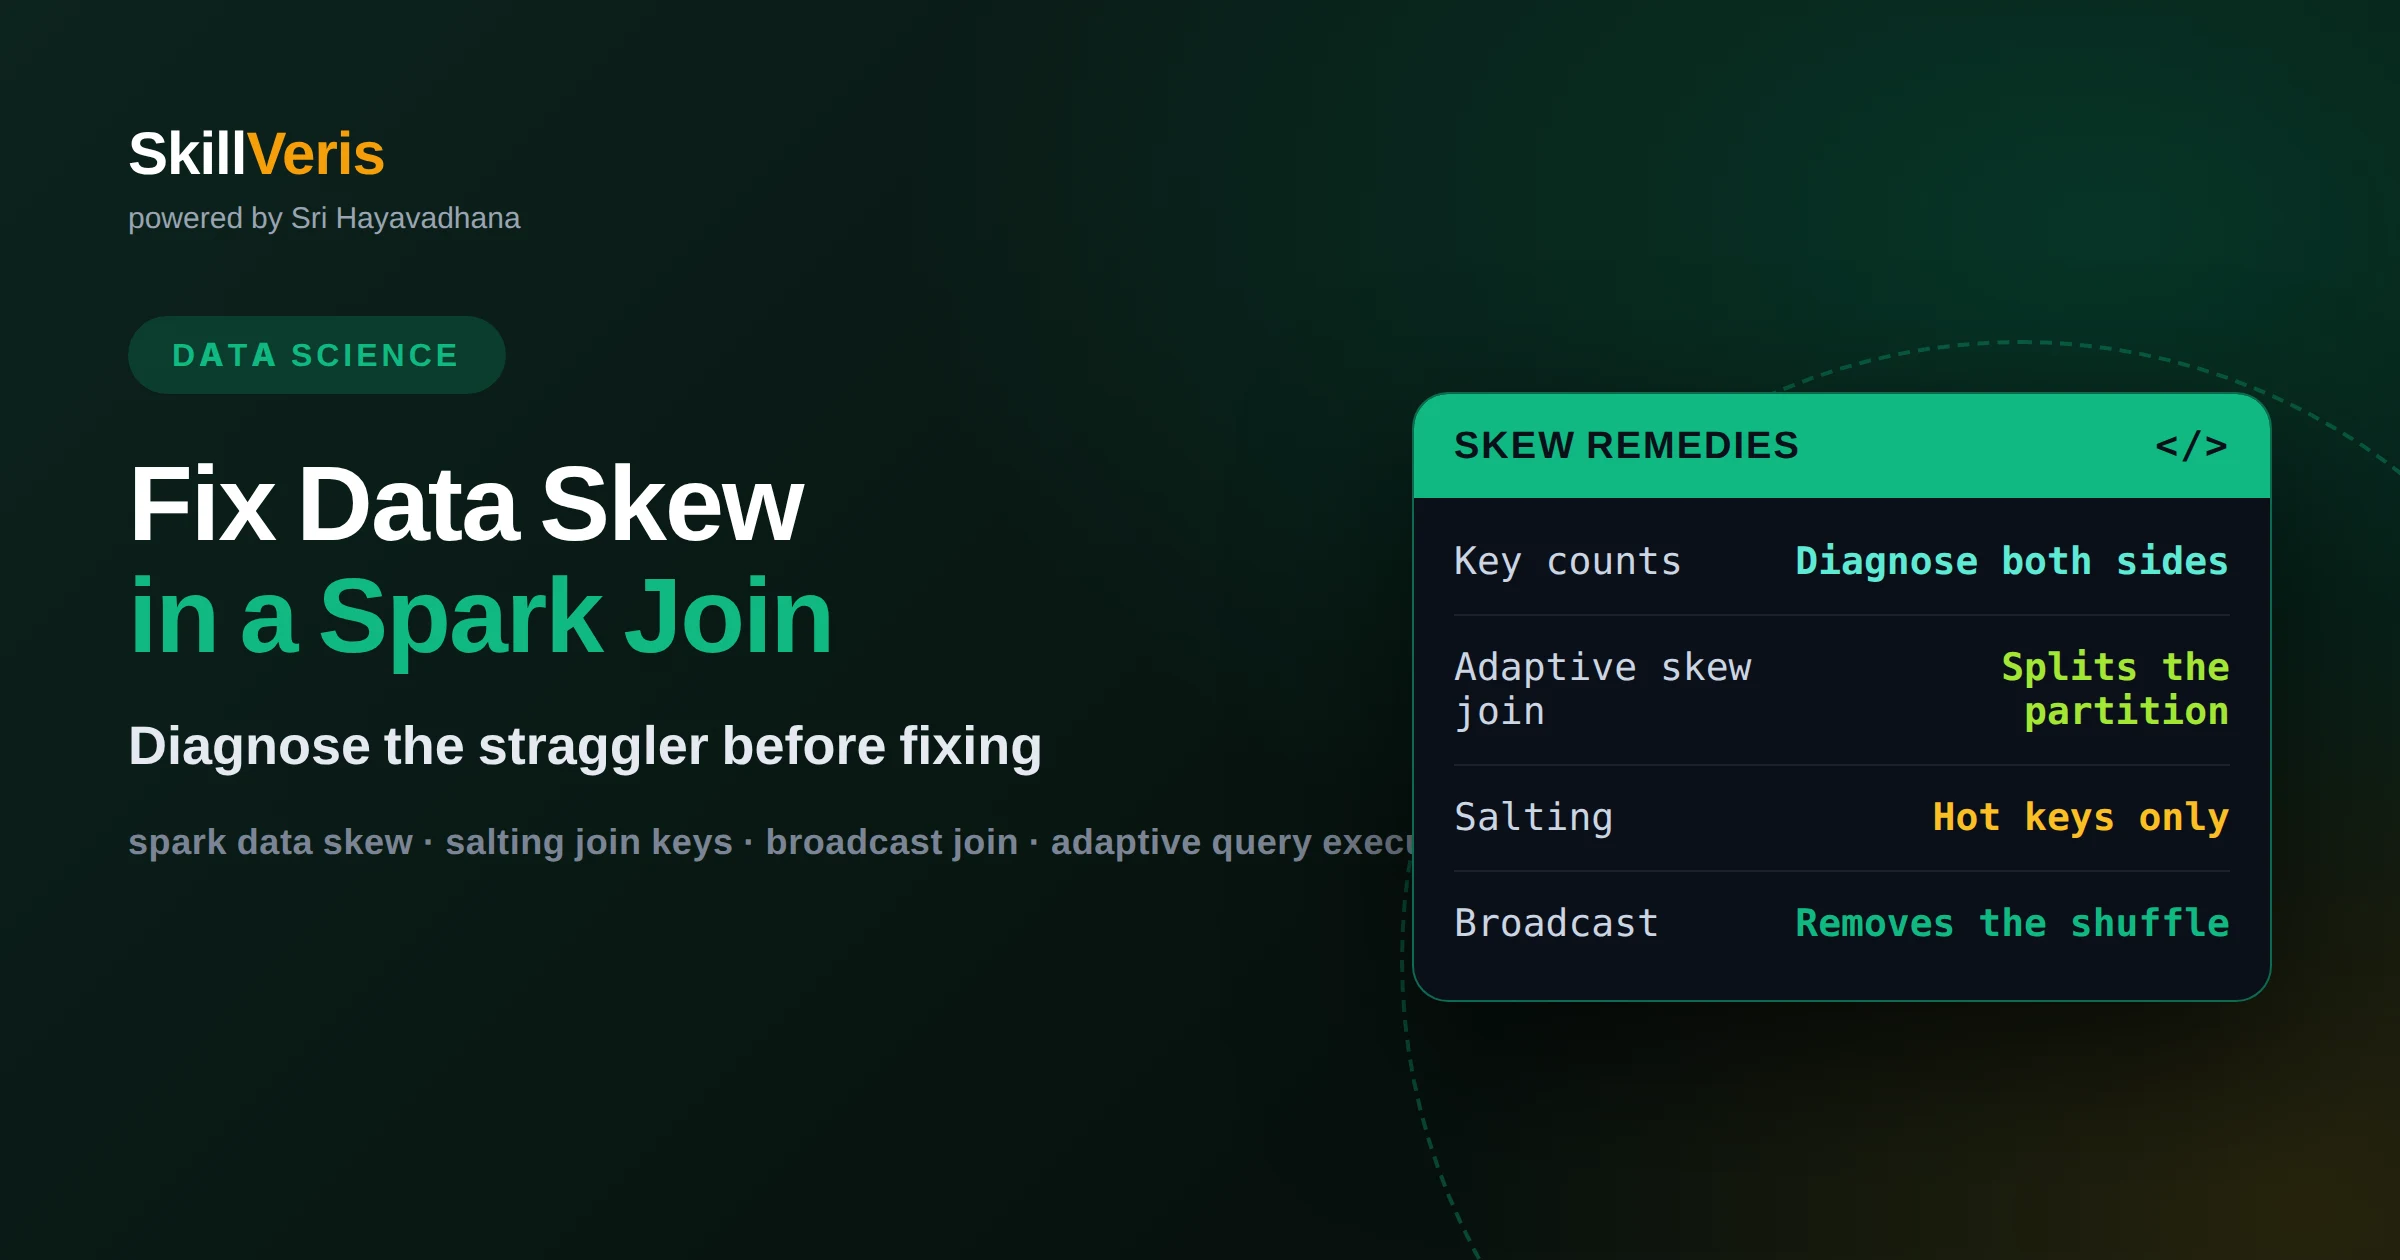
How to fix data skew in a Spark join without guessing
Diagnose skew before you fix it. Count rows per join key, confirm the straggler in the stage's task-duration distribution, then pick exactly one remedy — adaptive skew join, salting the hot key, or broadcasting the small side — based on whether you have a few hot keys or a long tail.
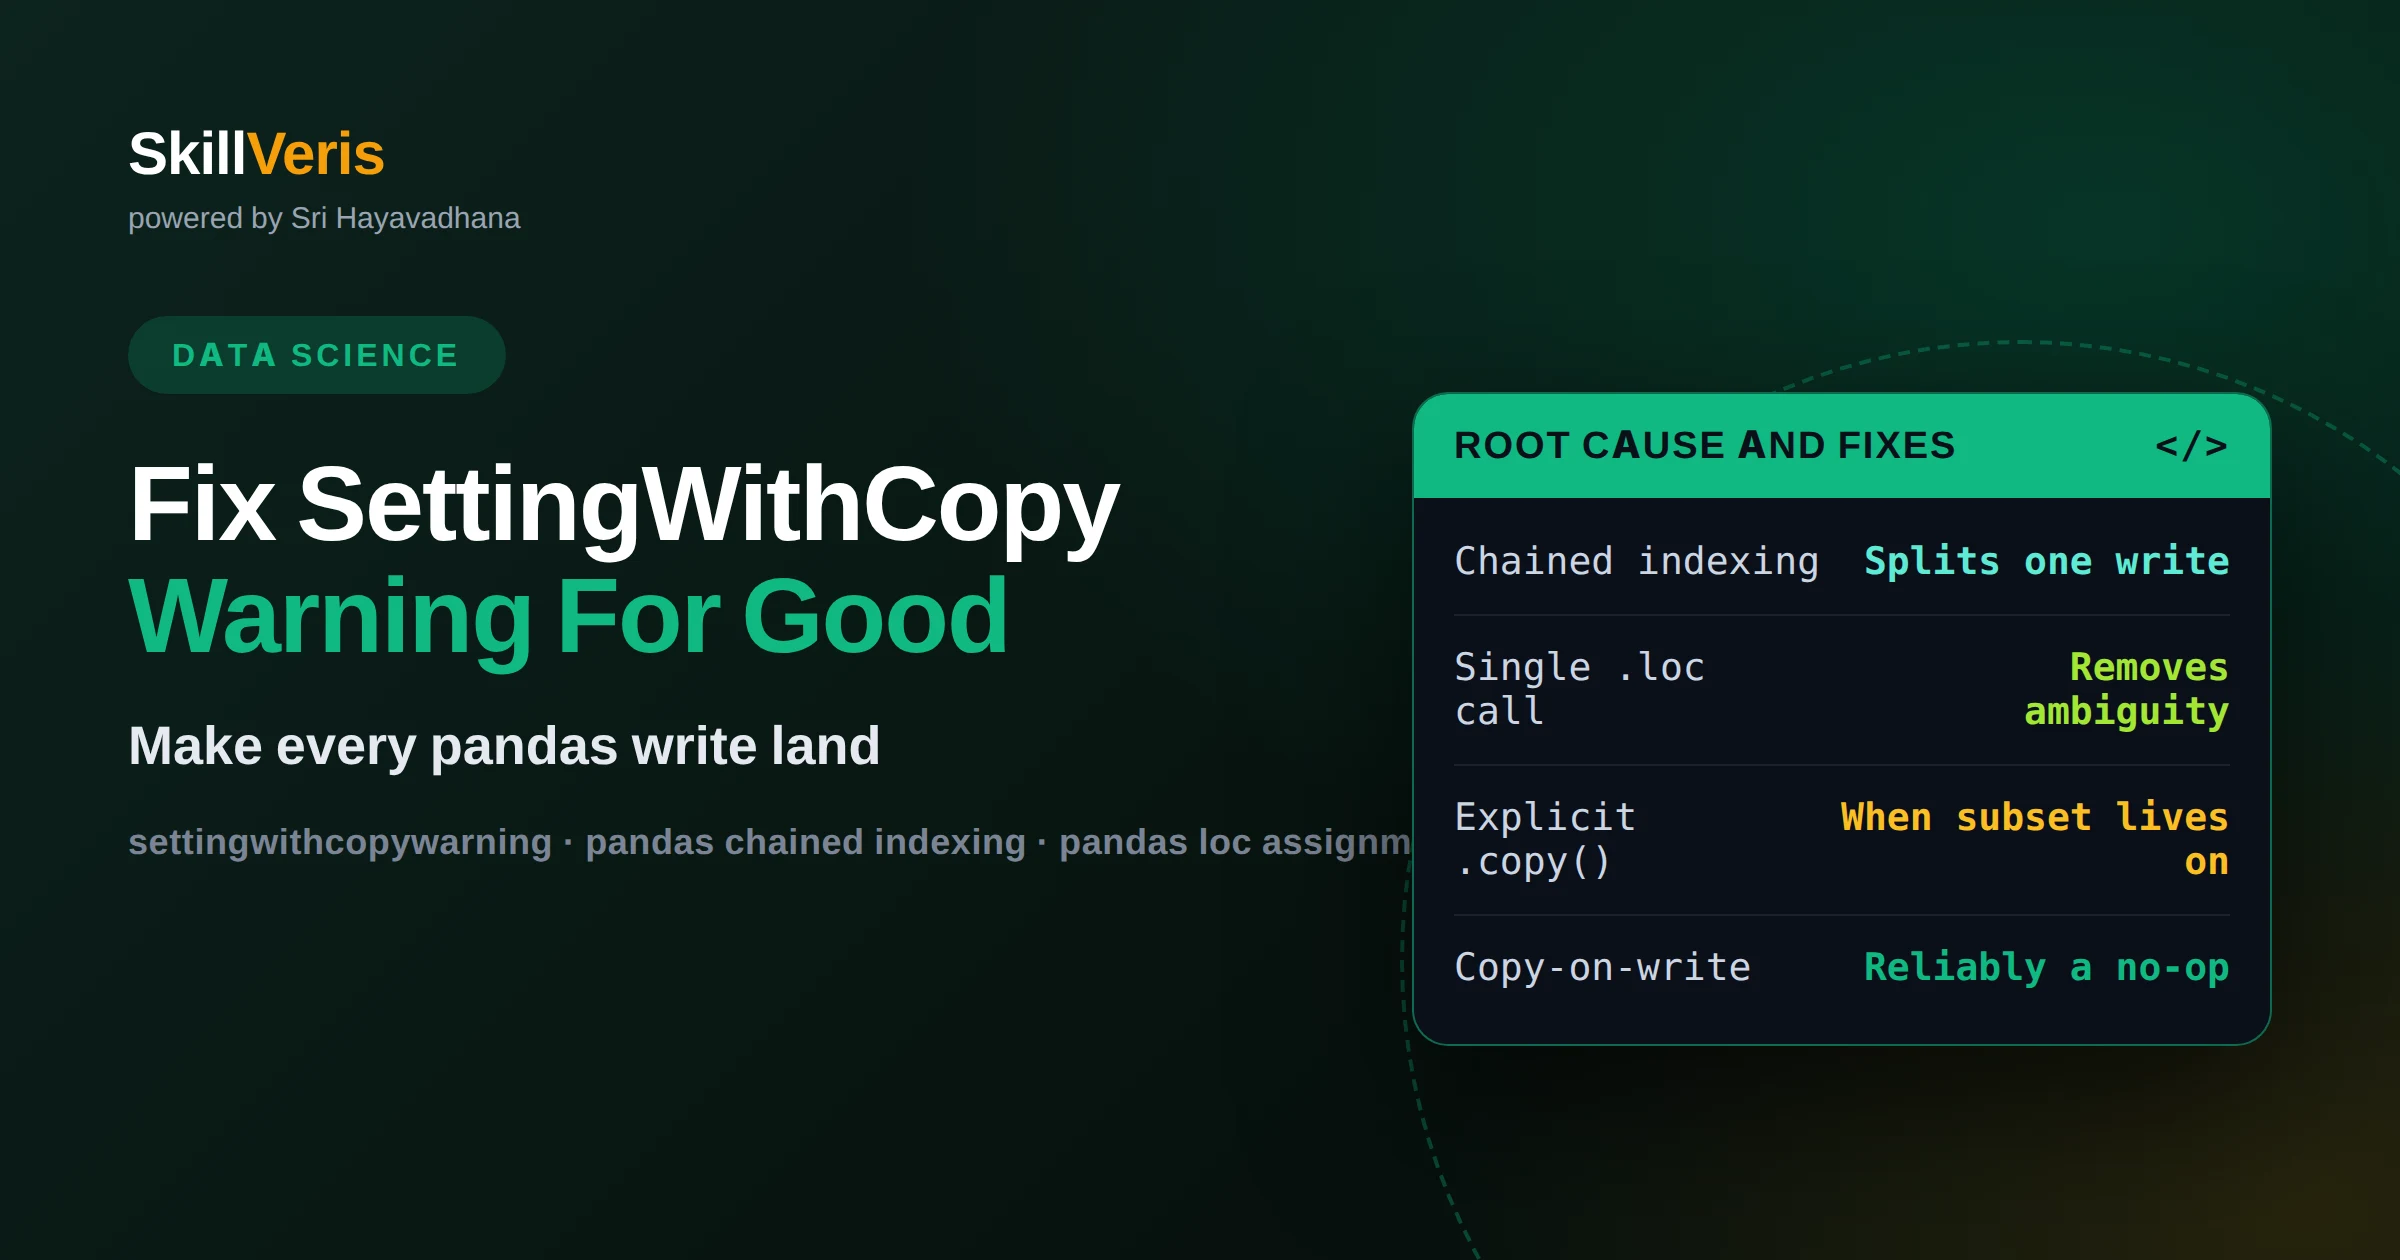
How to fix SettingWithCopyWarning in pandas for good
SettingWithCopyWarning means pandas cannot tell whether the object you are assigning into is a view of another frame or a fresh copy, so your write may silently go nowhere. The durable fix is structural: select and assign in one .loc step, or take an explicit .copy() when you mean to branch.
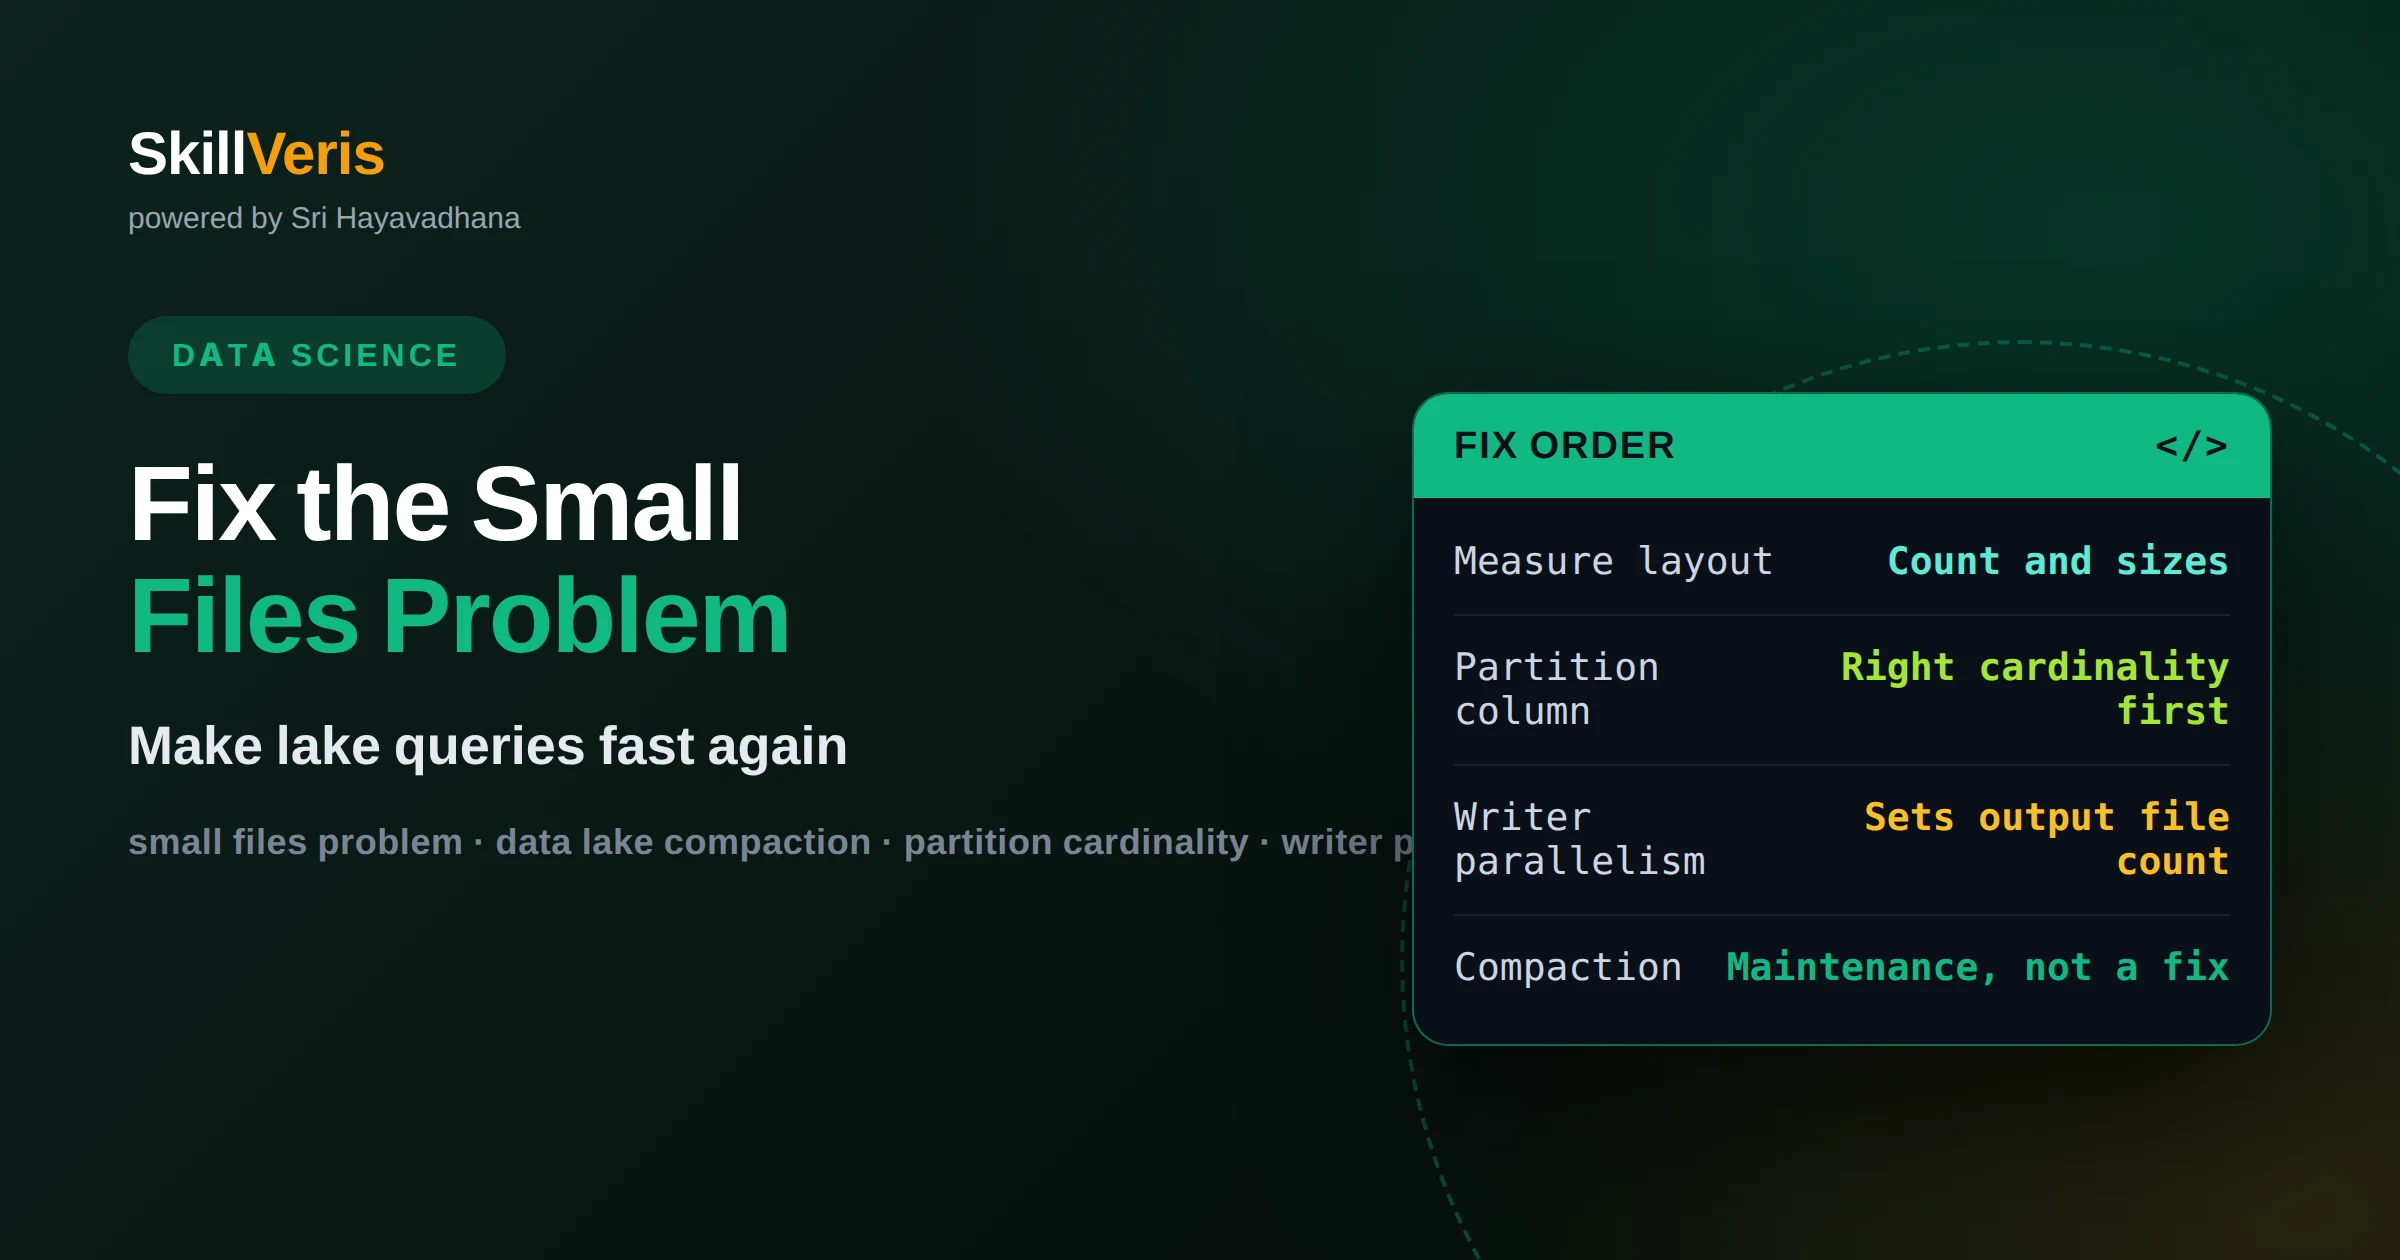
How to fix the small files problem in a data lake
Queries slow down when a table is split across a very large number of small files, because per-file overhead — listing, opening, reading metadata, scheduling a task — starts to dominate the actual reading. Fix it in order: partition cardinality first, writer parallelism second, compaction third.
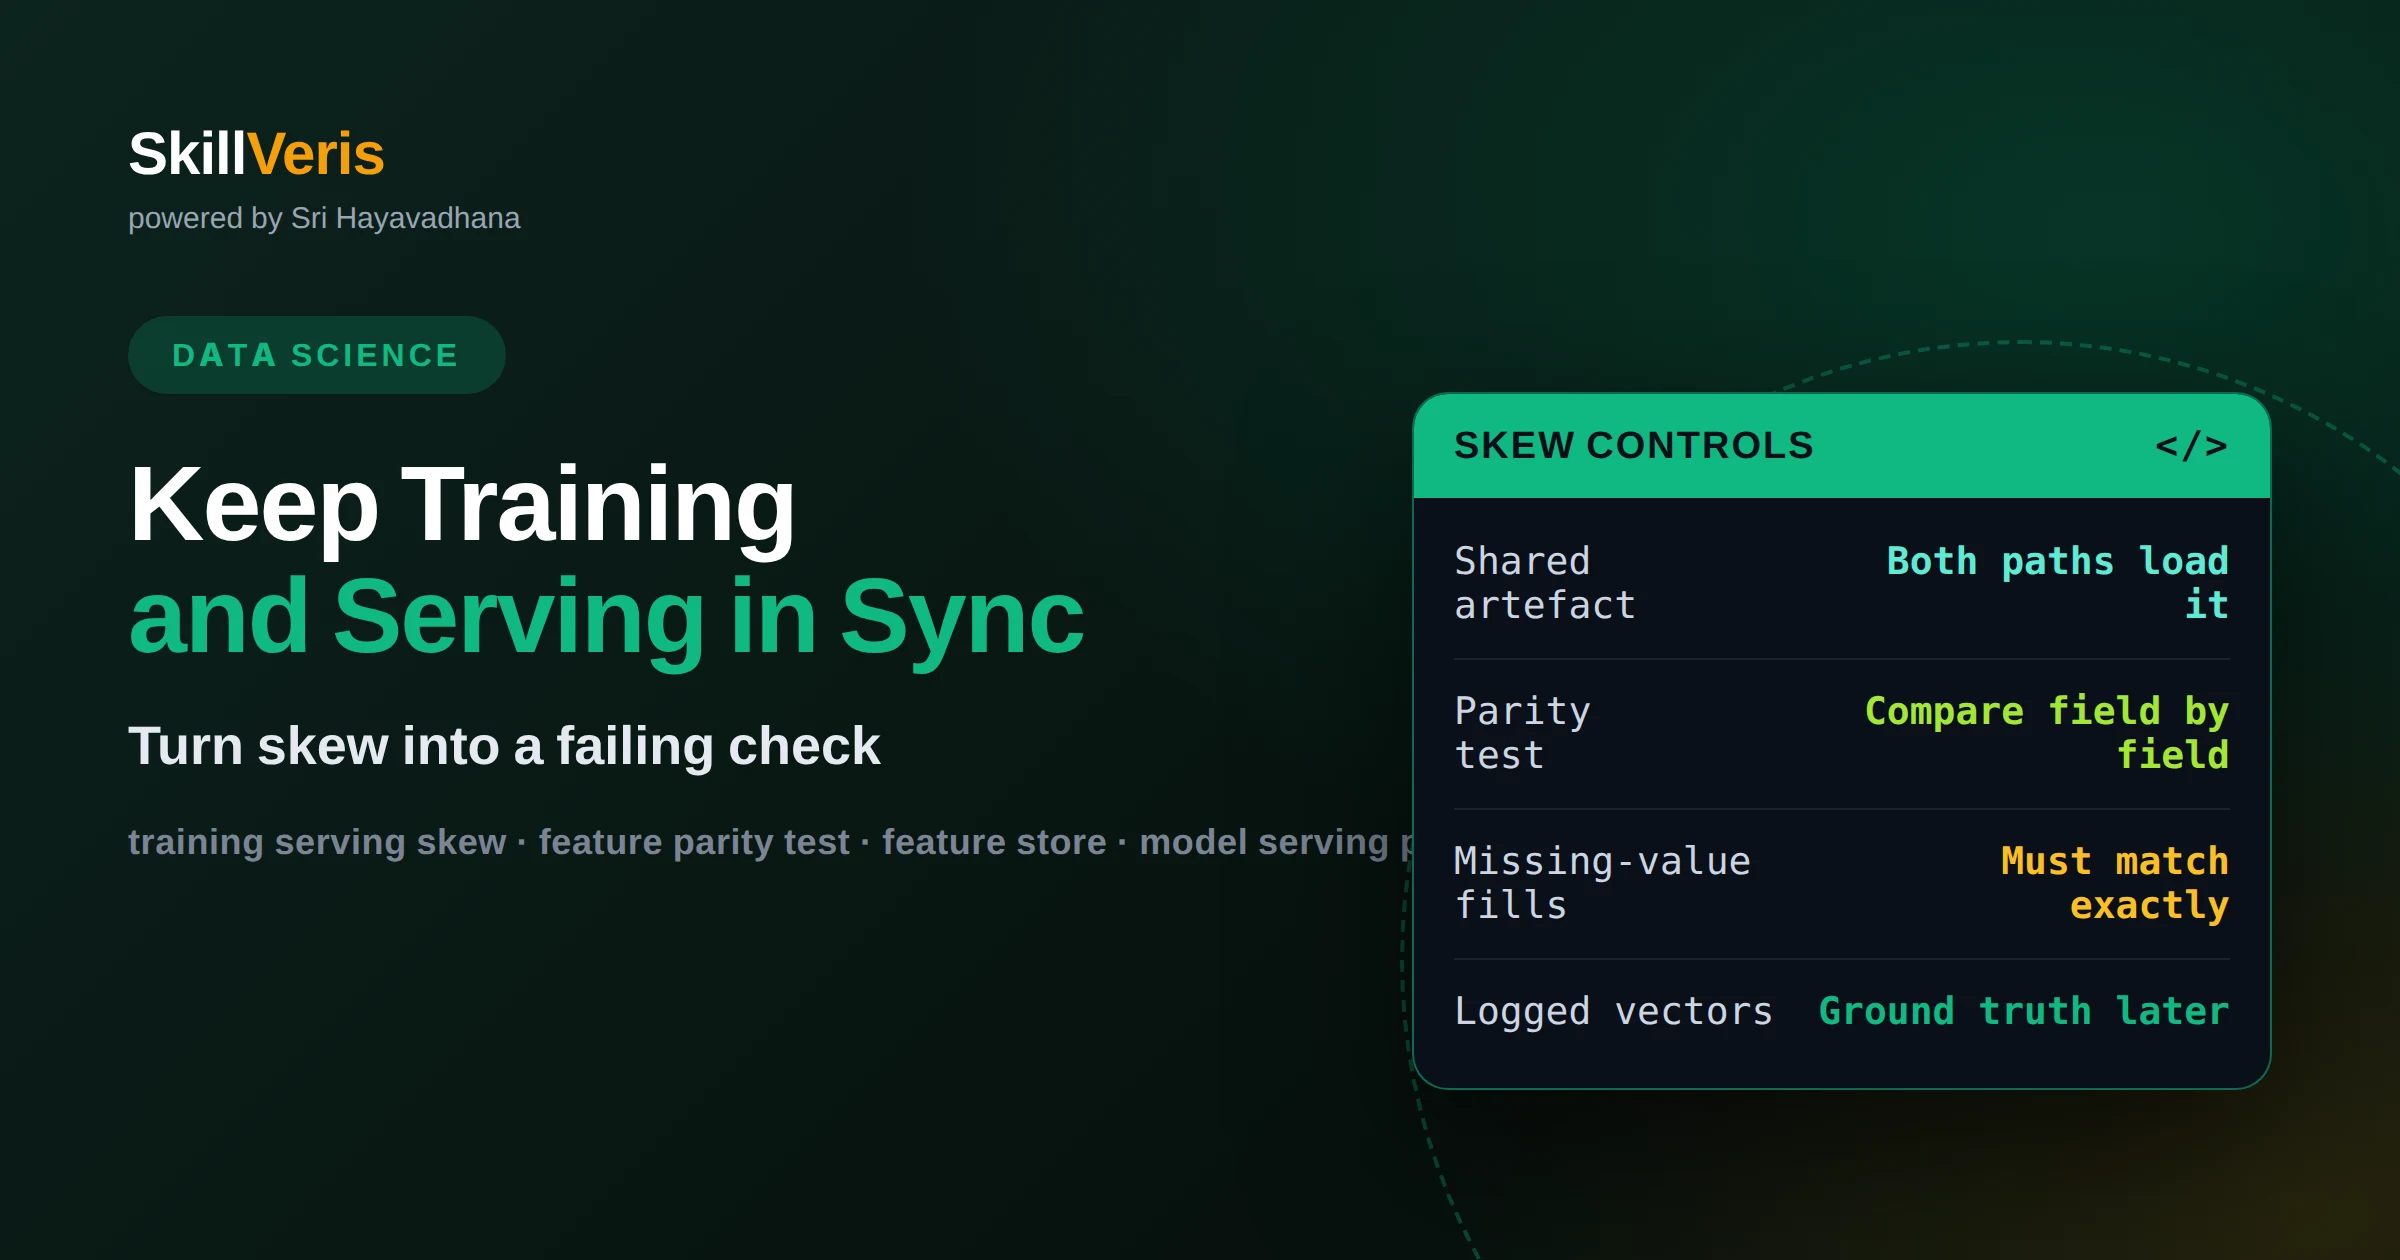
How to keep training and serving features in sync
Training-serving skew is an architecture problem, not a bug hiding in the code. Two implementations of the same feature will diverge eventually, so the fix is one shared transformation artefact plus a parity test that scores identical records through both paths and compares outputs field by field. This article covers the divergences that actually bite.
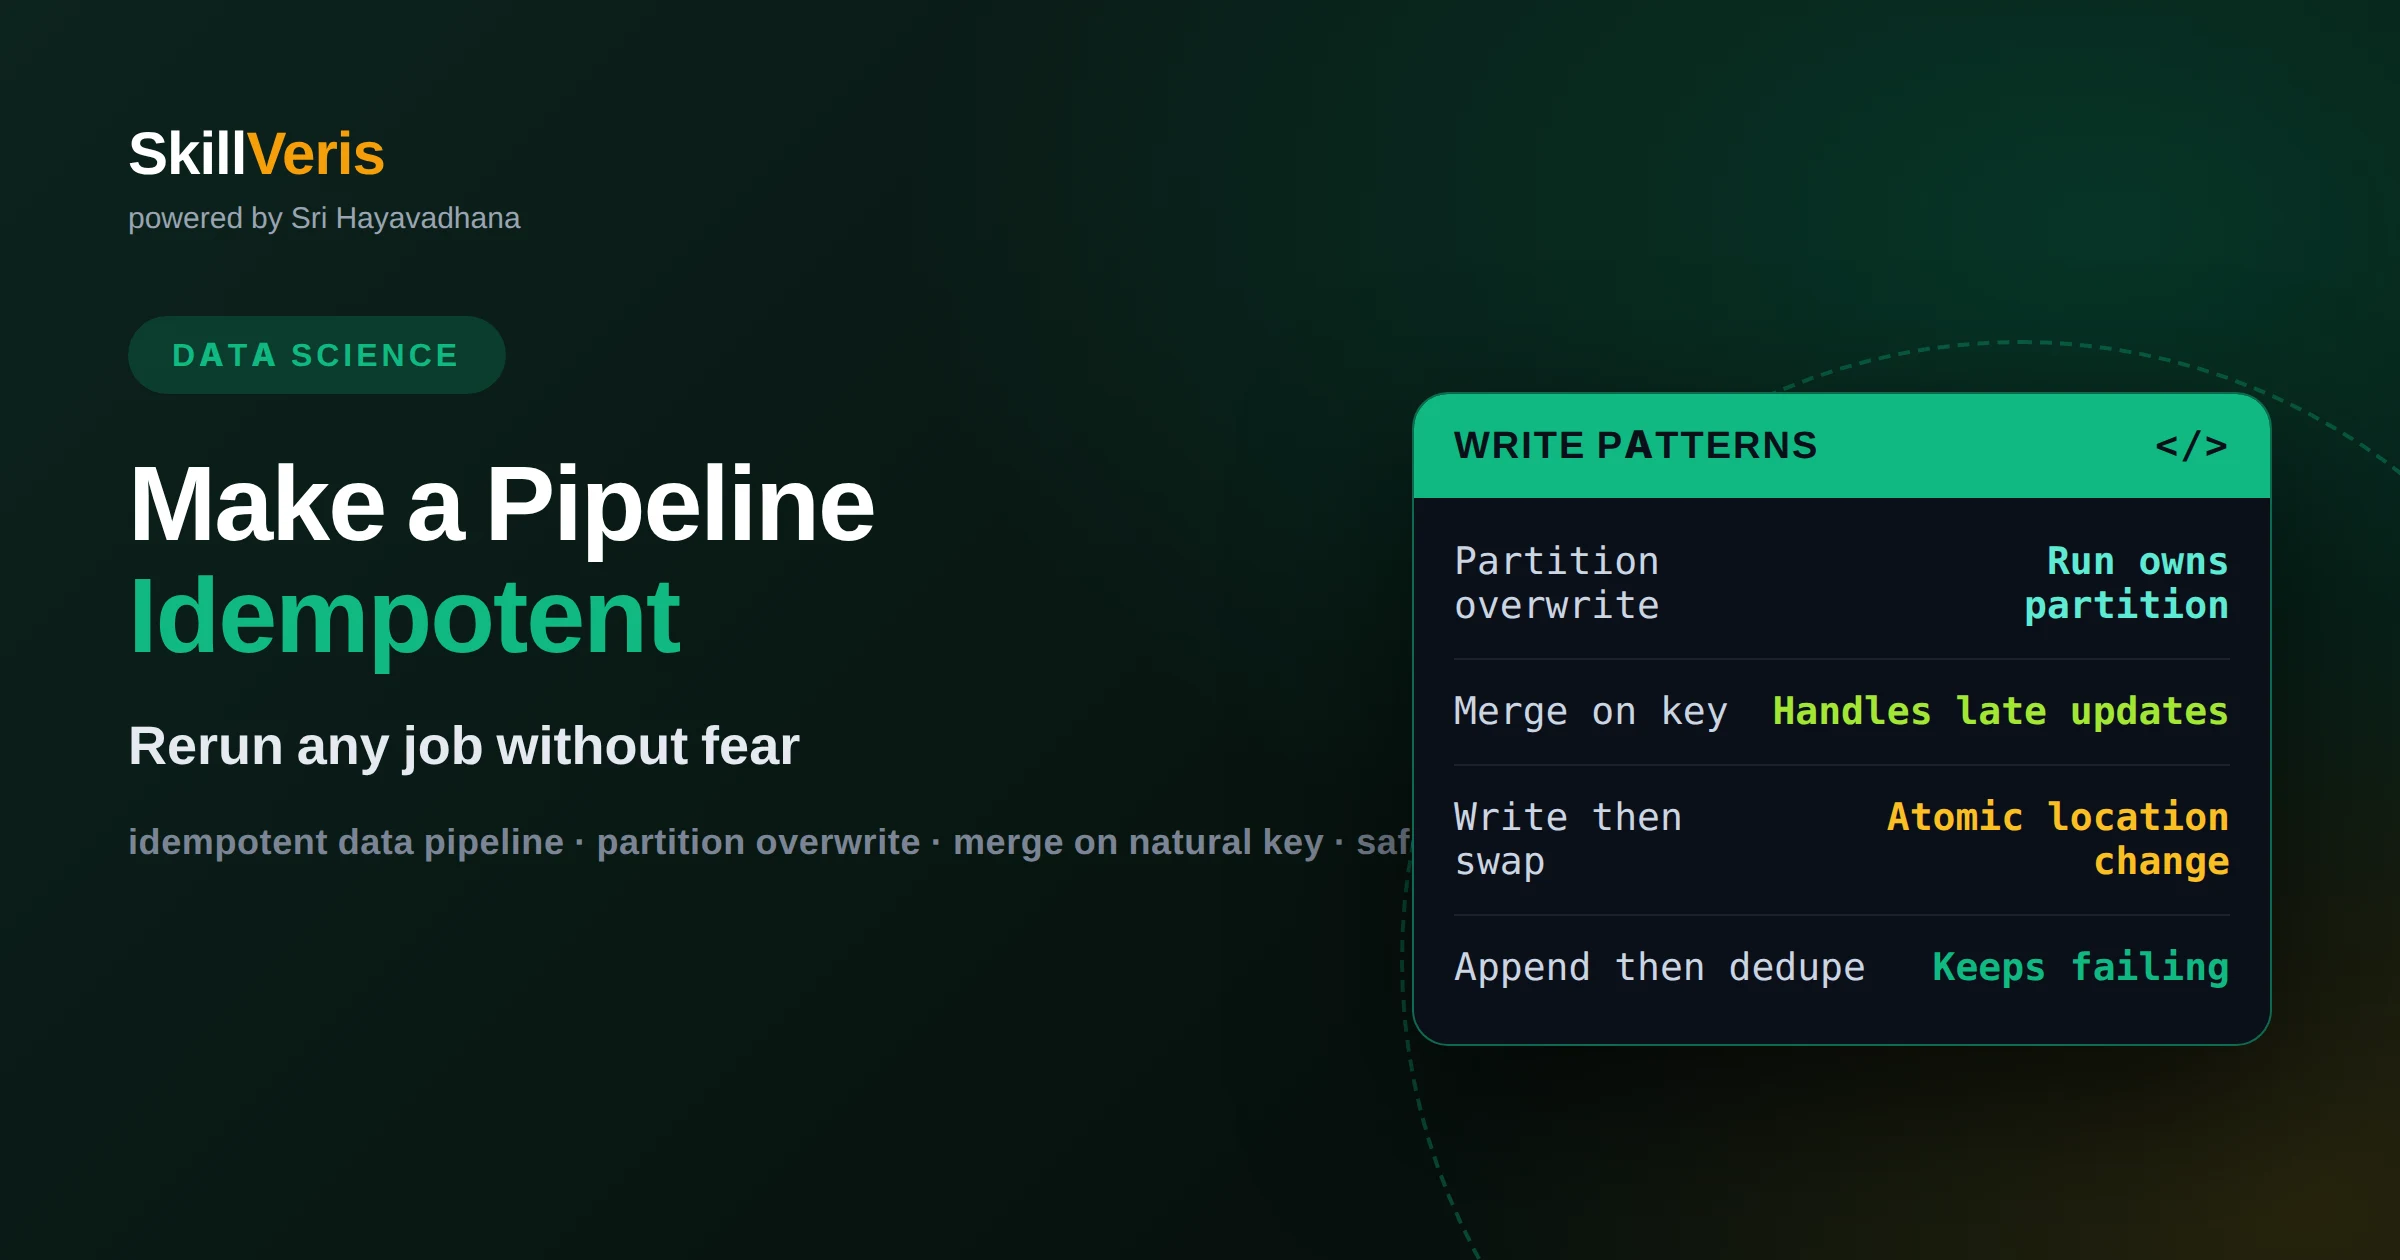
How to make a data pipeline idempotent so reruns are always safe
Idempotency is a property of how a job writes, not of what it computes. Three write patterns deliver it: overwrite the partition the run owns, merge on a deterministic natural key, or write to a new location and swap atomically. Append-then-deduplicate is the pattern that keeps failing.
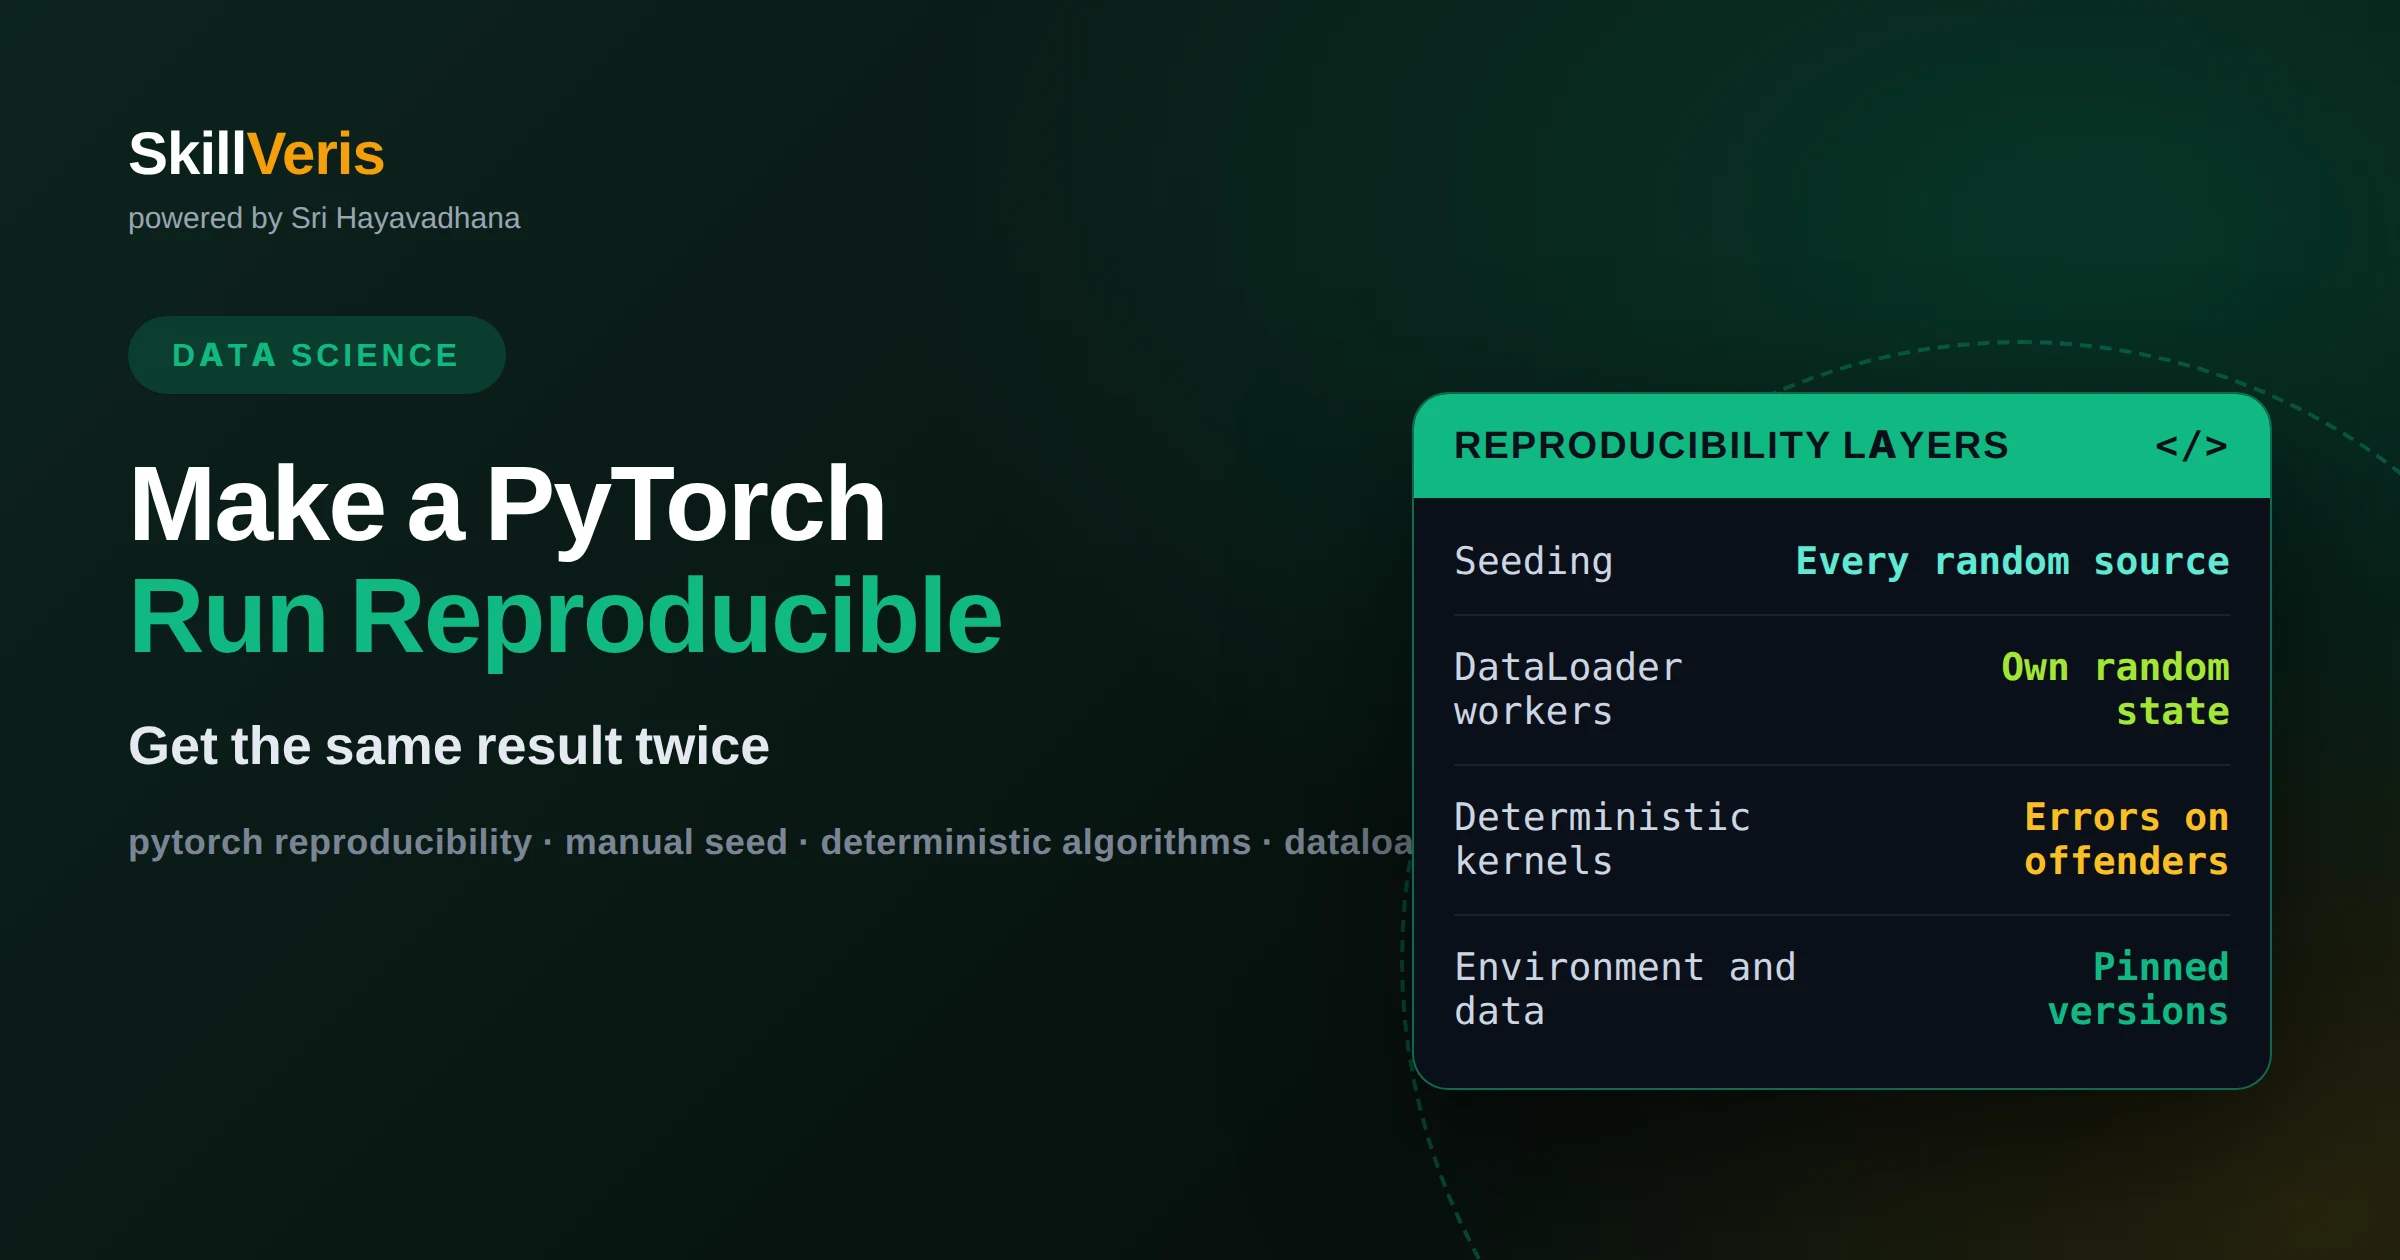
How to make a PyTorch training run reproducible
Reproducibility has three layers: seeding every random source including DataLoader workers, forcing deterministic kernels, and pinning the environment and data version. Fixing only the seed is why two runs still diverge. Learn what to pin, what it costs, and when variance is the result worth reporting.
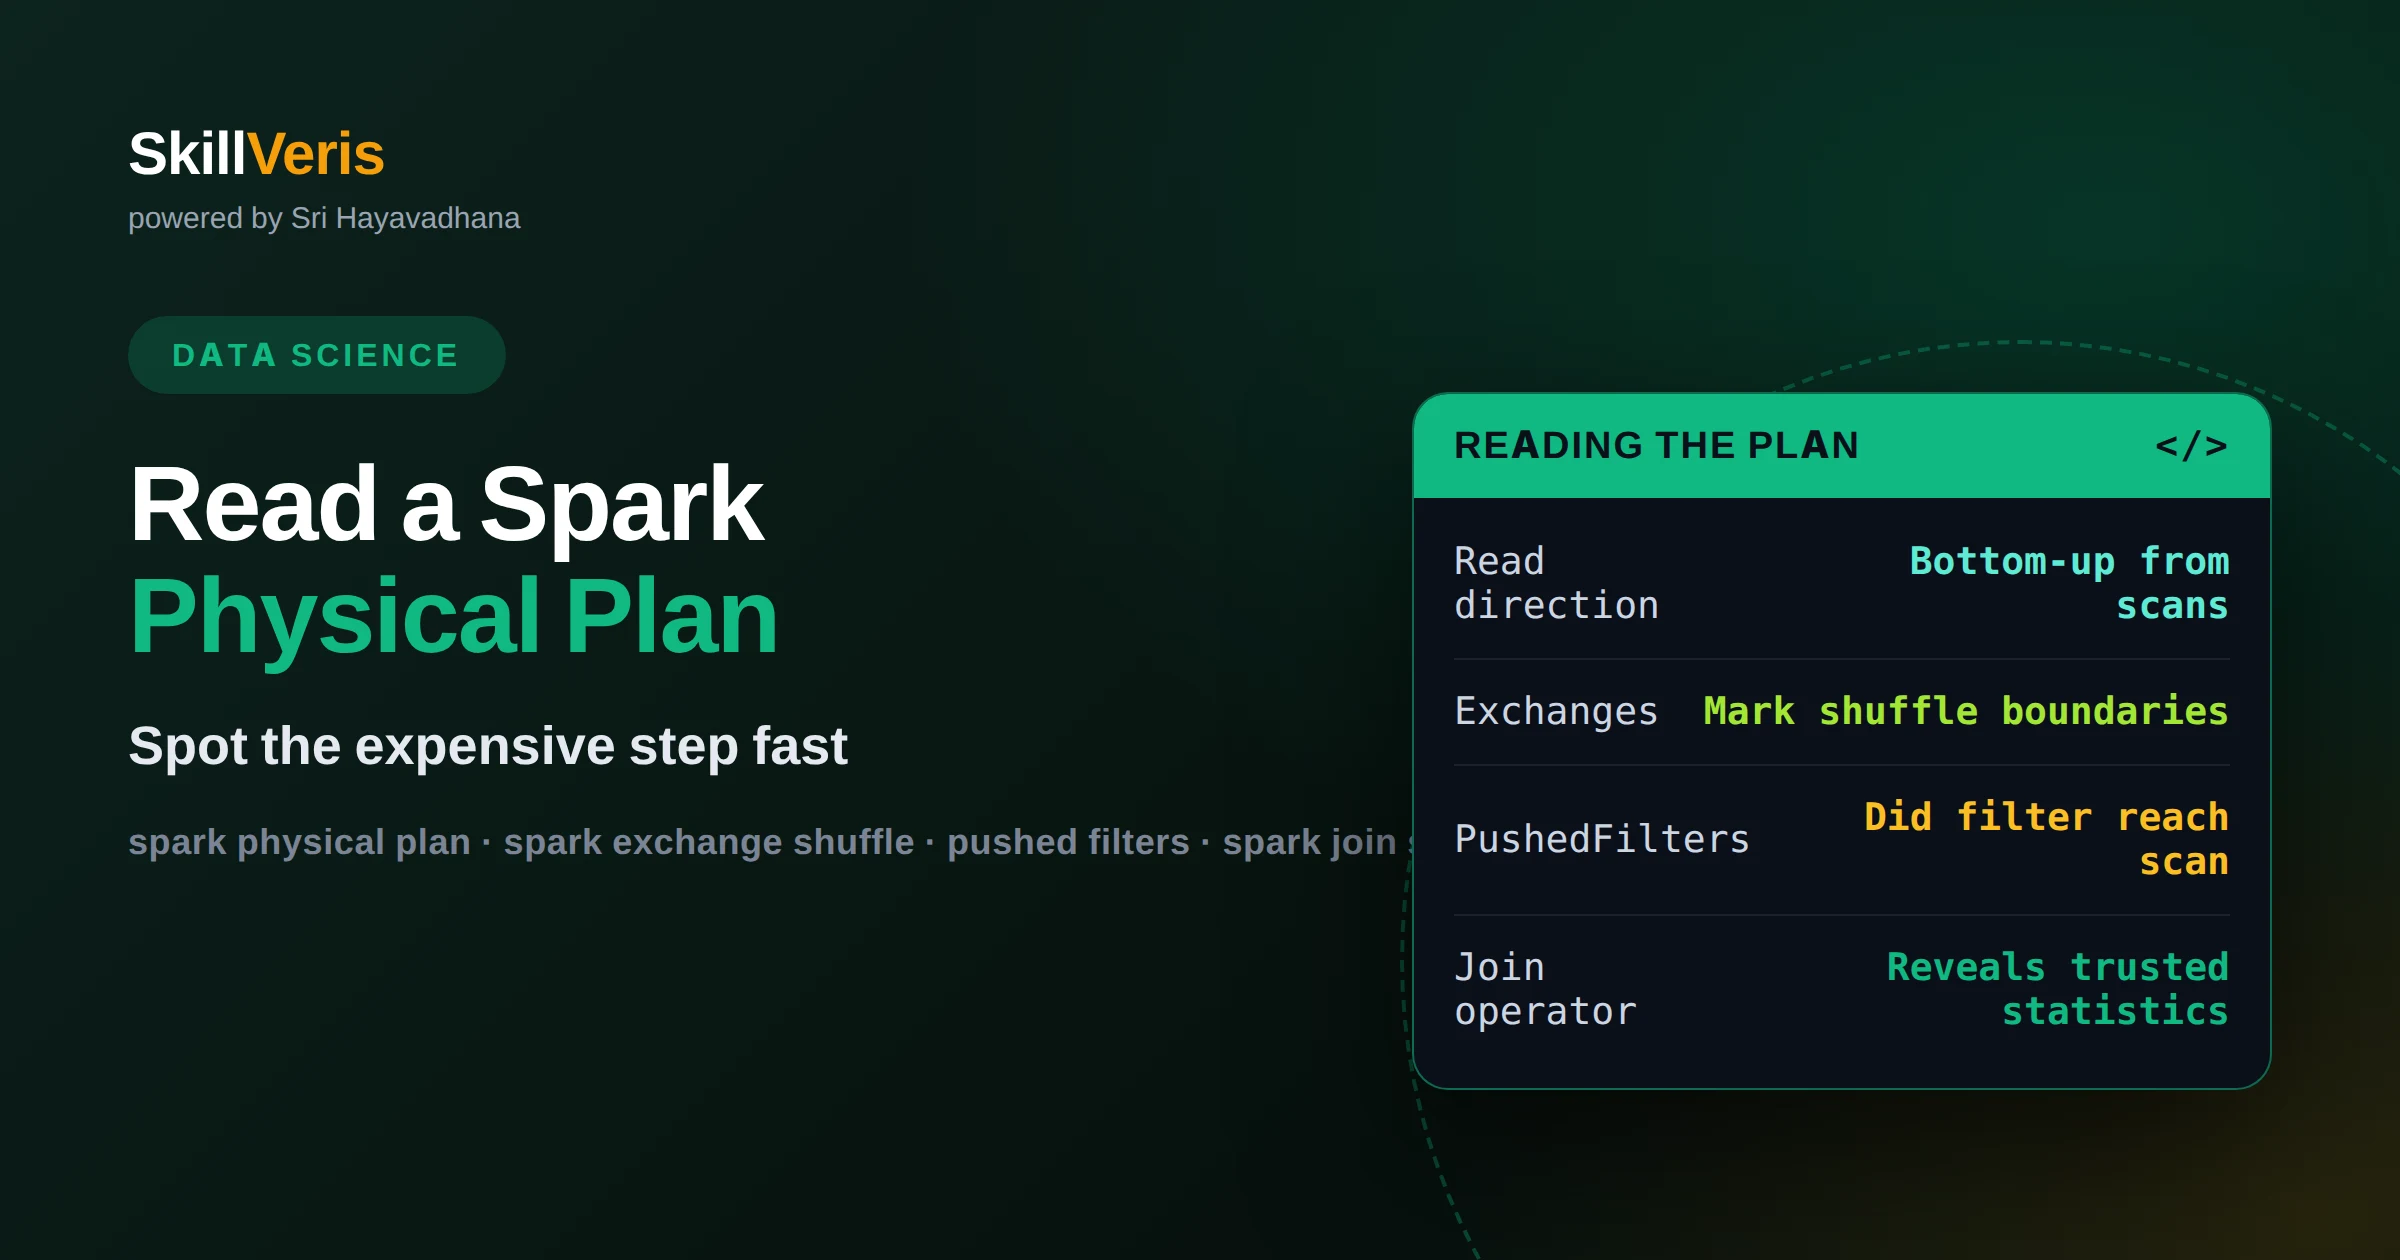
How to read a Spark physical plan and spot the expensive step
Read a Spark physical plan by answering three questions rather than parsing the whole tree: where are the exchanges, did the filter reach the scan, and which join did the optimiser pick. Those three answers account for most of the cost difference between a fast query and a slow one.
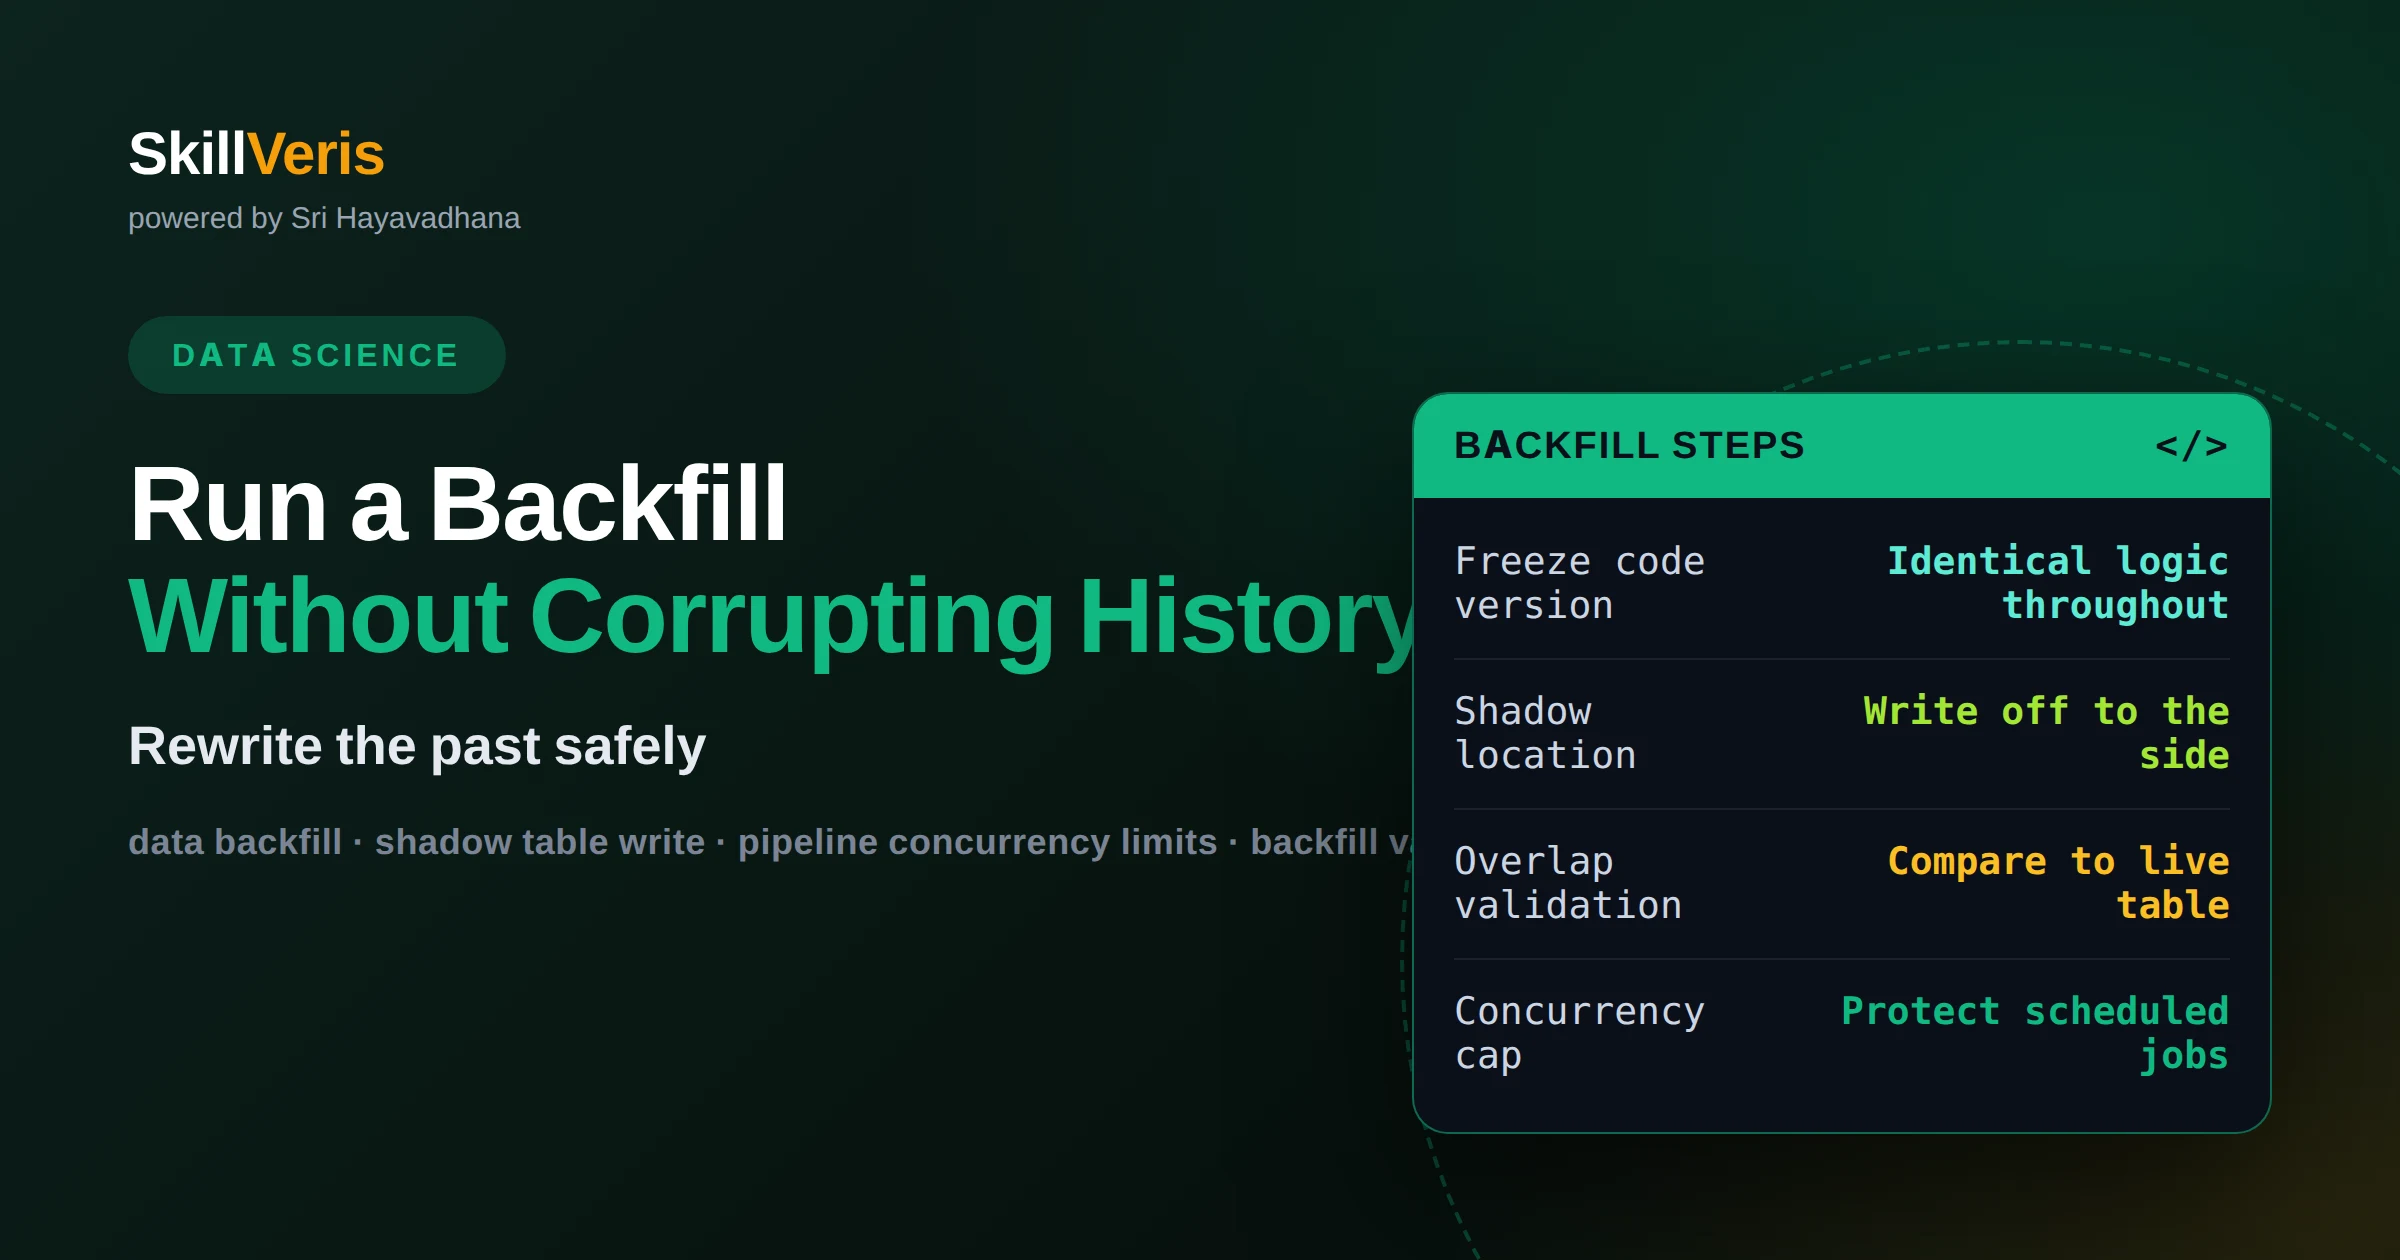
How to run a backfill without corrupting the history you already have
Treat a backfill as its own controlled operation rather than a rerun with a wider date range. Freeze the code version, write to a shadow location, validate against the live table on overlapping periods, then swap. The two things that break backfills are runtime clock reads and unbounded concurrency.
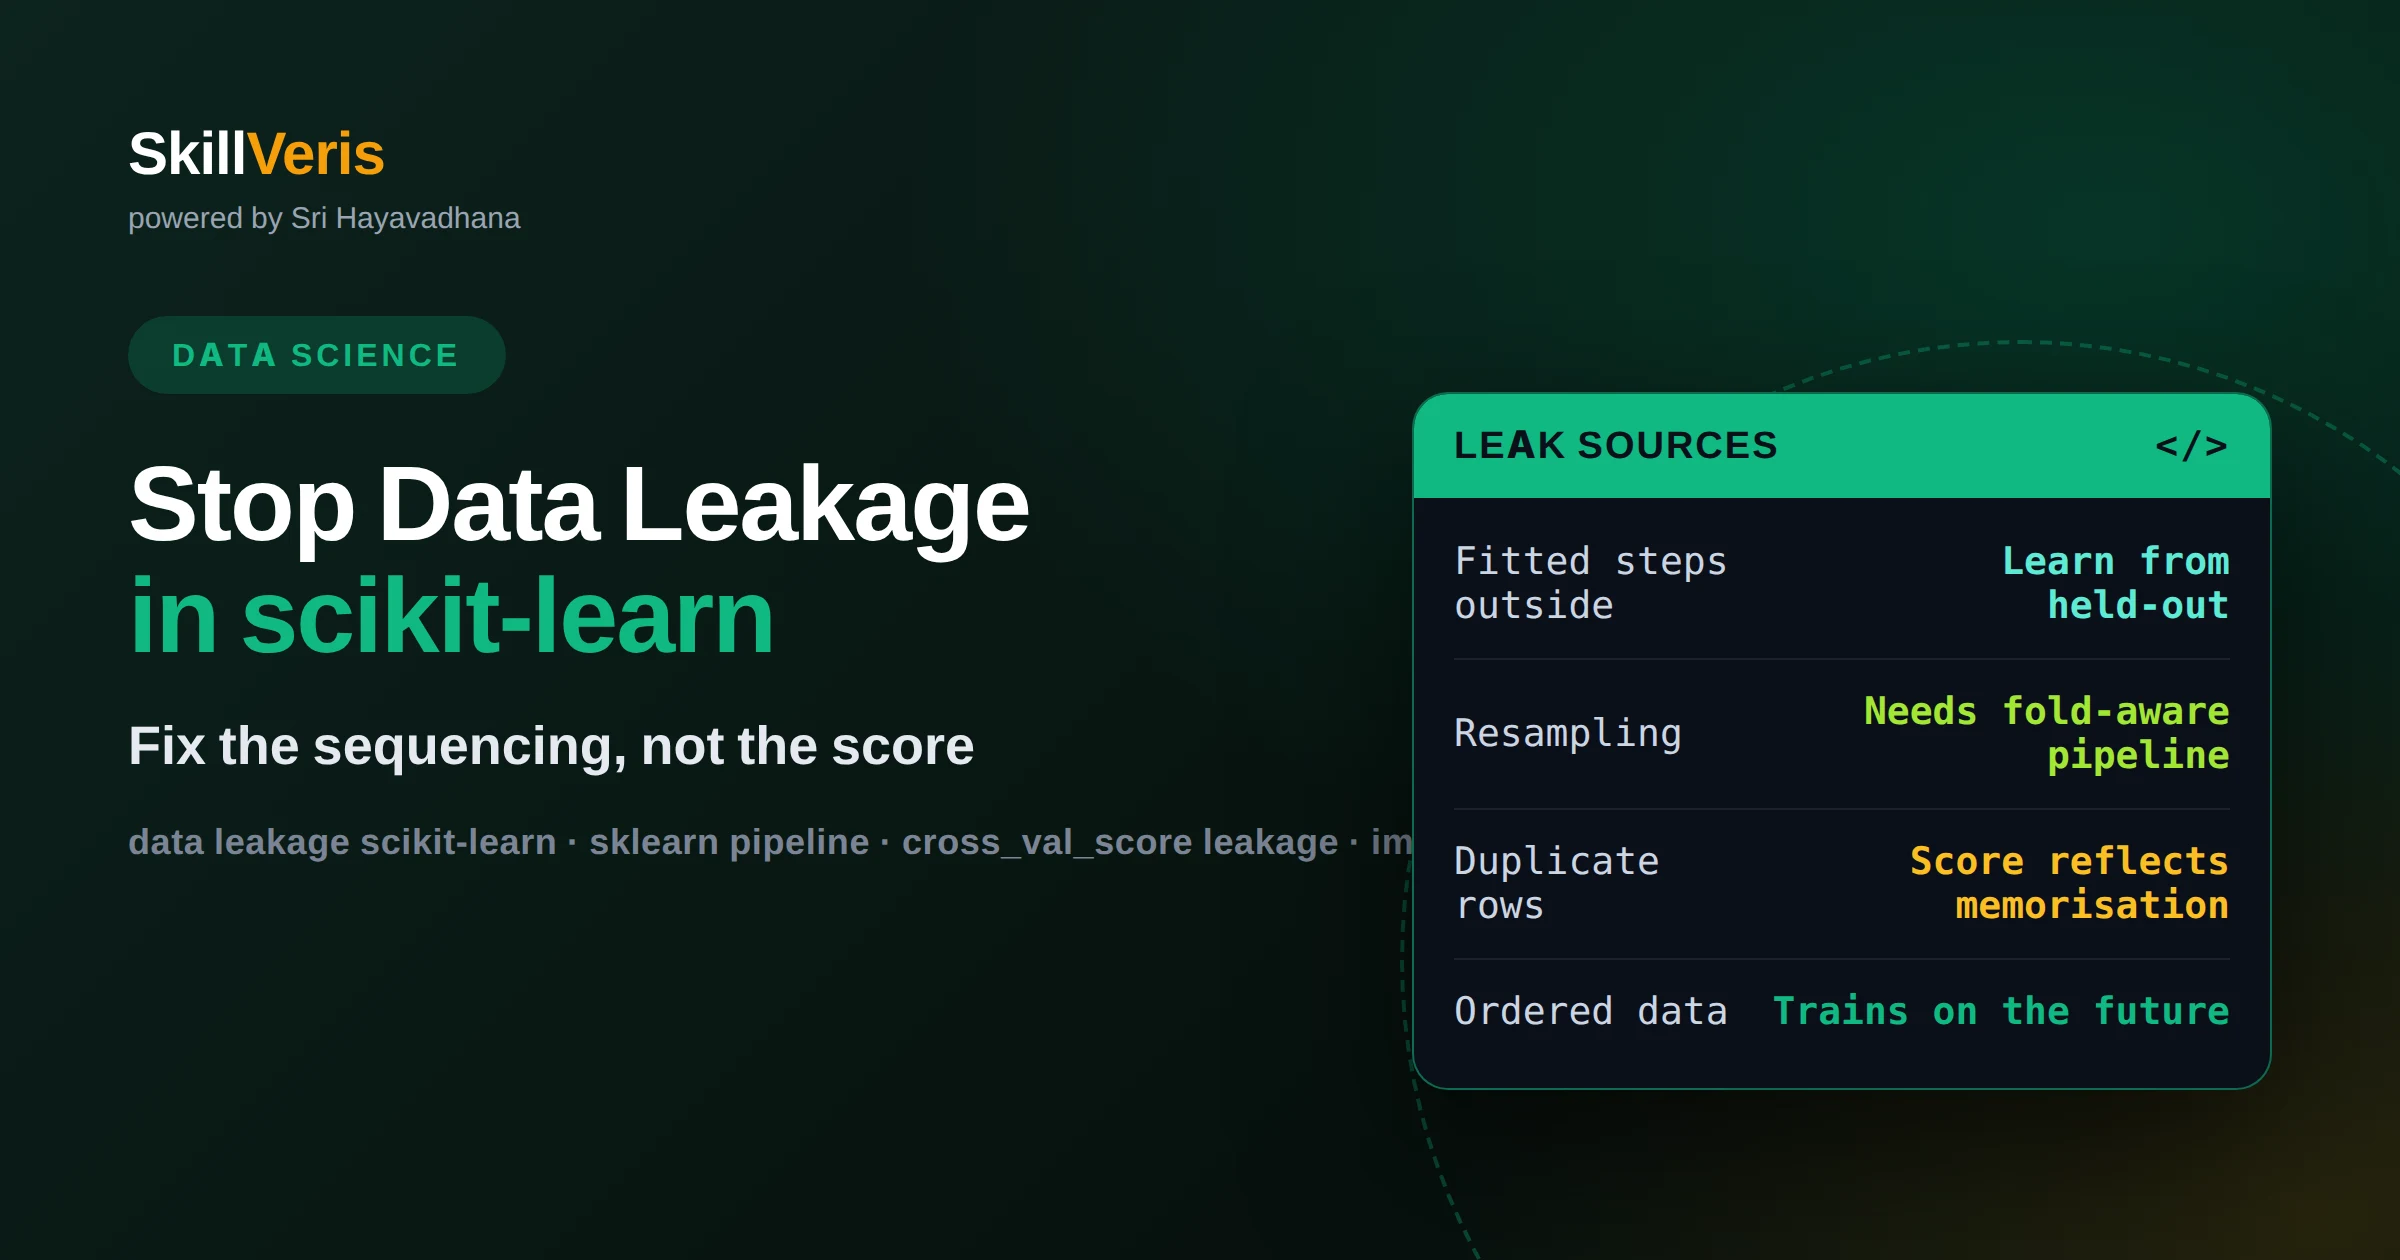
How to stop data leakage in a scikit-learn pipeline
Leakage is a sequencing failure, so fix it structurally: every step that learns parameters from data must live inside the Pipeline so it refits on each fold. Then handle the four leaks that survive that rule — target-derived features, duplicates, group membership and time order.
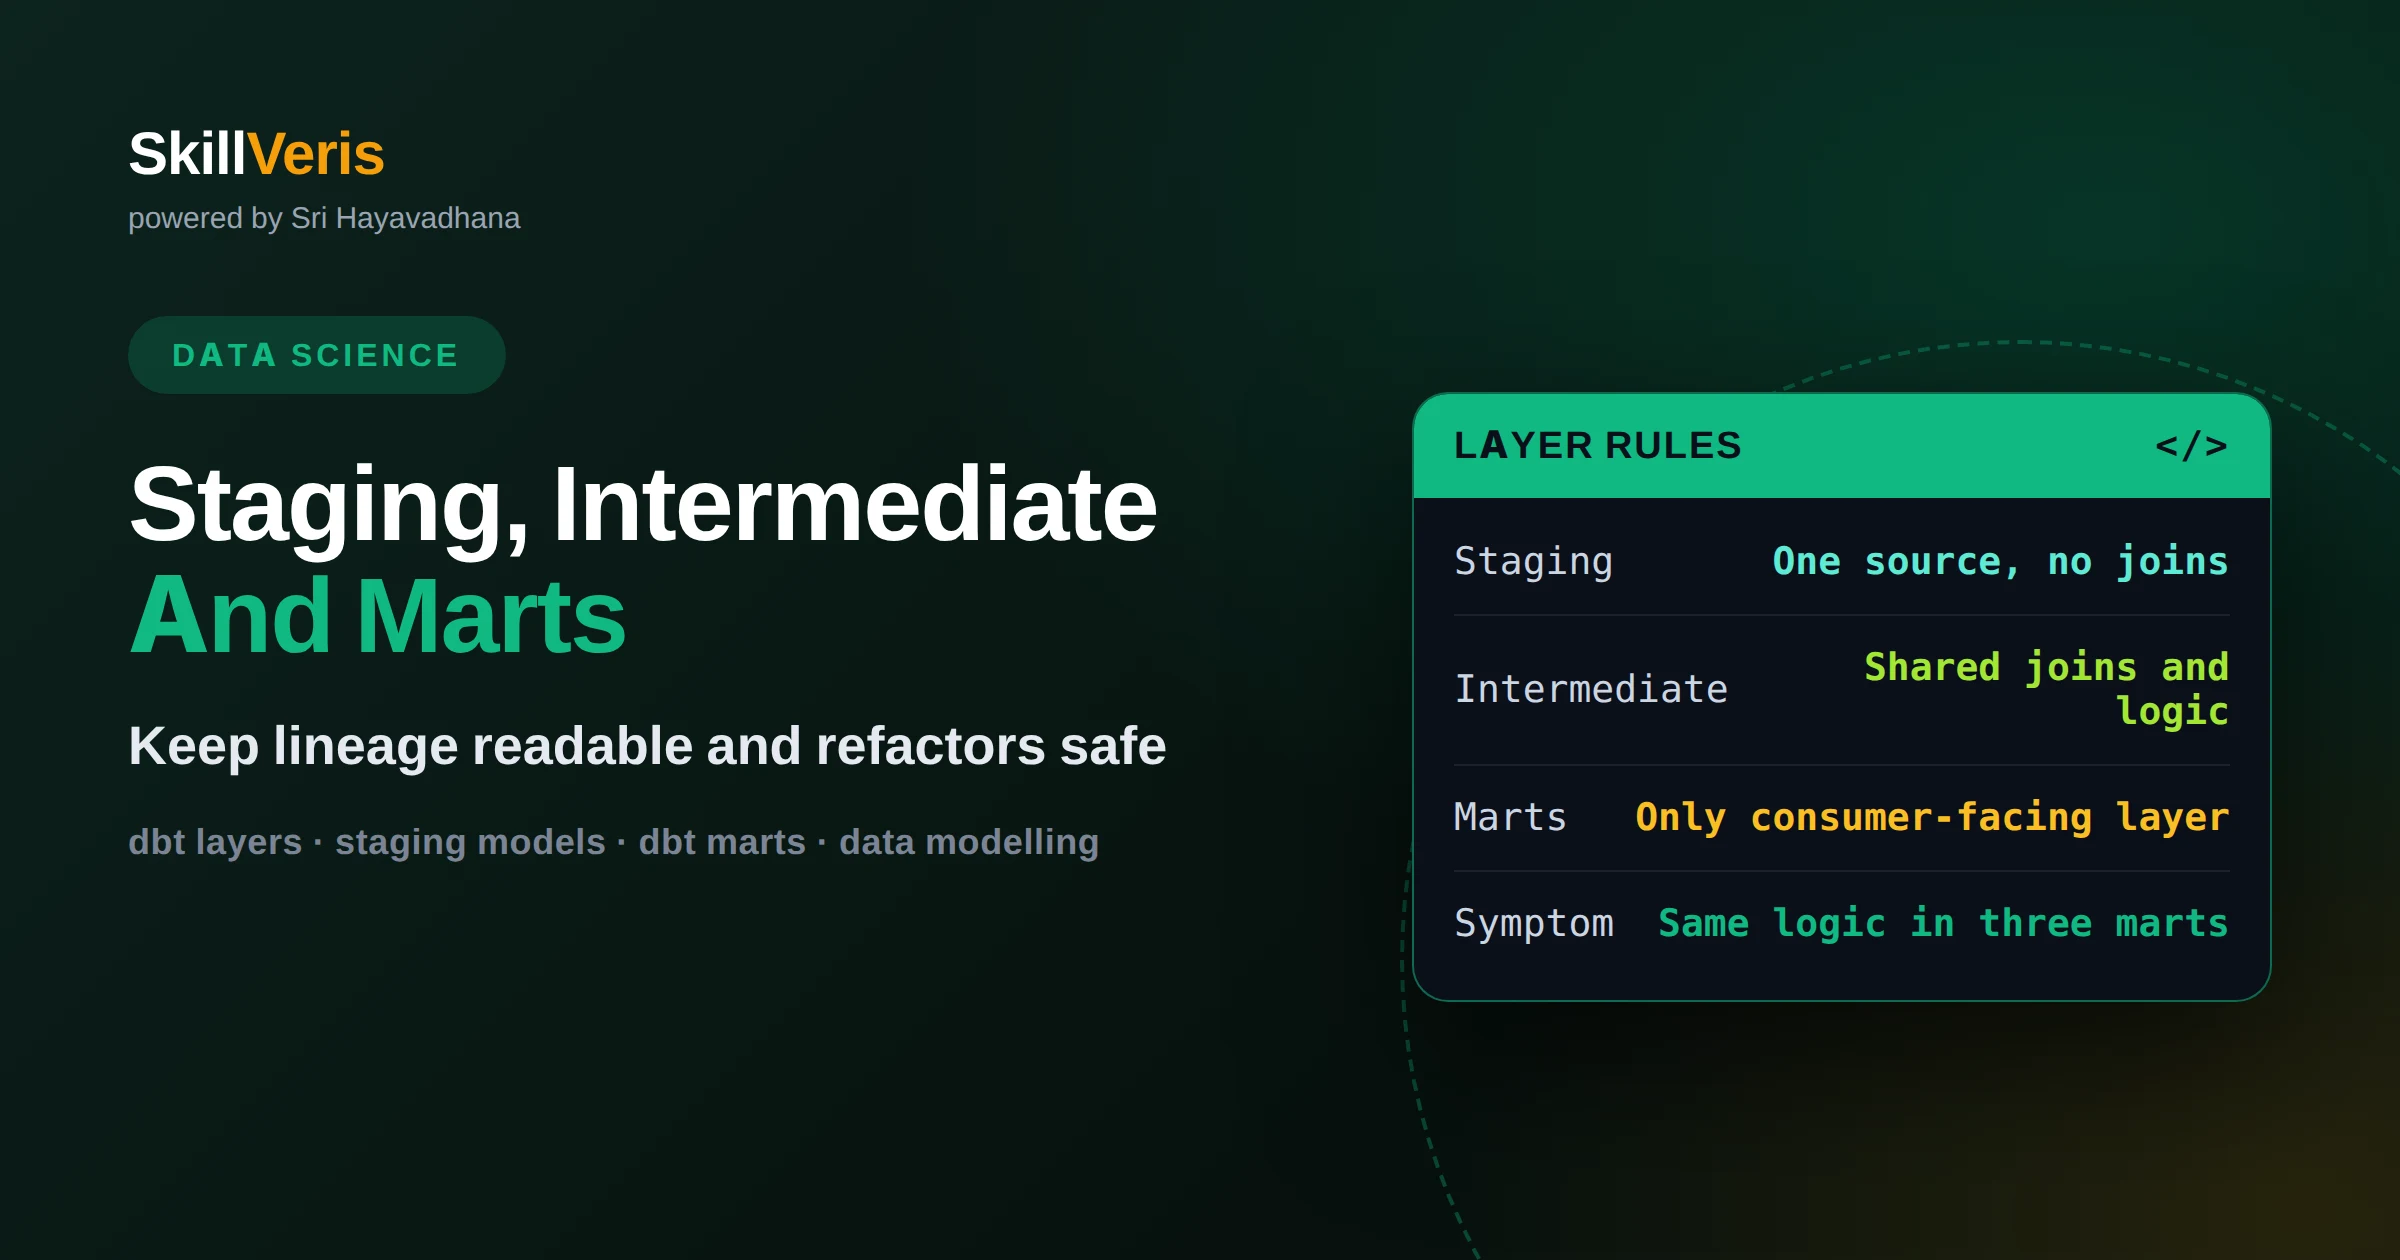
How to decide what belongs in staging, intermediate and marts in dbt
One rule per layer settles almost every placement question: staging renames and casts exactly one source and never joins, intermediate holds joins and logic more than one mart needs, and marts are the only layer a consumer selects from. Layer discipline is what keeps lineage readable and refactors safe.
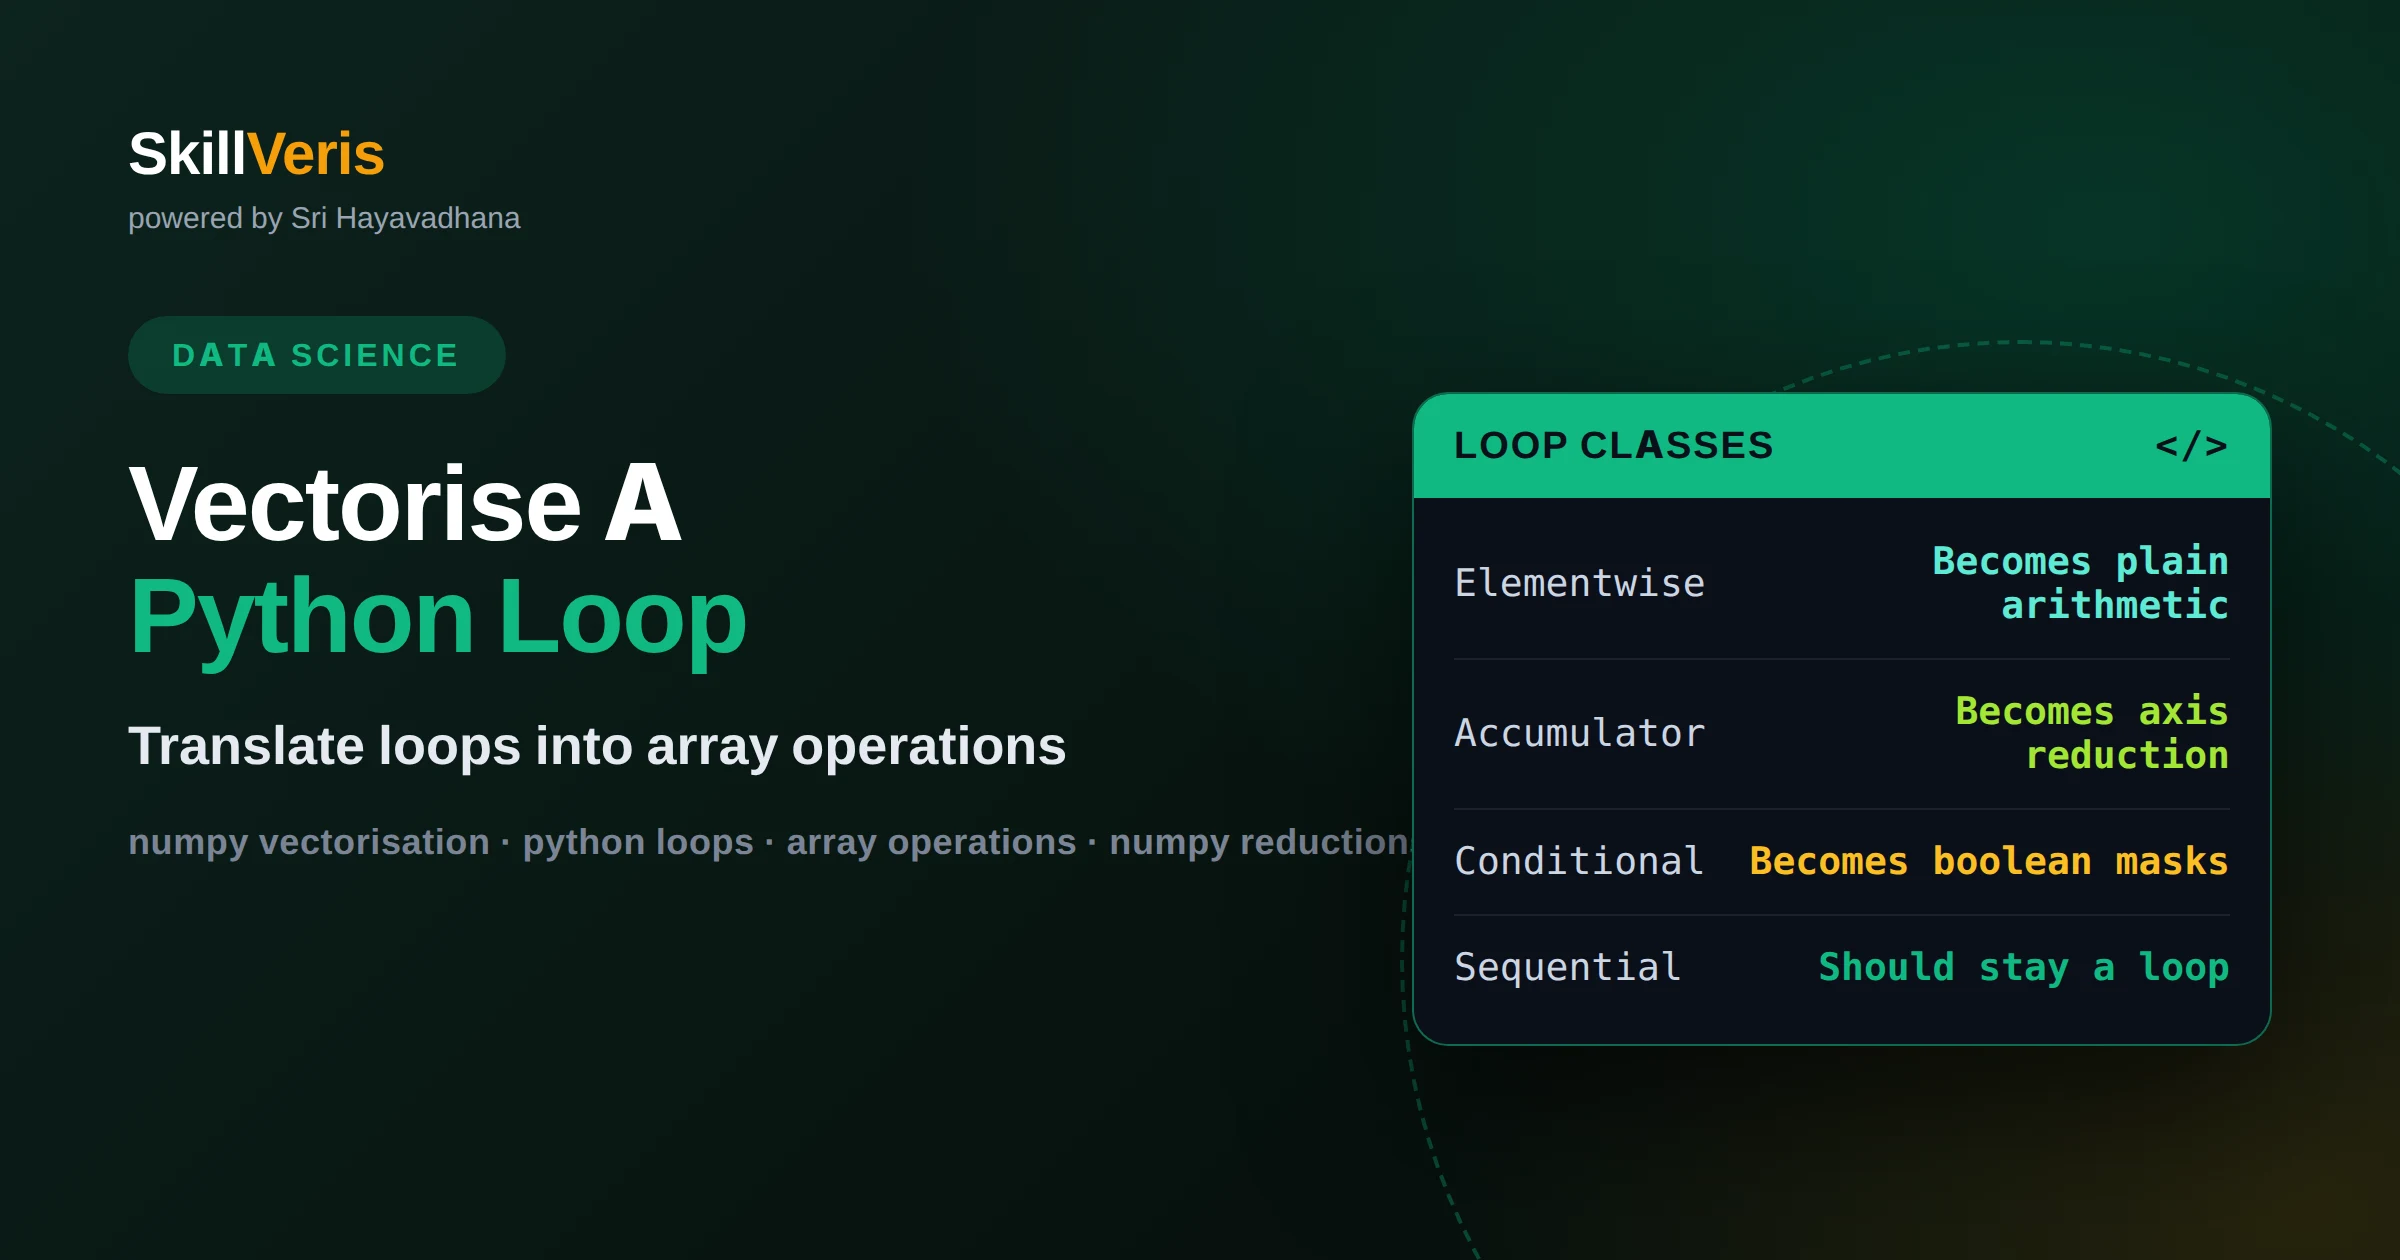
How to vectorise a Python loop with NumPy, step by step
Vectorising is a translation procedure, not a bag of tricks. Classify the loop first — elementwise, reduction, sliding window or conditional — then map it to its array form: arithmetic, a reduction with an axis, a windowed view or cumulative operation, and boolean masks or where.
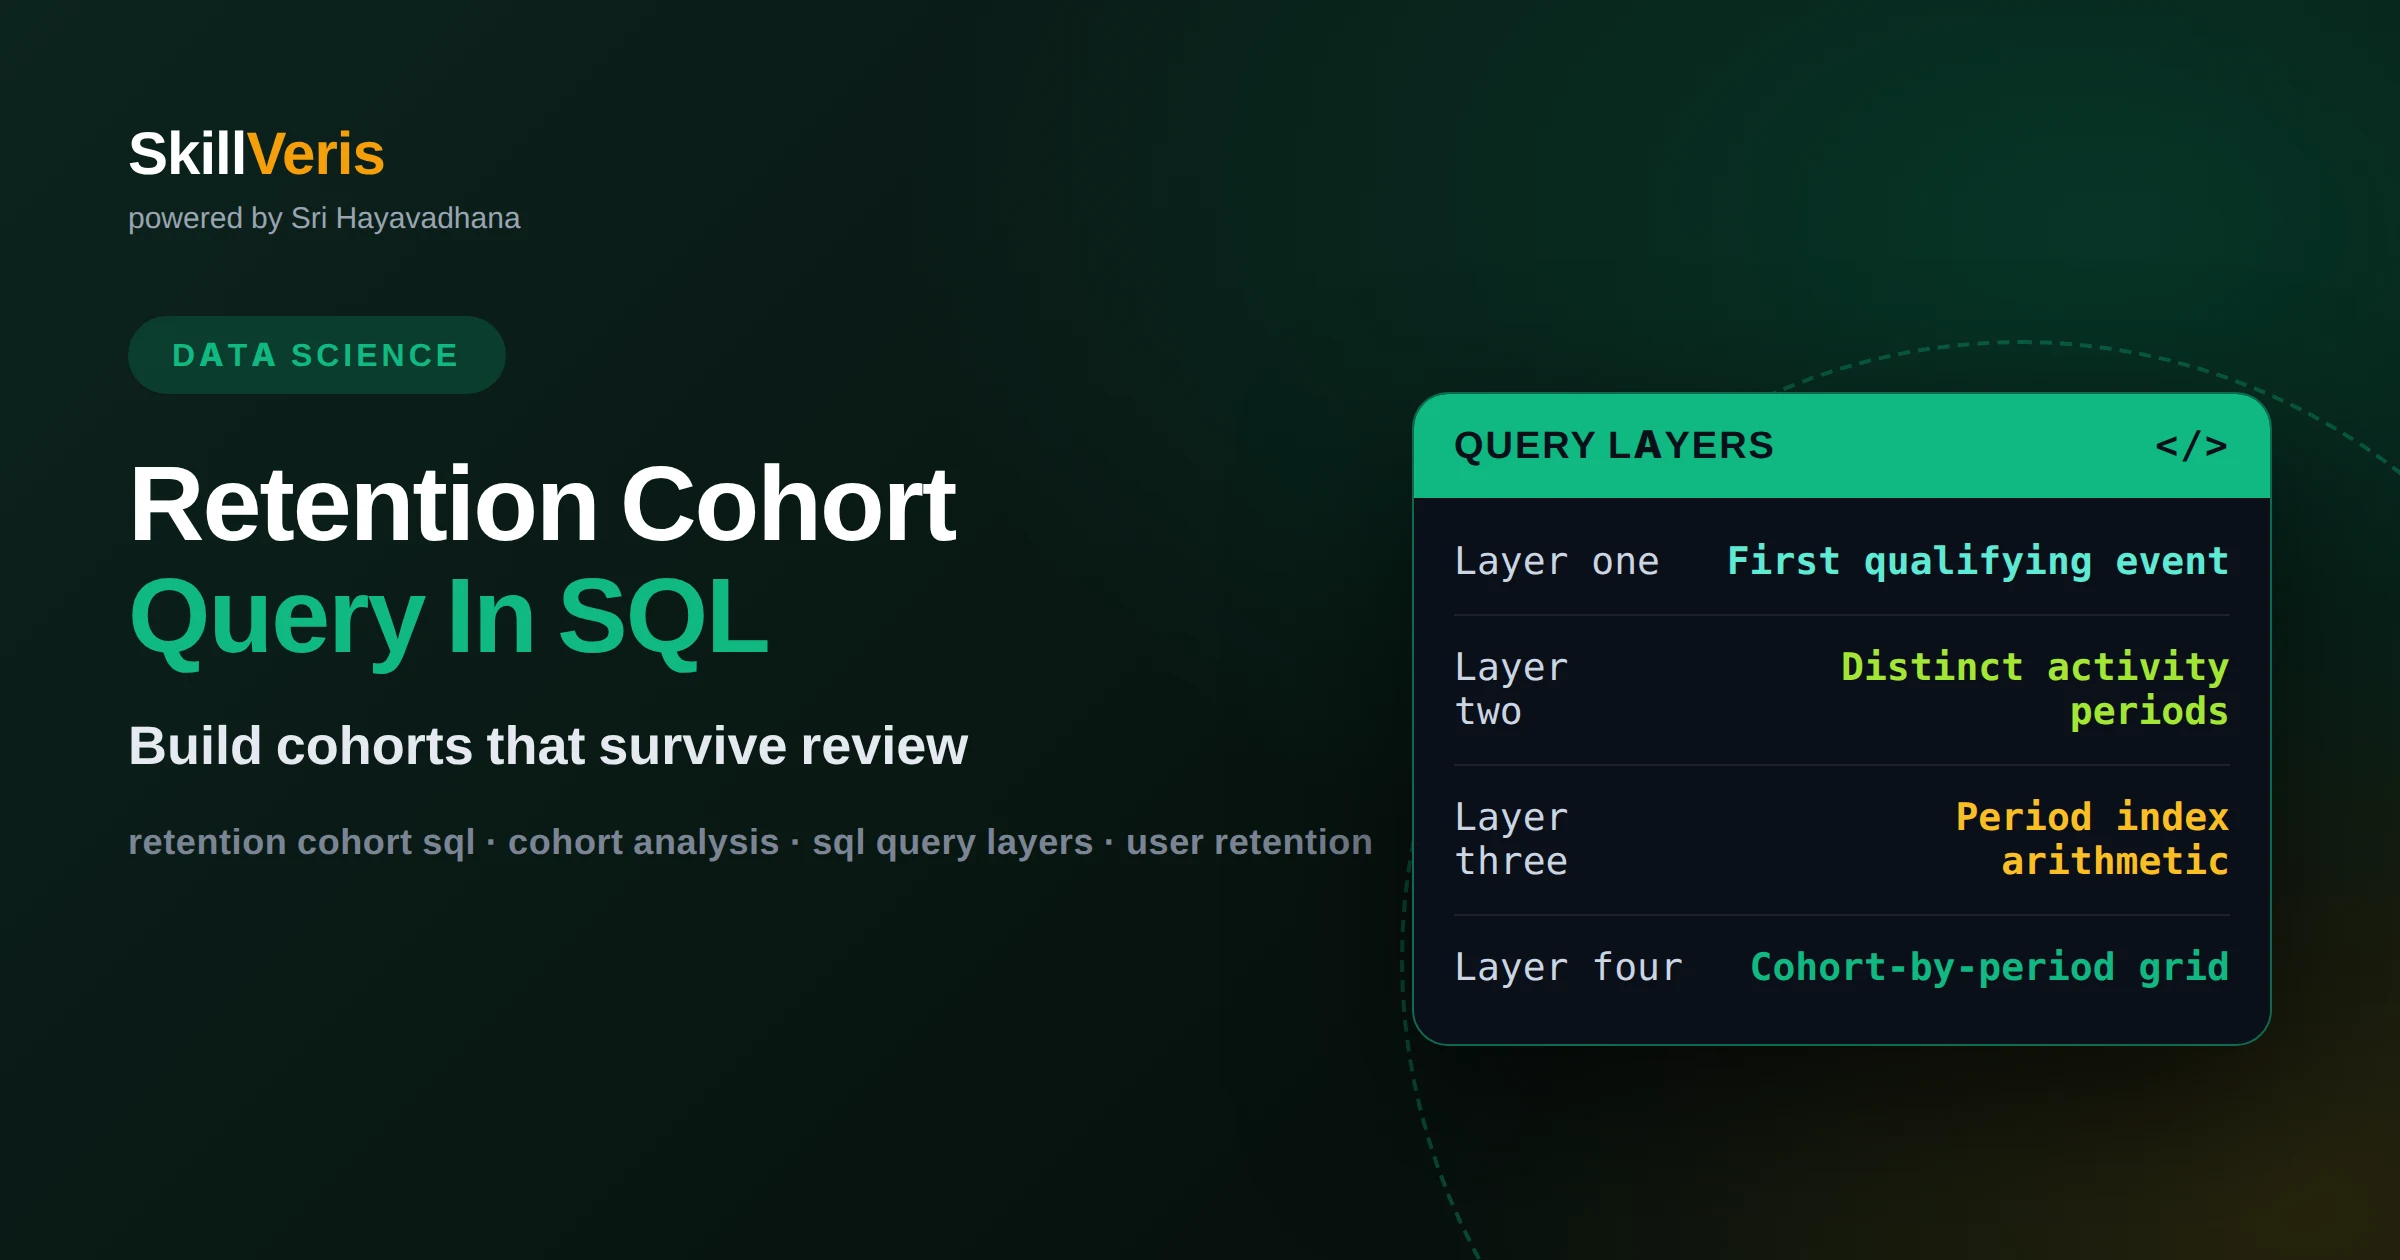
How to write a retention cohort query in SQL that survives review
Build a retention cohort in four layers: first event per user, a period index from date arithmetic, active-period facts, then the cohort-by-period grid. Most broken cohort charts come from partial trailing periods read as decline, time-zone boundaries misassigning users, and cohort dates recomputed on every run.
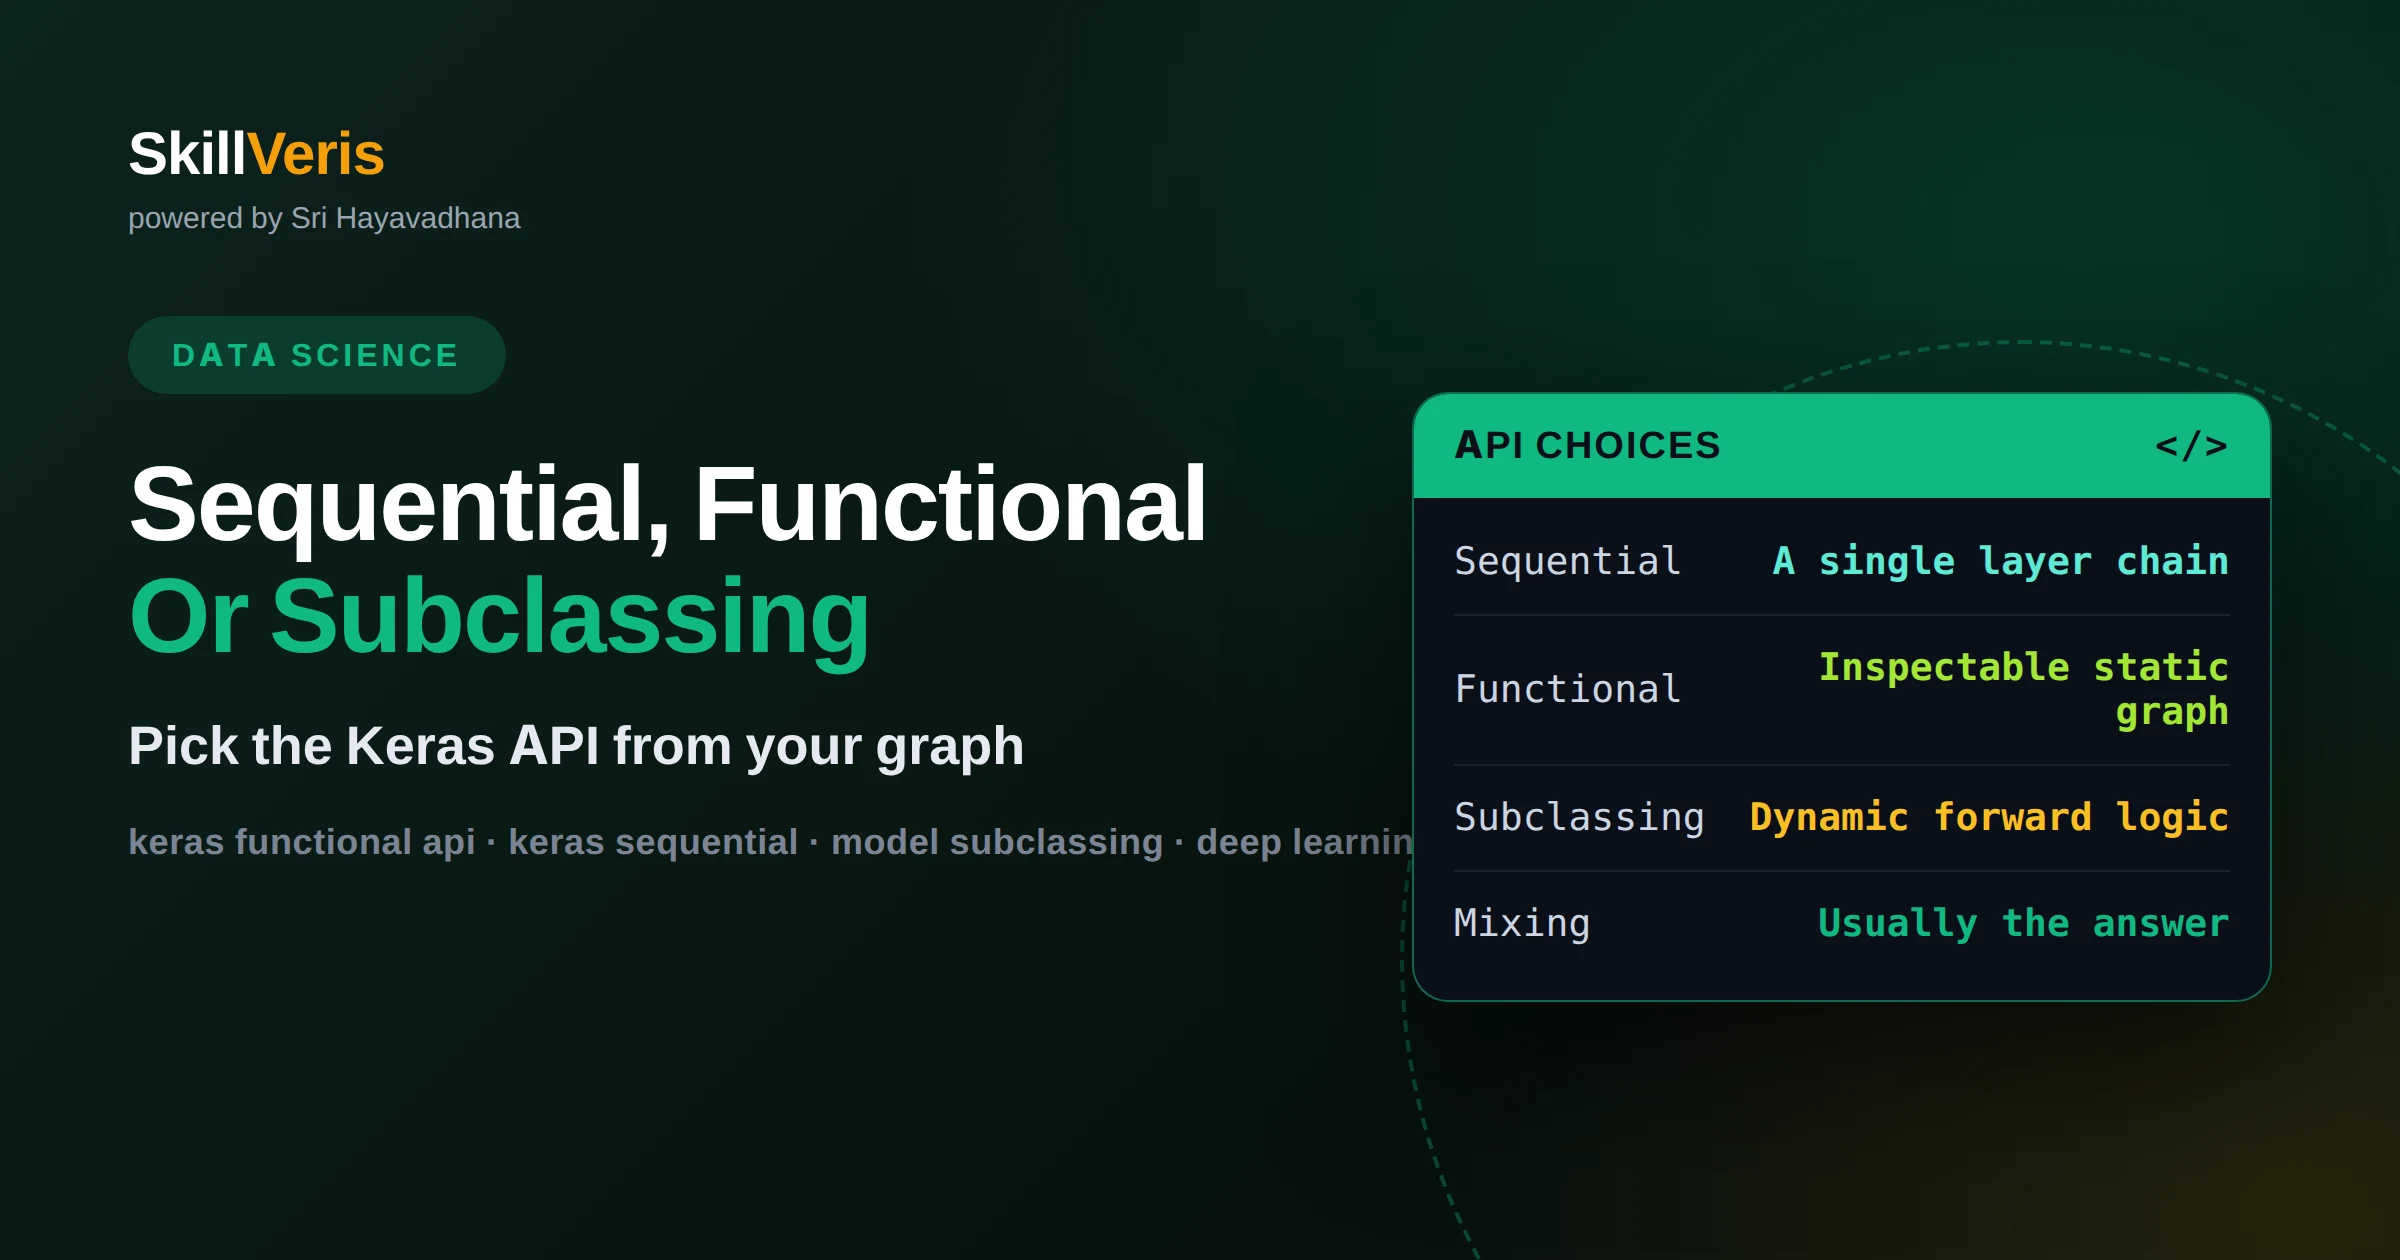
Keras Sequential vs Functional vs subclassing: which API to use
Pick the API from the shape of your model's graph, not from style preference. Sequential handles a single chain, Functional handles multiple inputs, shared layers and merges while staying inspectable and easy to save, and subclassing is for genuinely dynamic forward logic.
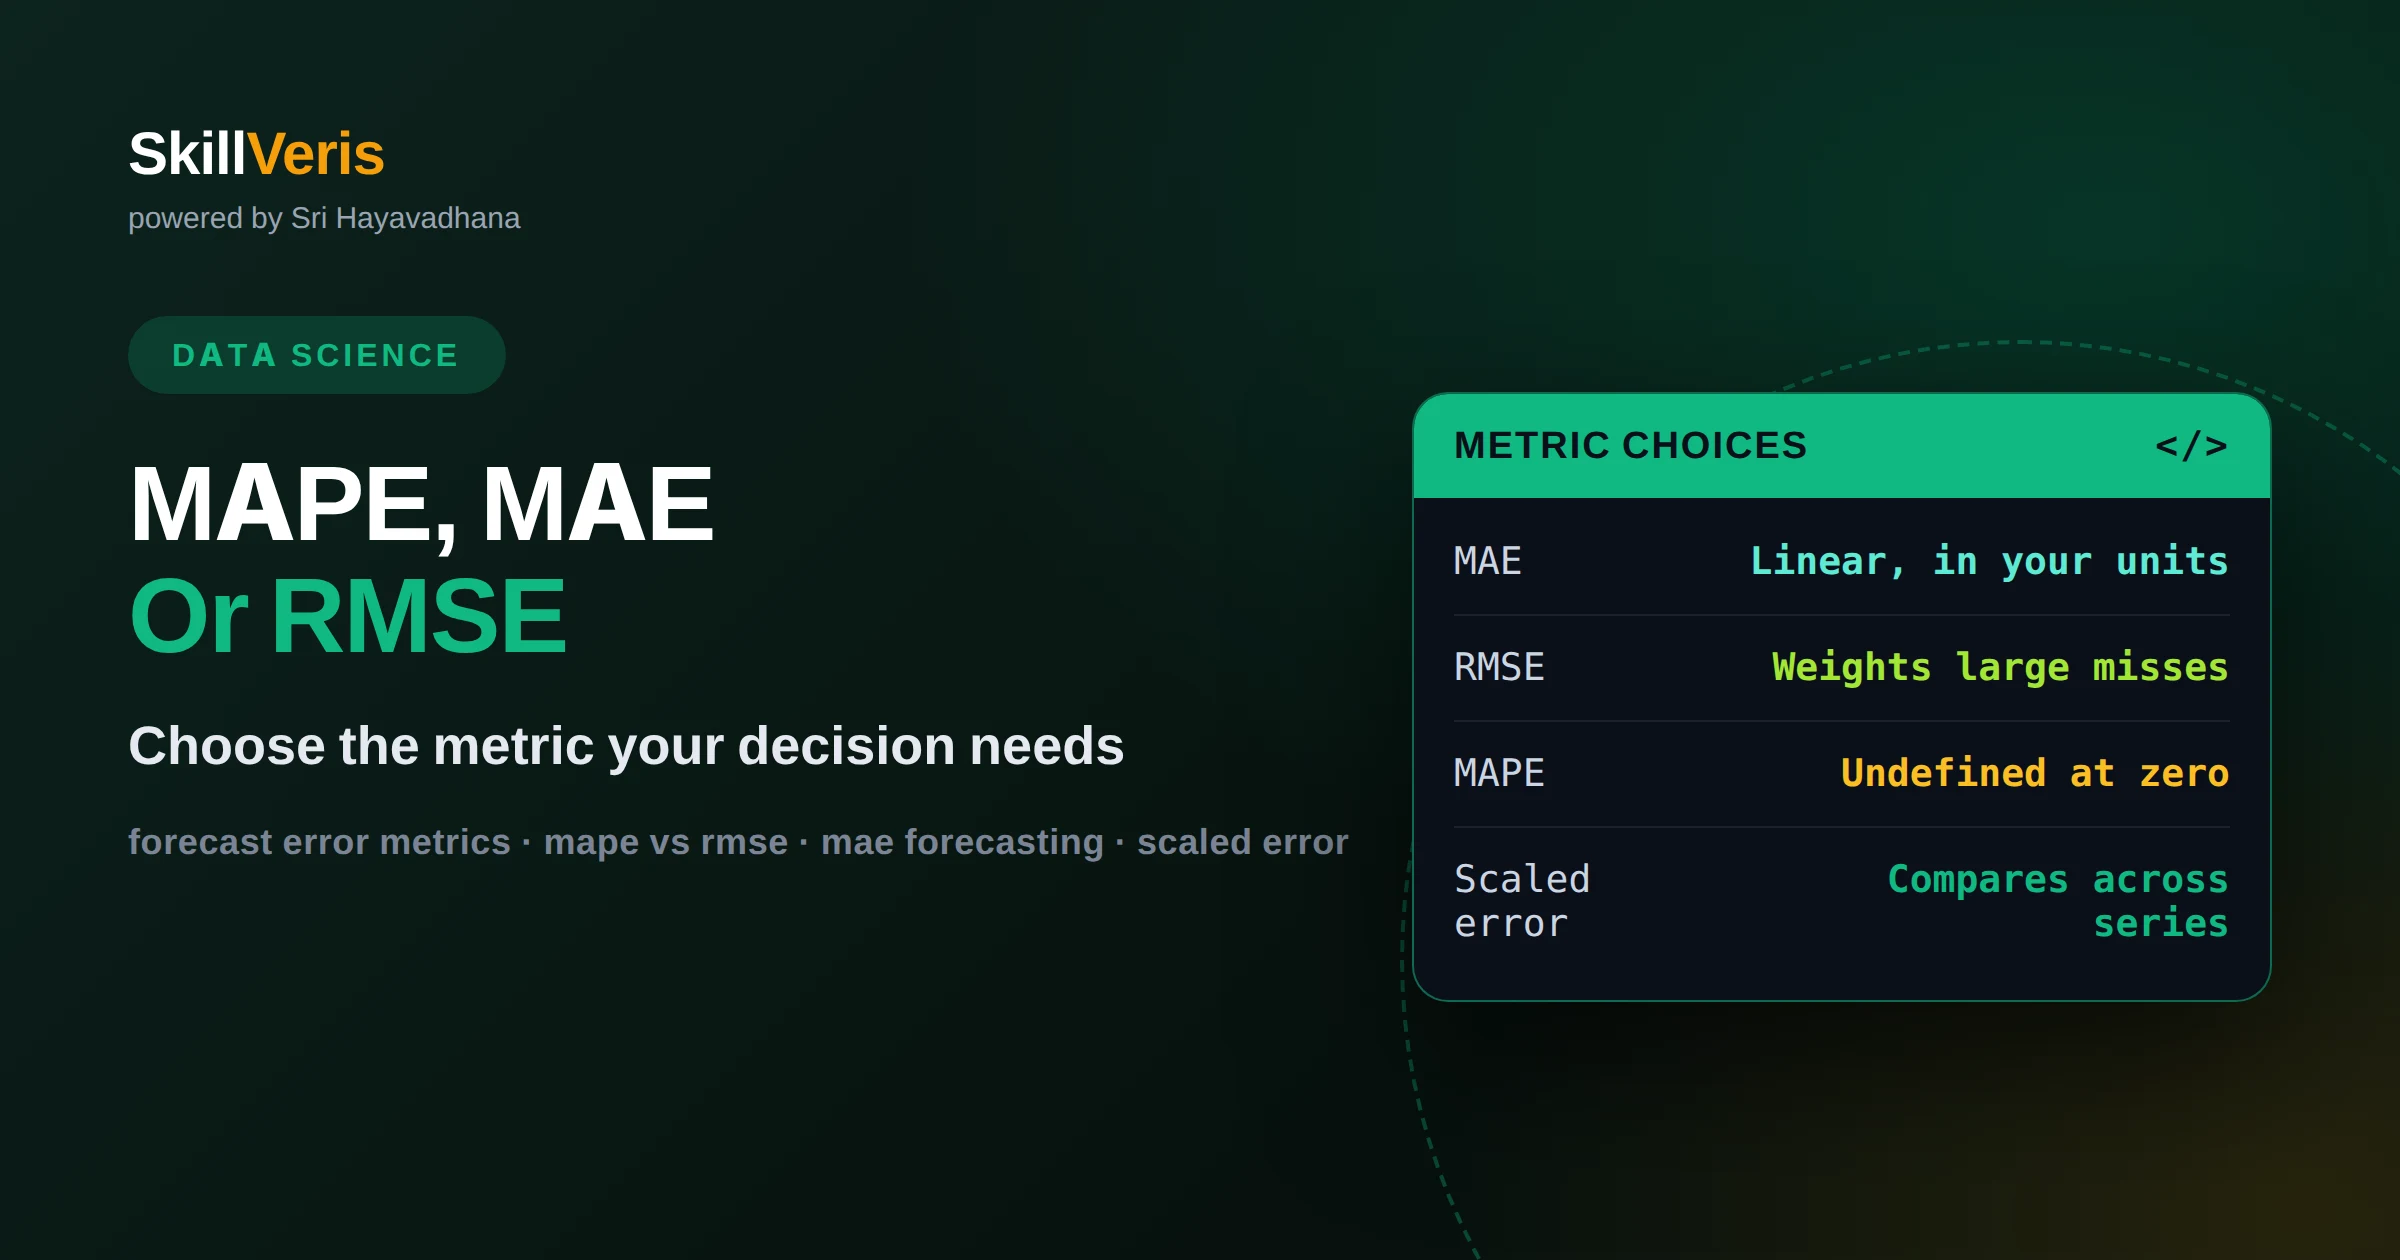
MAPE vs MAE vs RMSE: choosing a forecast error metric that survives your data
Each metric encodes a different assumption about what an error costs. MAPE is undefined at zero and penalises over-forecasting asymmetrically, RMSE weights large misses heavily and keeps your units, MAE treats all errors linearly, and scaled errors let you compare across series of different magnitudes. Choose the primary metric from the decision it feeds.
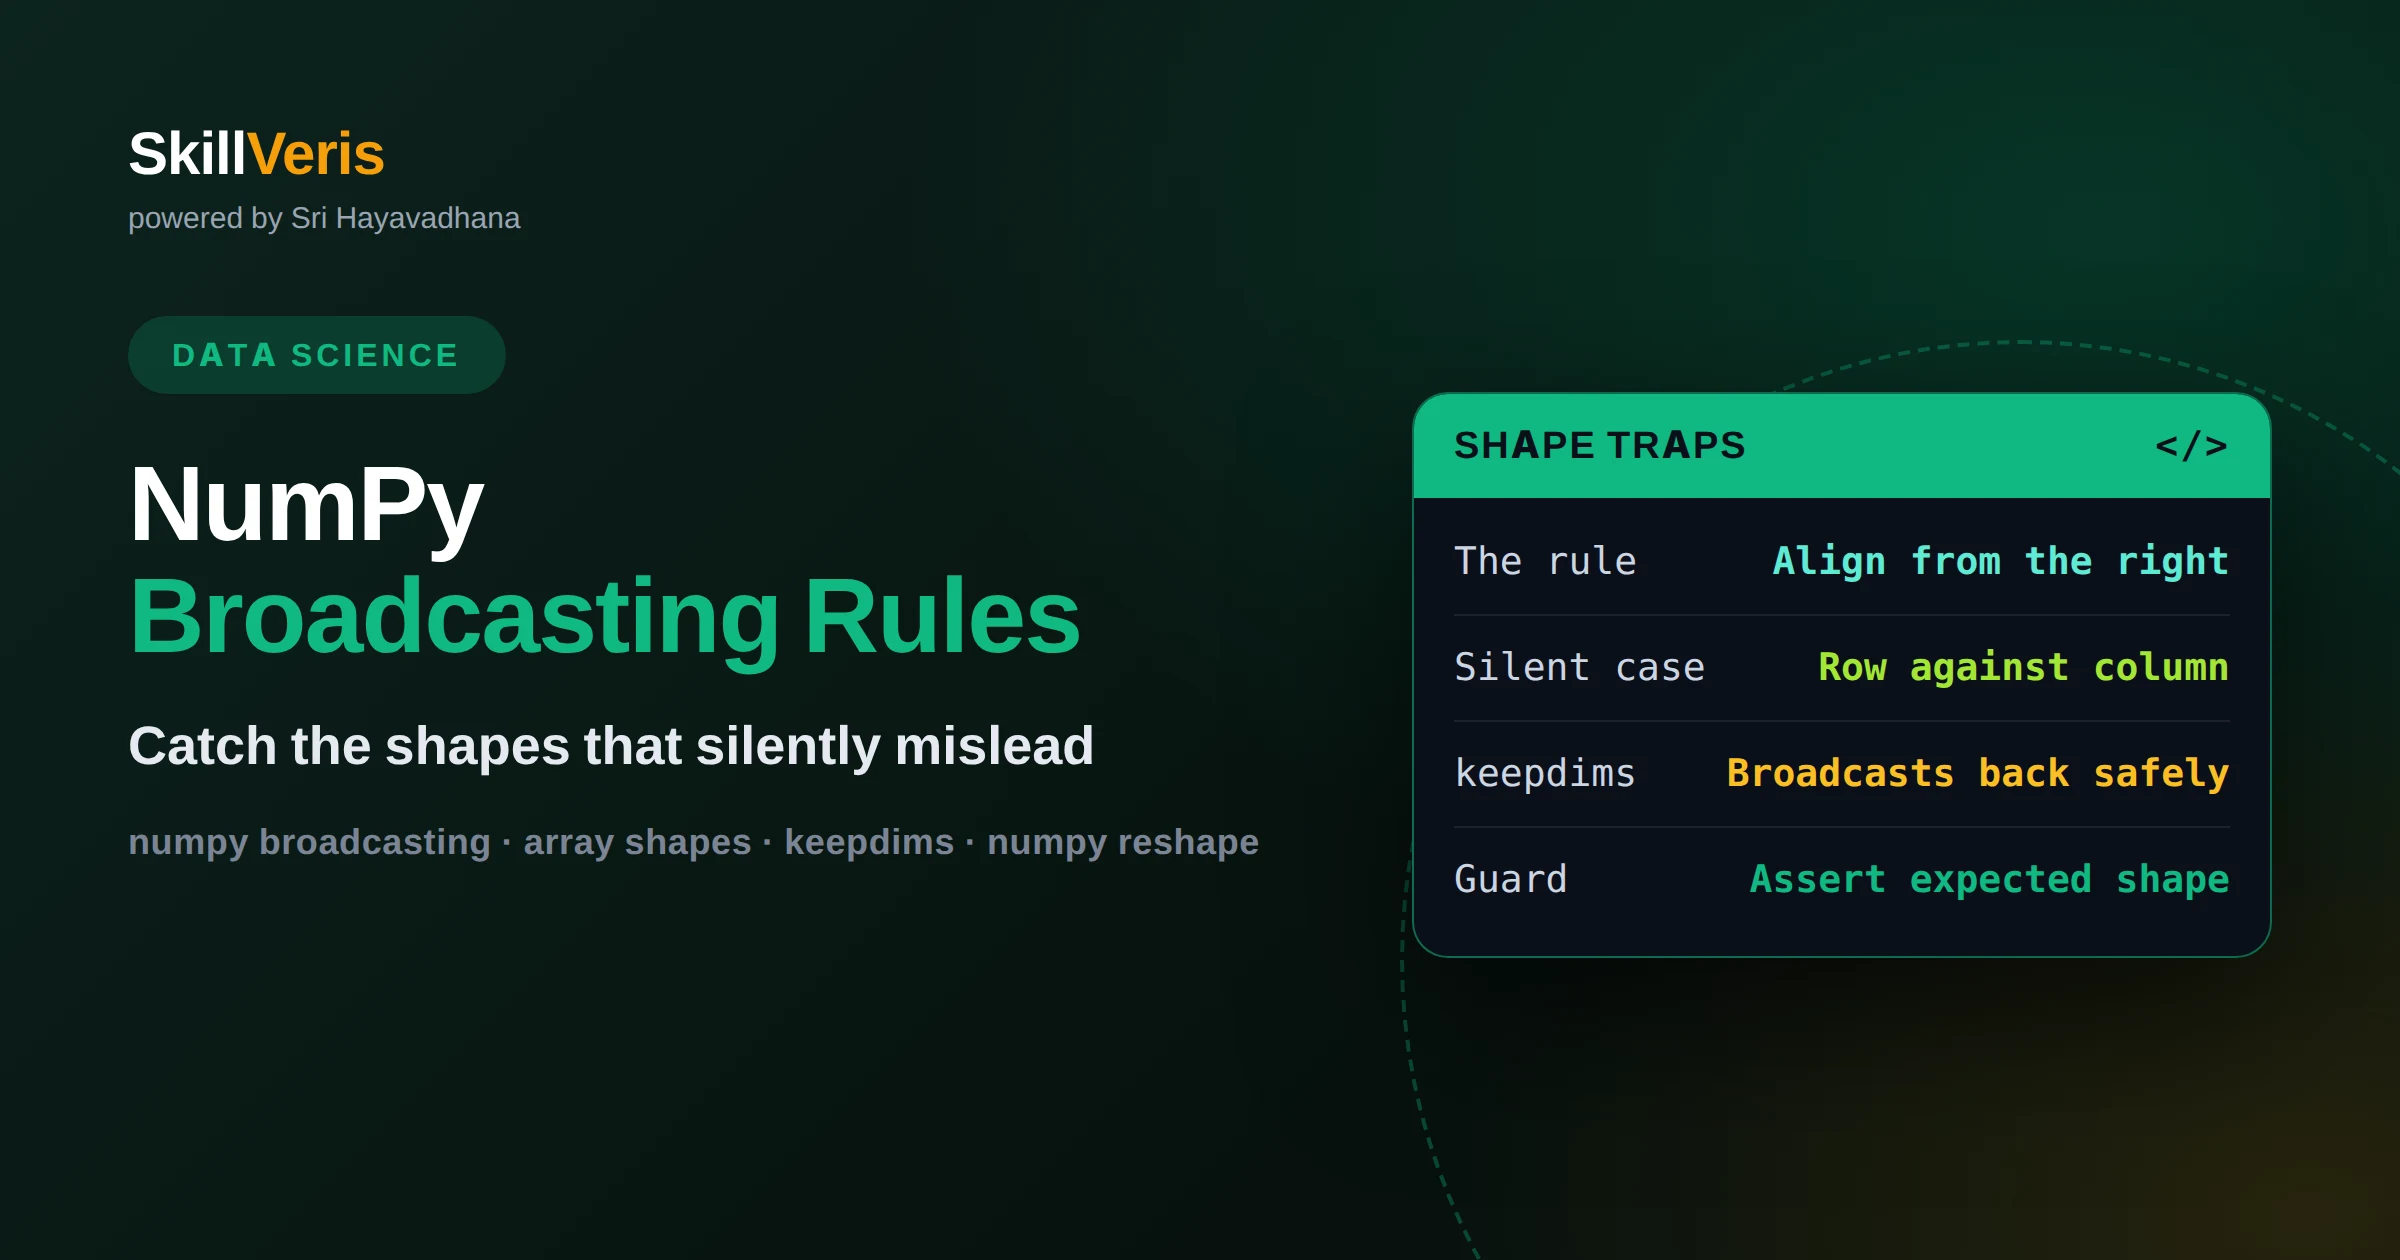
NumPy broadcasting: the rules, and the shapes that silently do the wrong thing
Broadcasting aligns array shapes from the trailing axis, stretching any axis of length one. The rule is short; the danger is the case it does not reject — a row vector against a column vector produces a full matrix where you wanted elementwise arithmetic, and every downstream number is wrong without an error.
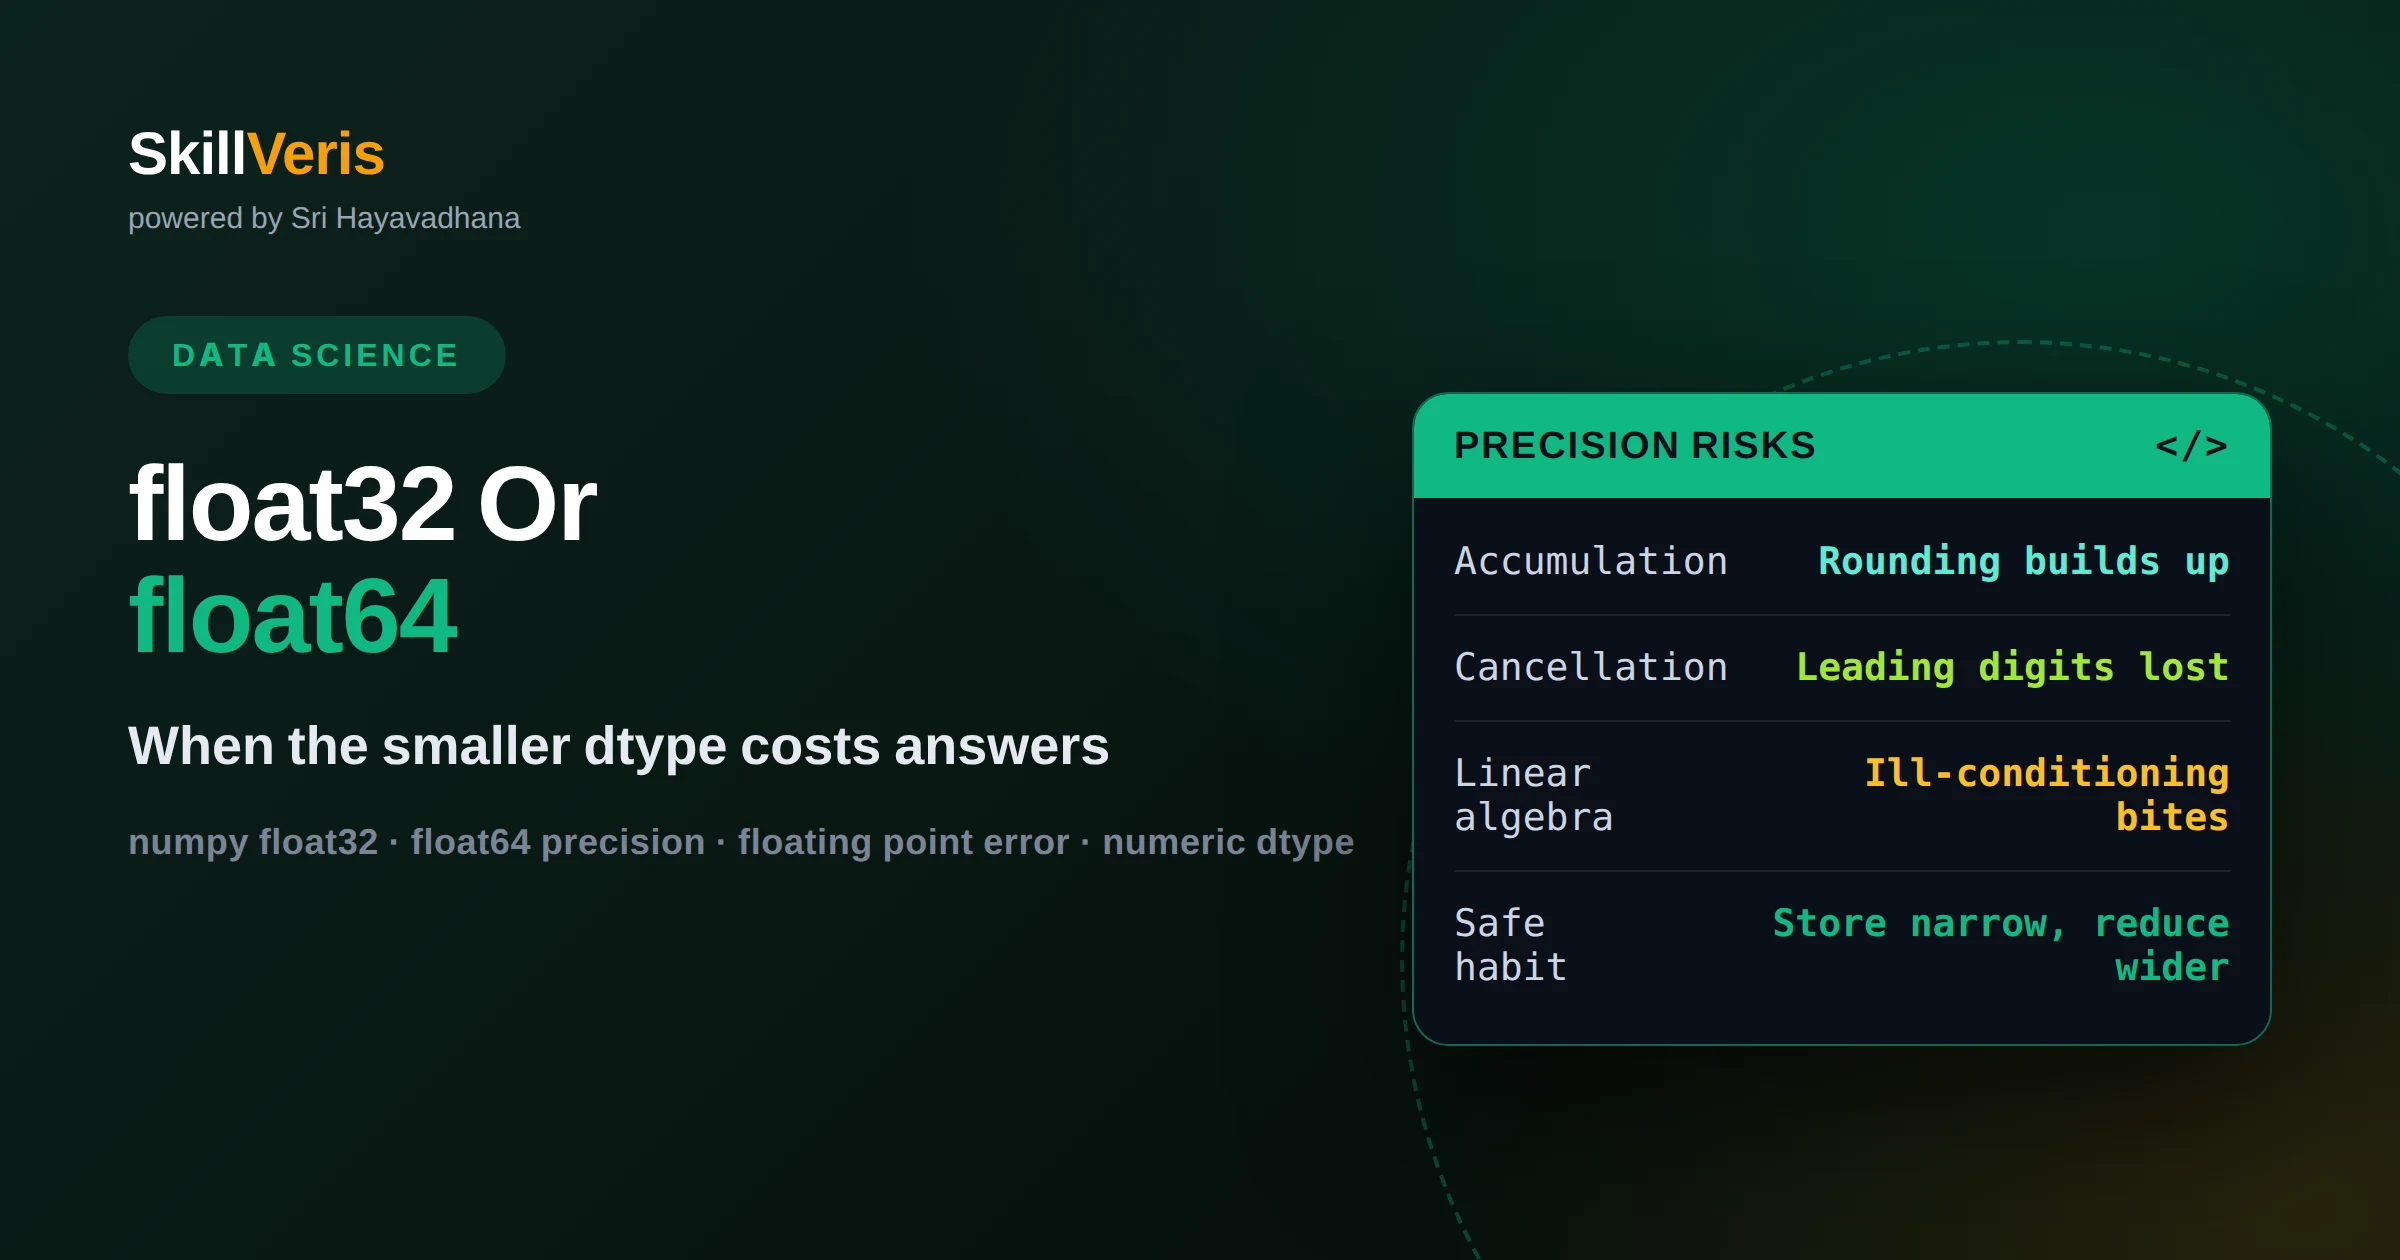
float32 vs float64 in NumPy: when the smaller dtype costs you an answer
The choice is about the operation, not the storage. Long accumulations, differences of large near-equal numbers and matrix inversion lose meaningful precision at the narrower width, while storage, image data and model inputs generally do not. The safe habit is to store narrow and reduce wider.
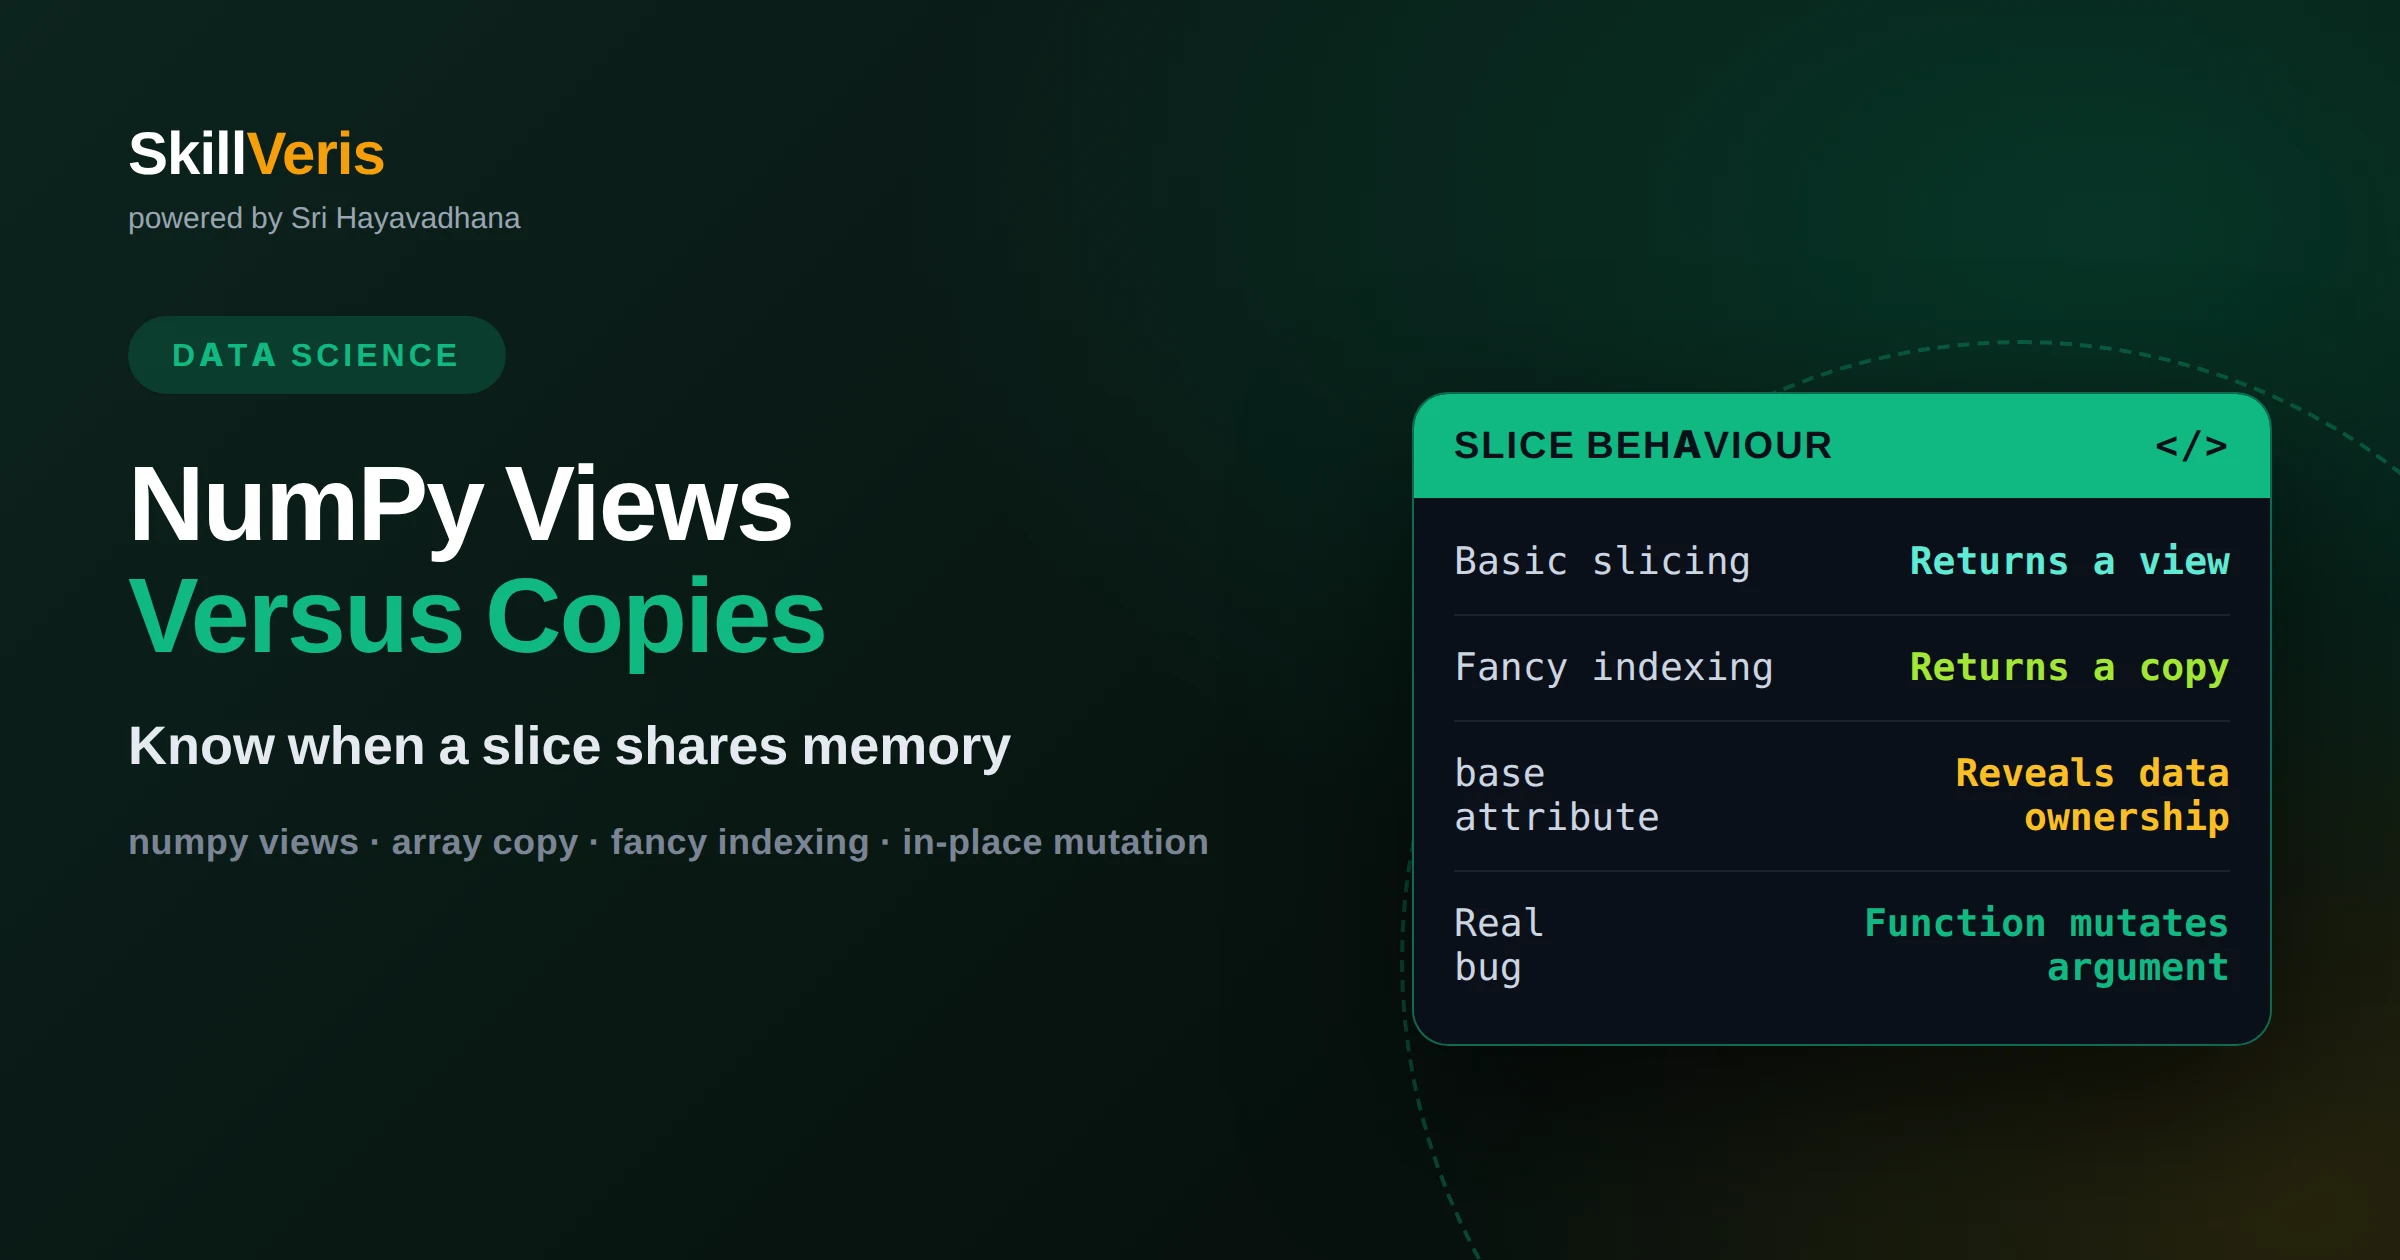
NumPy views vs copies: when a slice shares memory and when it does not
Basic slicing returns a view that shares memory with the original array; fancy indexing and boolean masks return copies. Rather than trusting recall, verify with the base attribute or a shared-memory check. The bug worth preventing is a function that mutates the array it was handed.
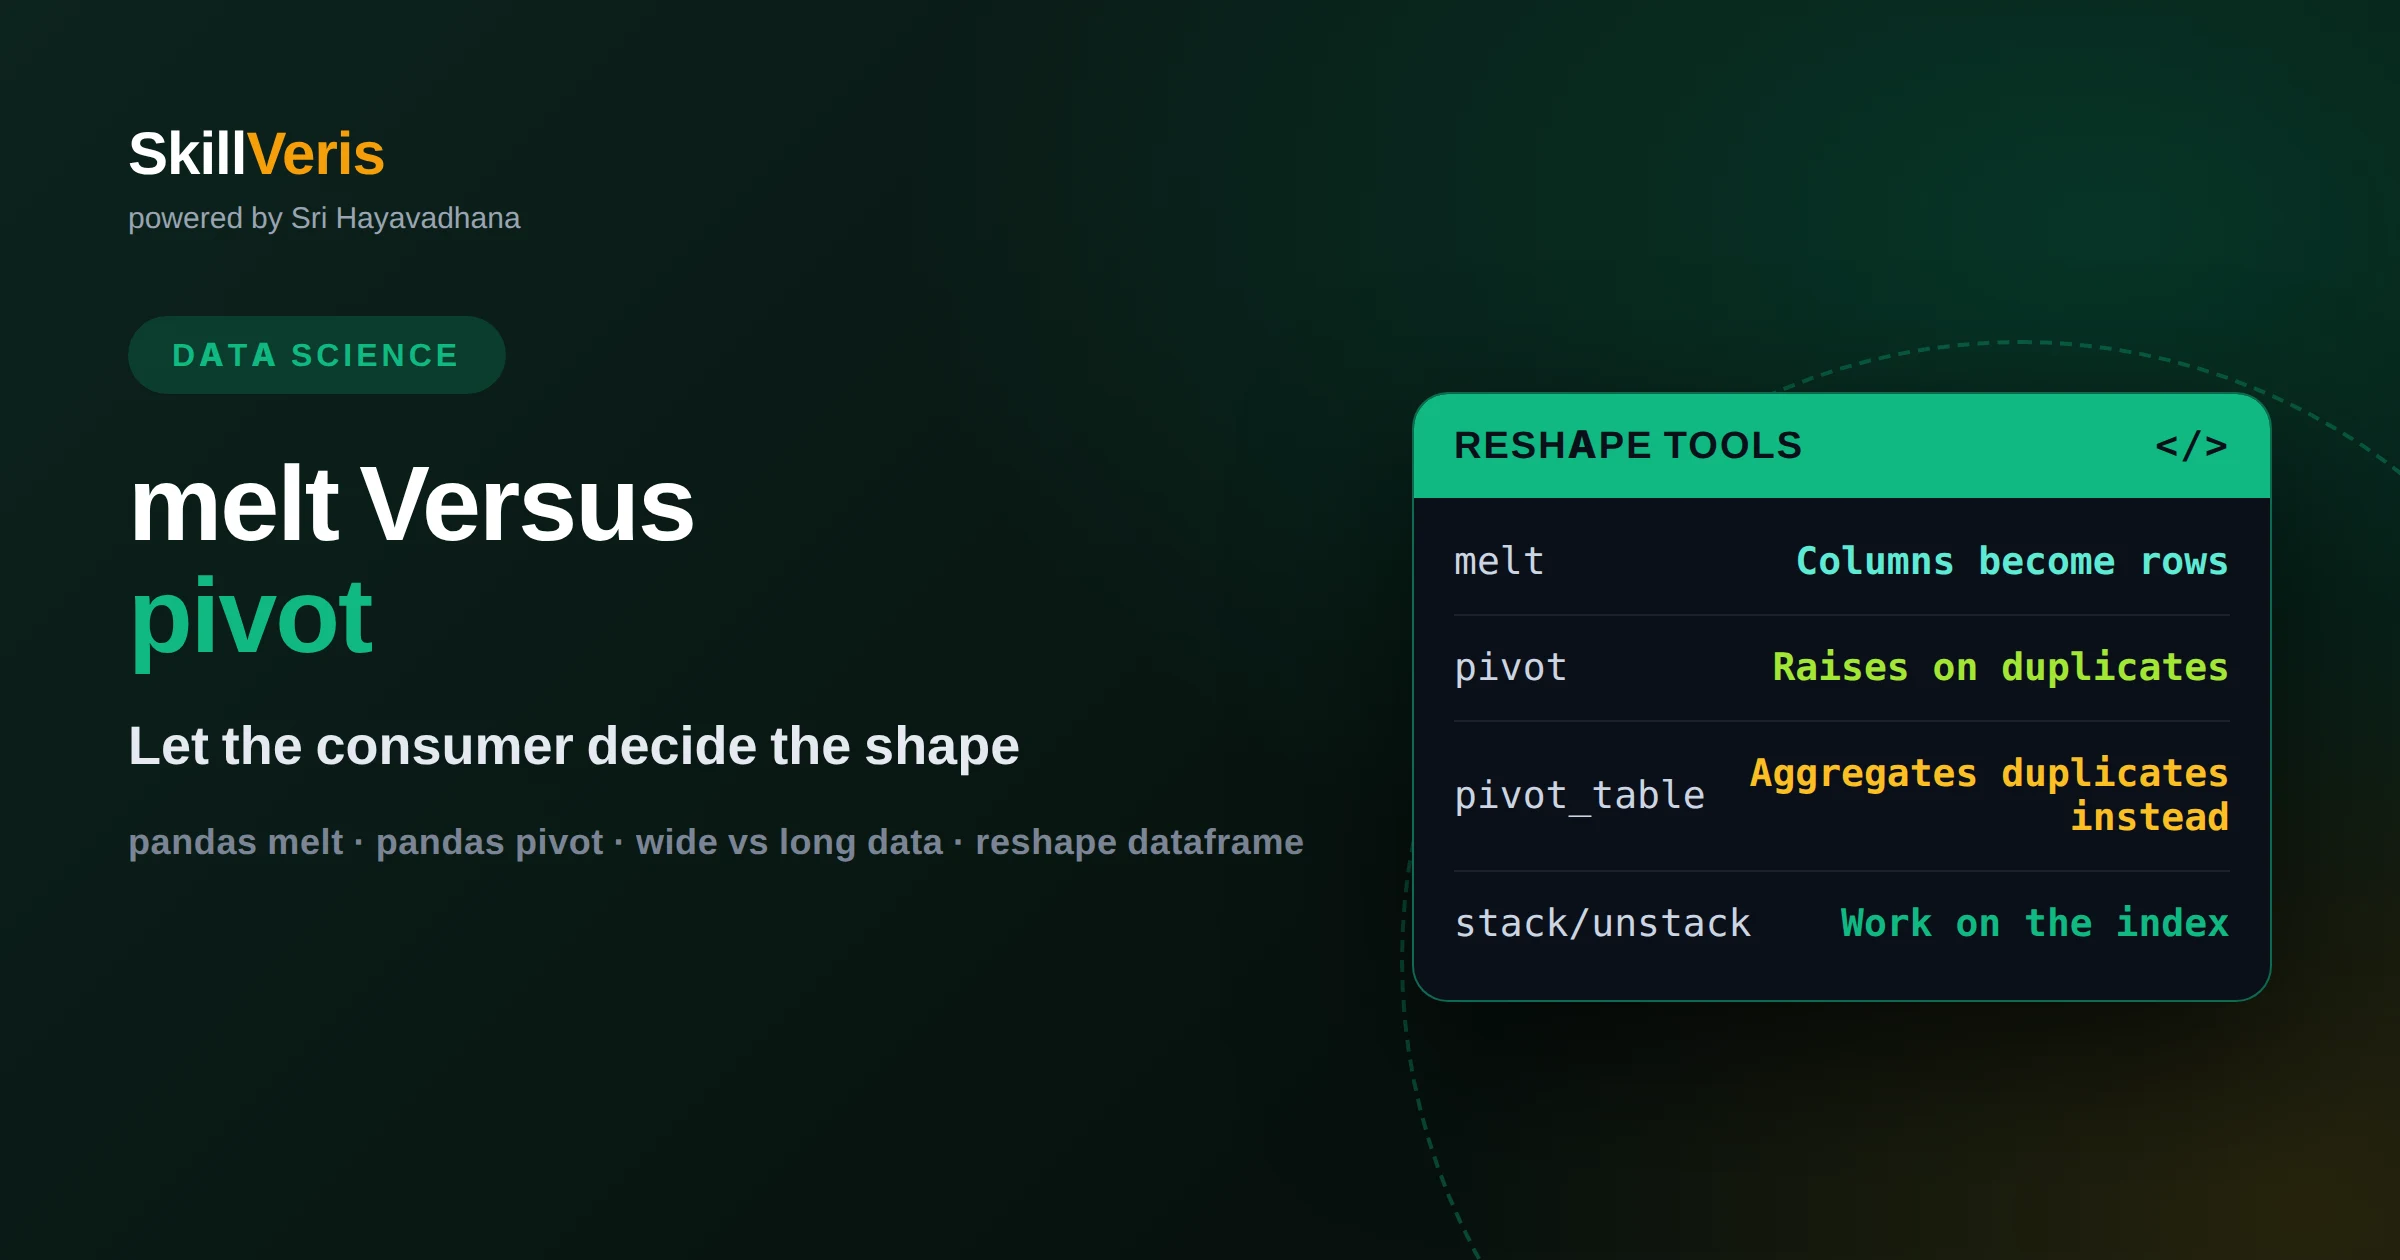
melt vs pivot in pandas: choosing wide or long for the job ahead
Choose the shape by what consumes the table, not by what looks tidier. Long form suits grouping, plotting and storage; wide form suits human reading and matrix-style model inputs. melt and stack go long, pivot and pivot_table go wide, and they differ mainly in what they do with duplicate pairs.
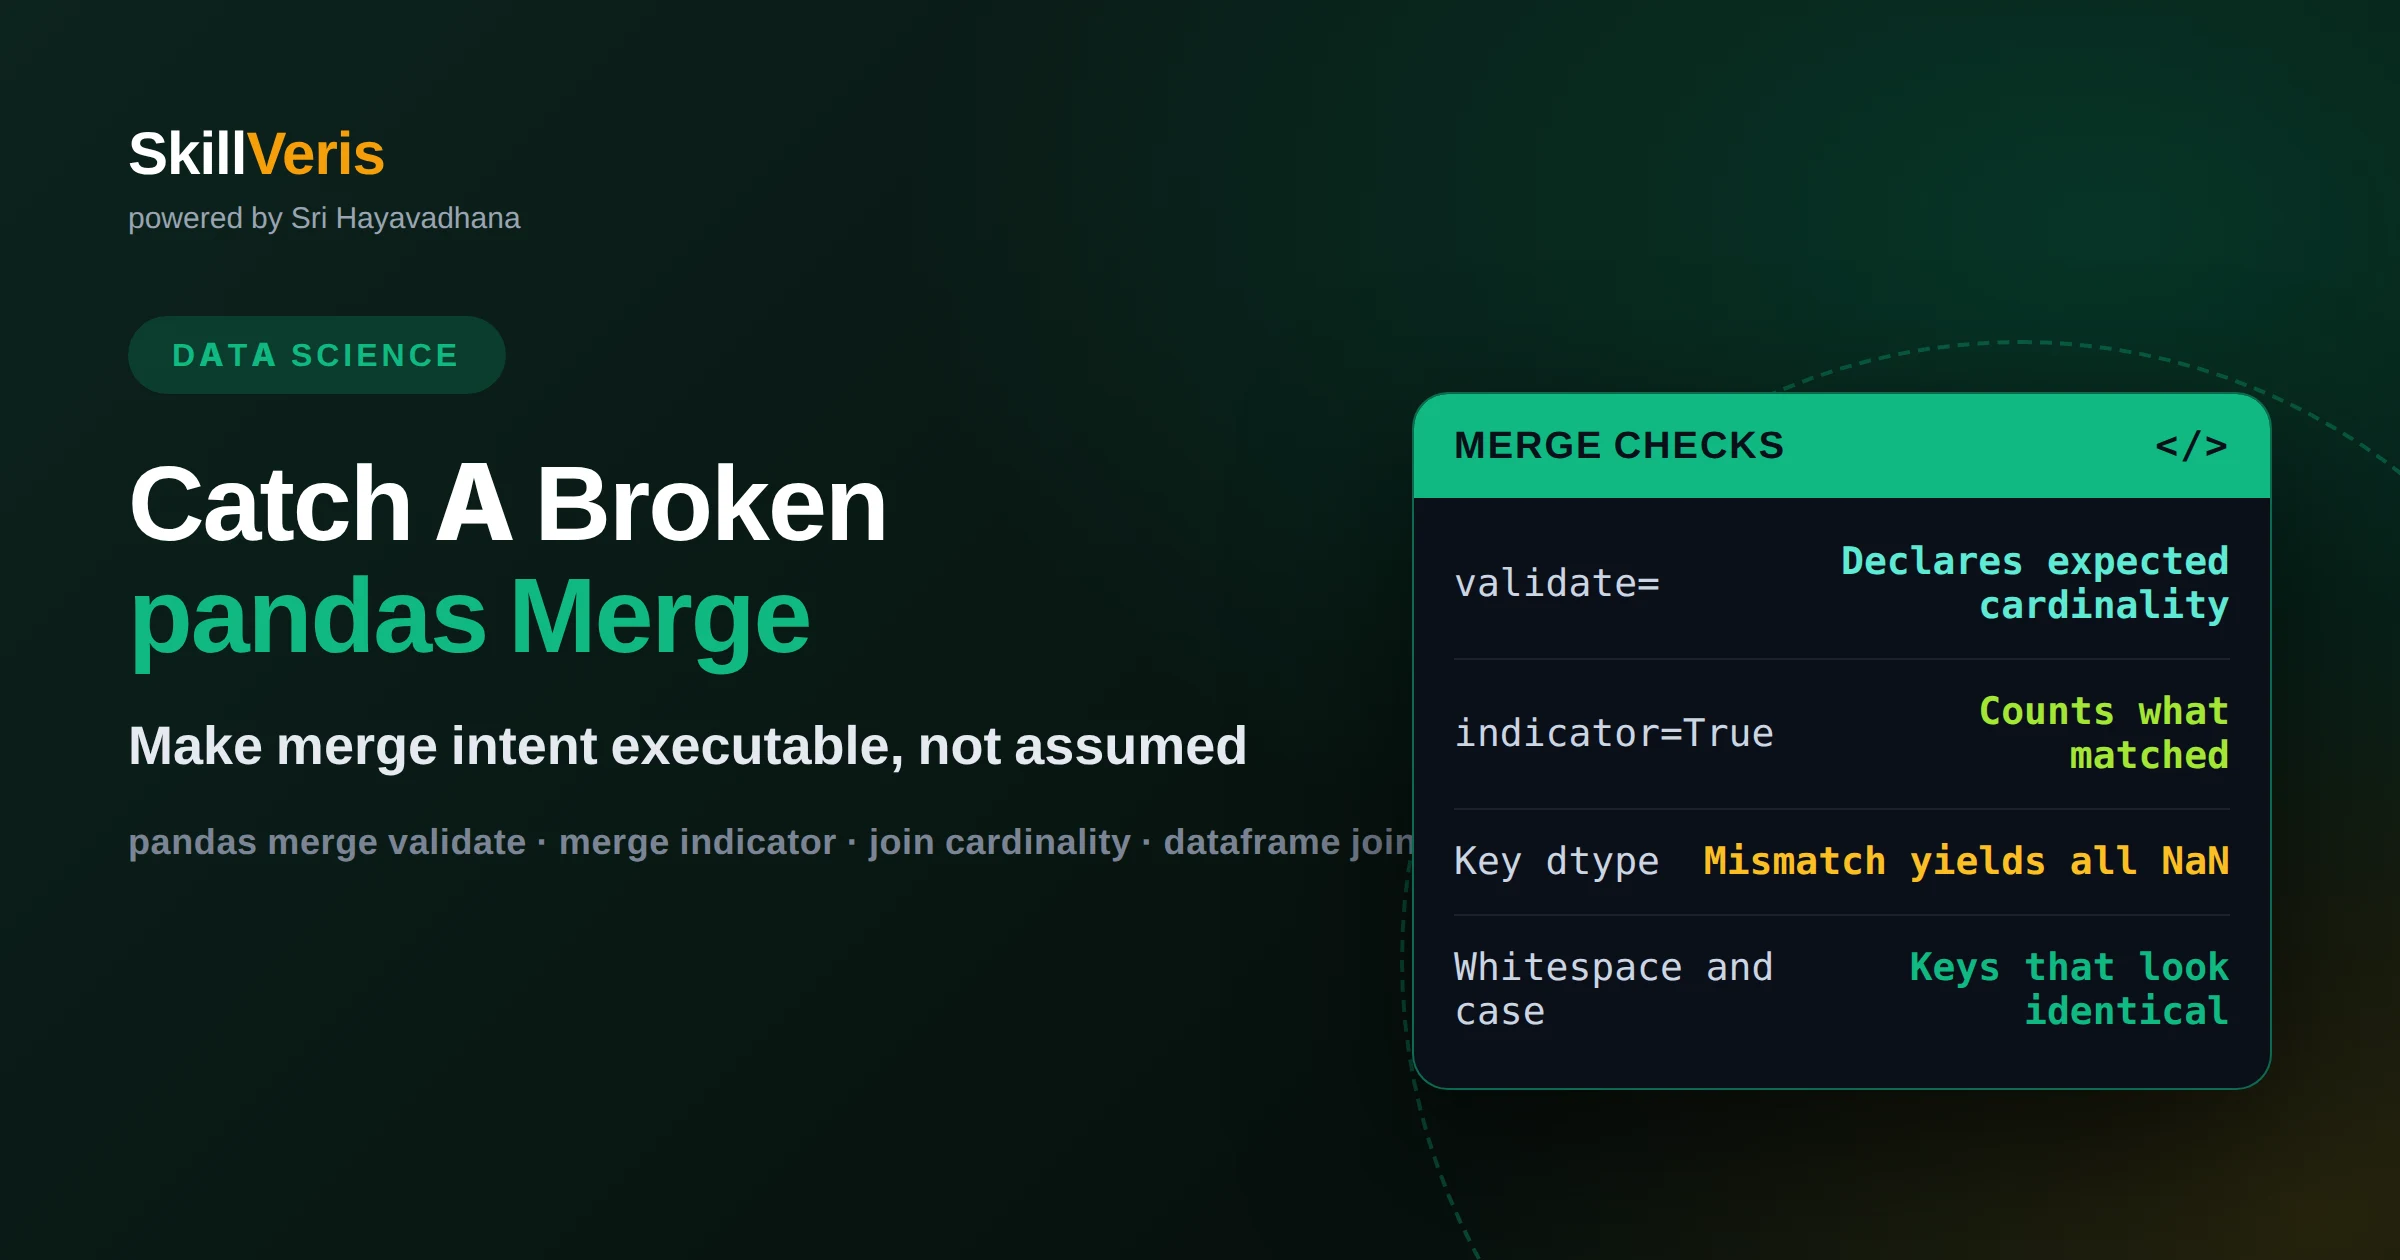
How to catch a broken pandas merge with validate and indicator
A pandas merge will not warn you when it multiplies rows or matches nothing at all. Passing validate= to declare the expected cardinality turns a silent many-to-many explosion into an exception, and indicator=True lets you count unmatched rows on each side before you trust the result.
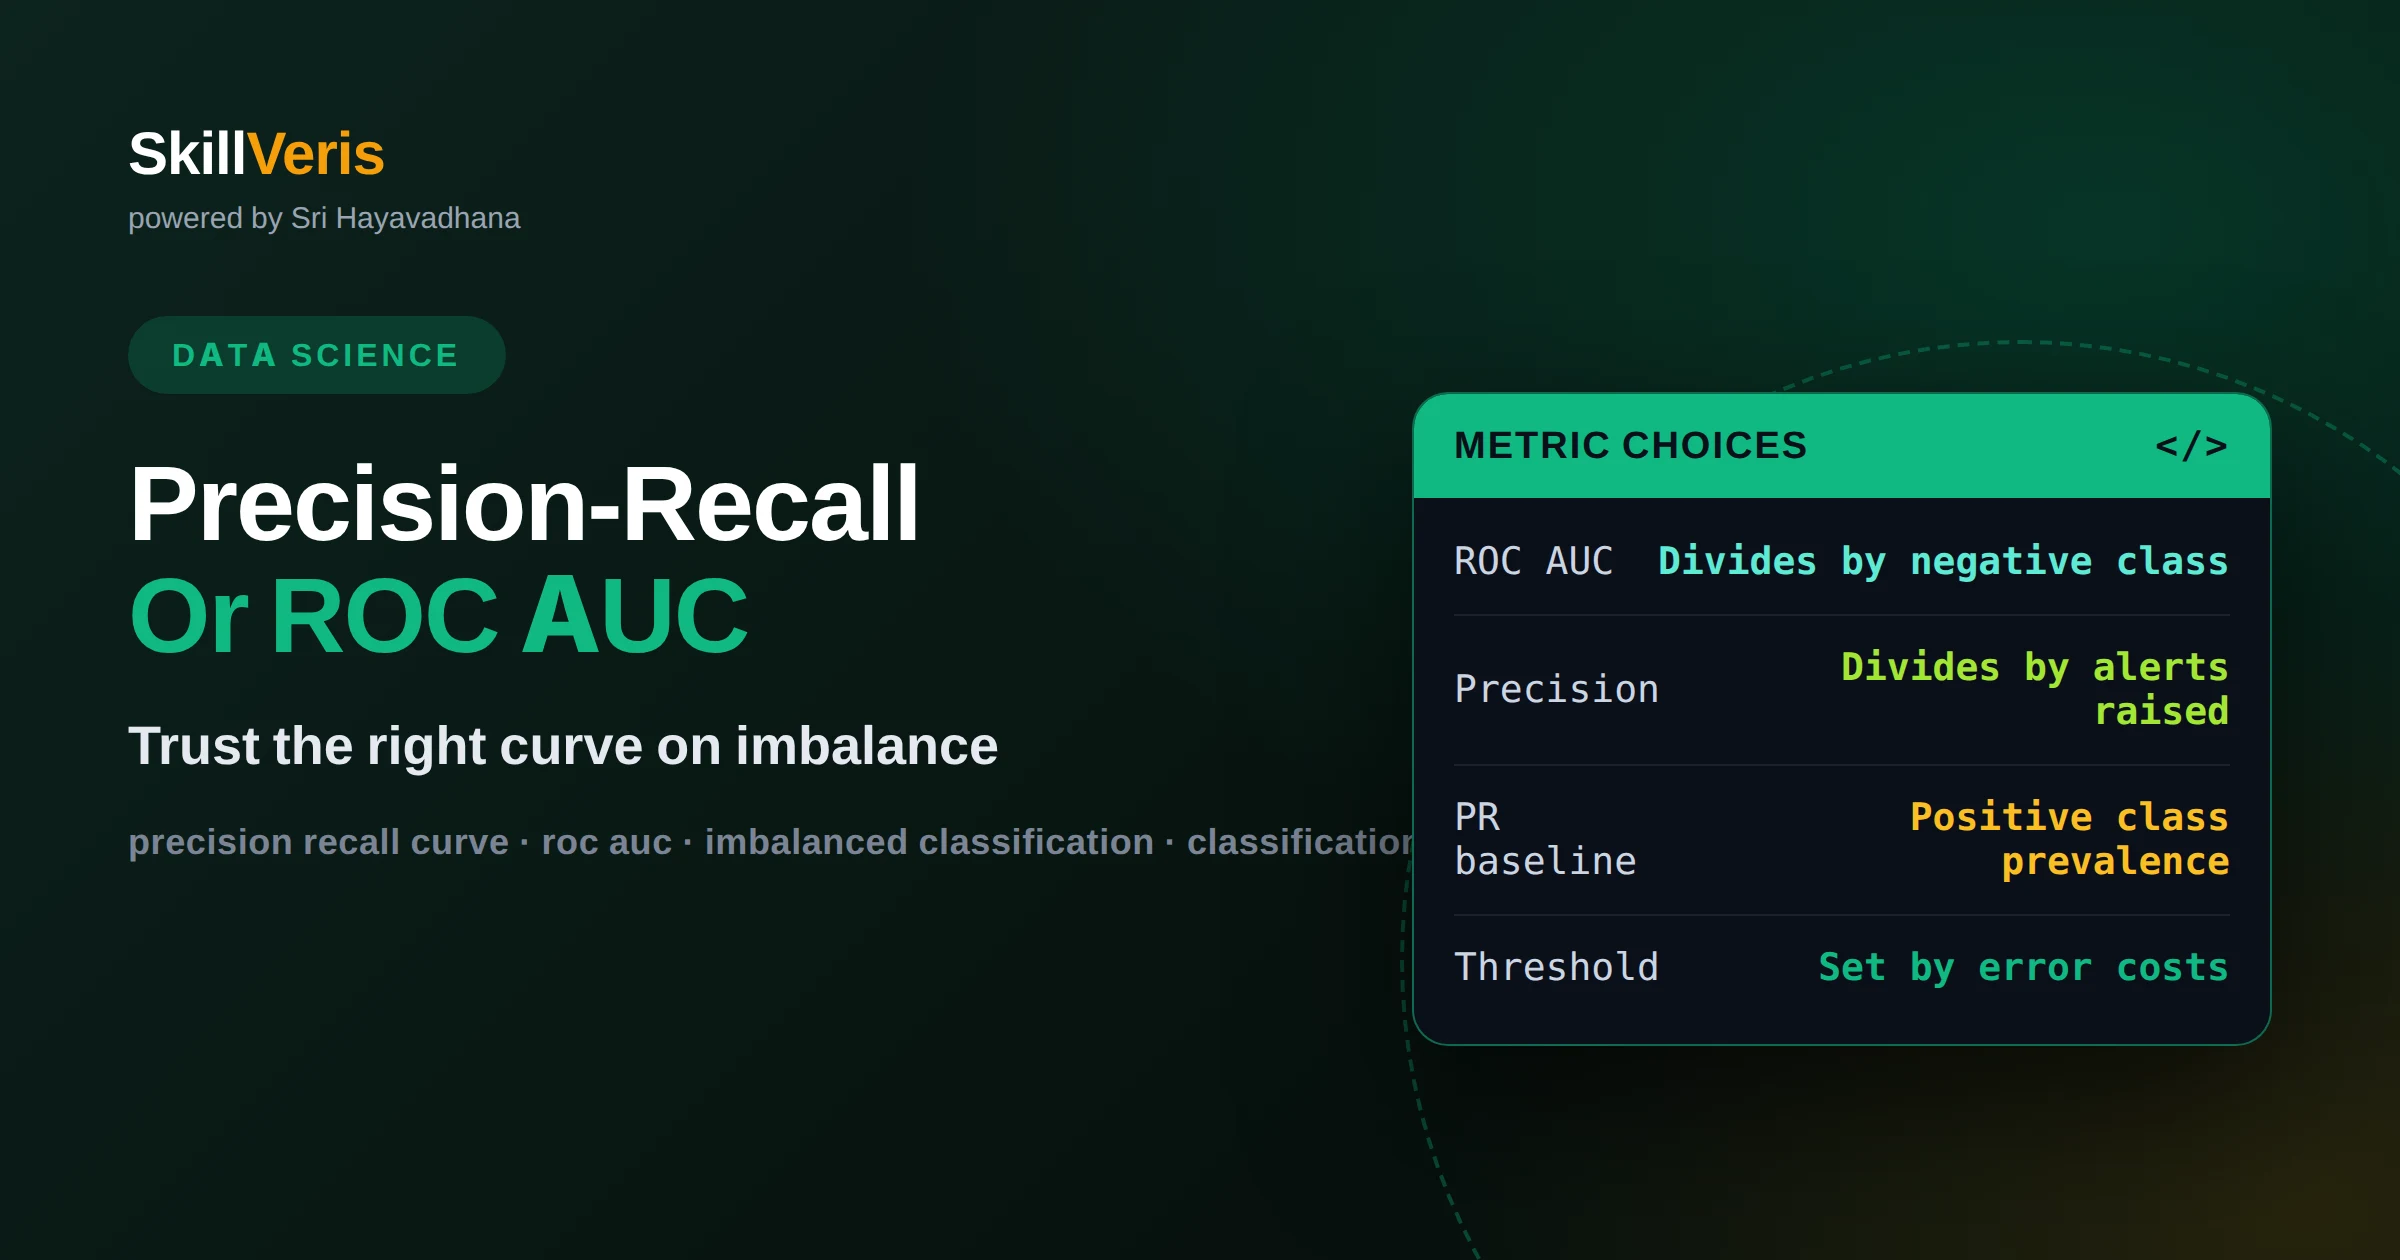
Precision-recall vs ROC AUC: which curve to trust on imbalanced data
On a rare positive class, ROC AUC stays comfortably high because the false positive rate is diluted by an enormous negative class, while the precision-recall curve tracks what a rare-event user actually experiences. Choose the threshold from error costs and report the metric there.
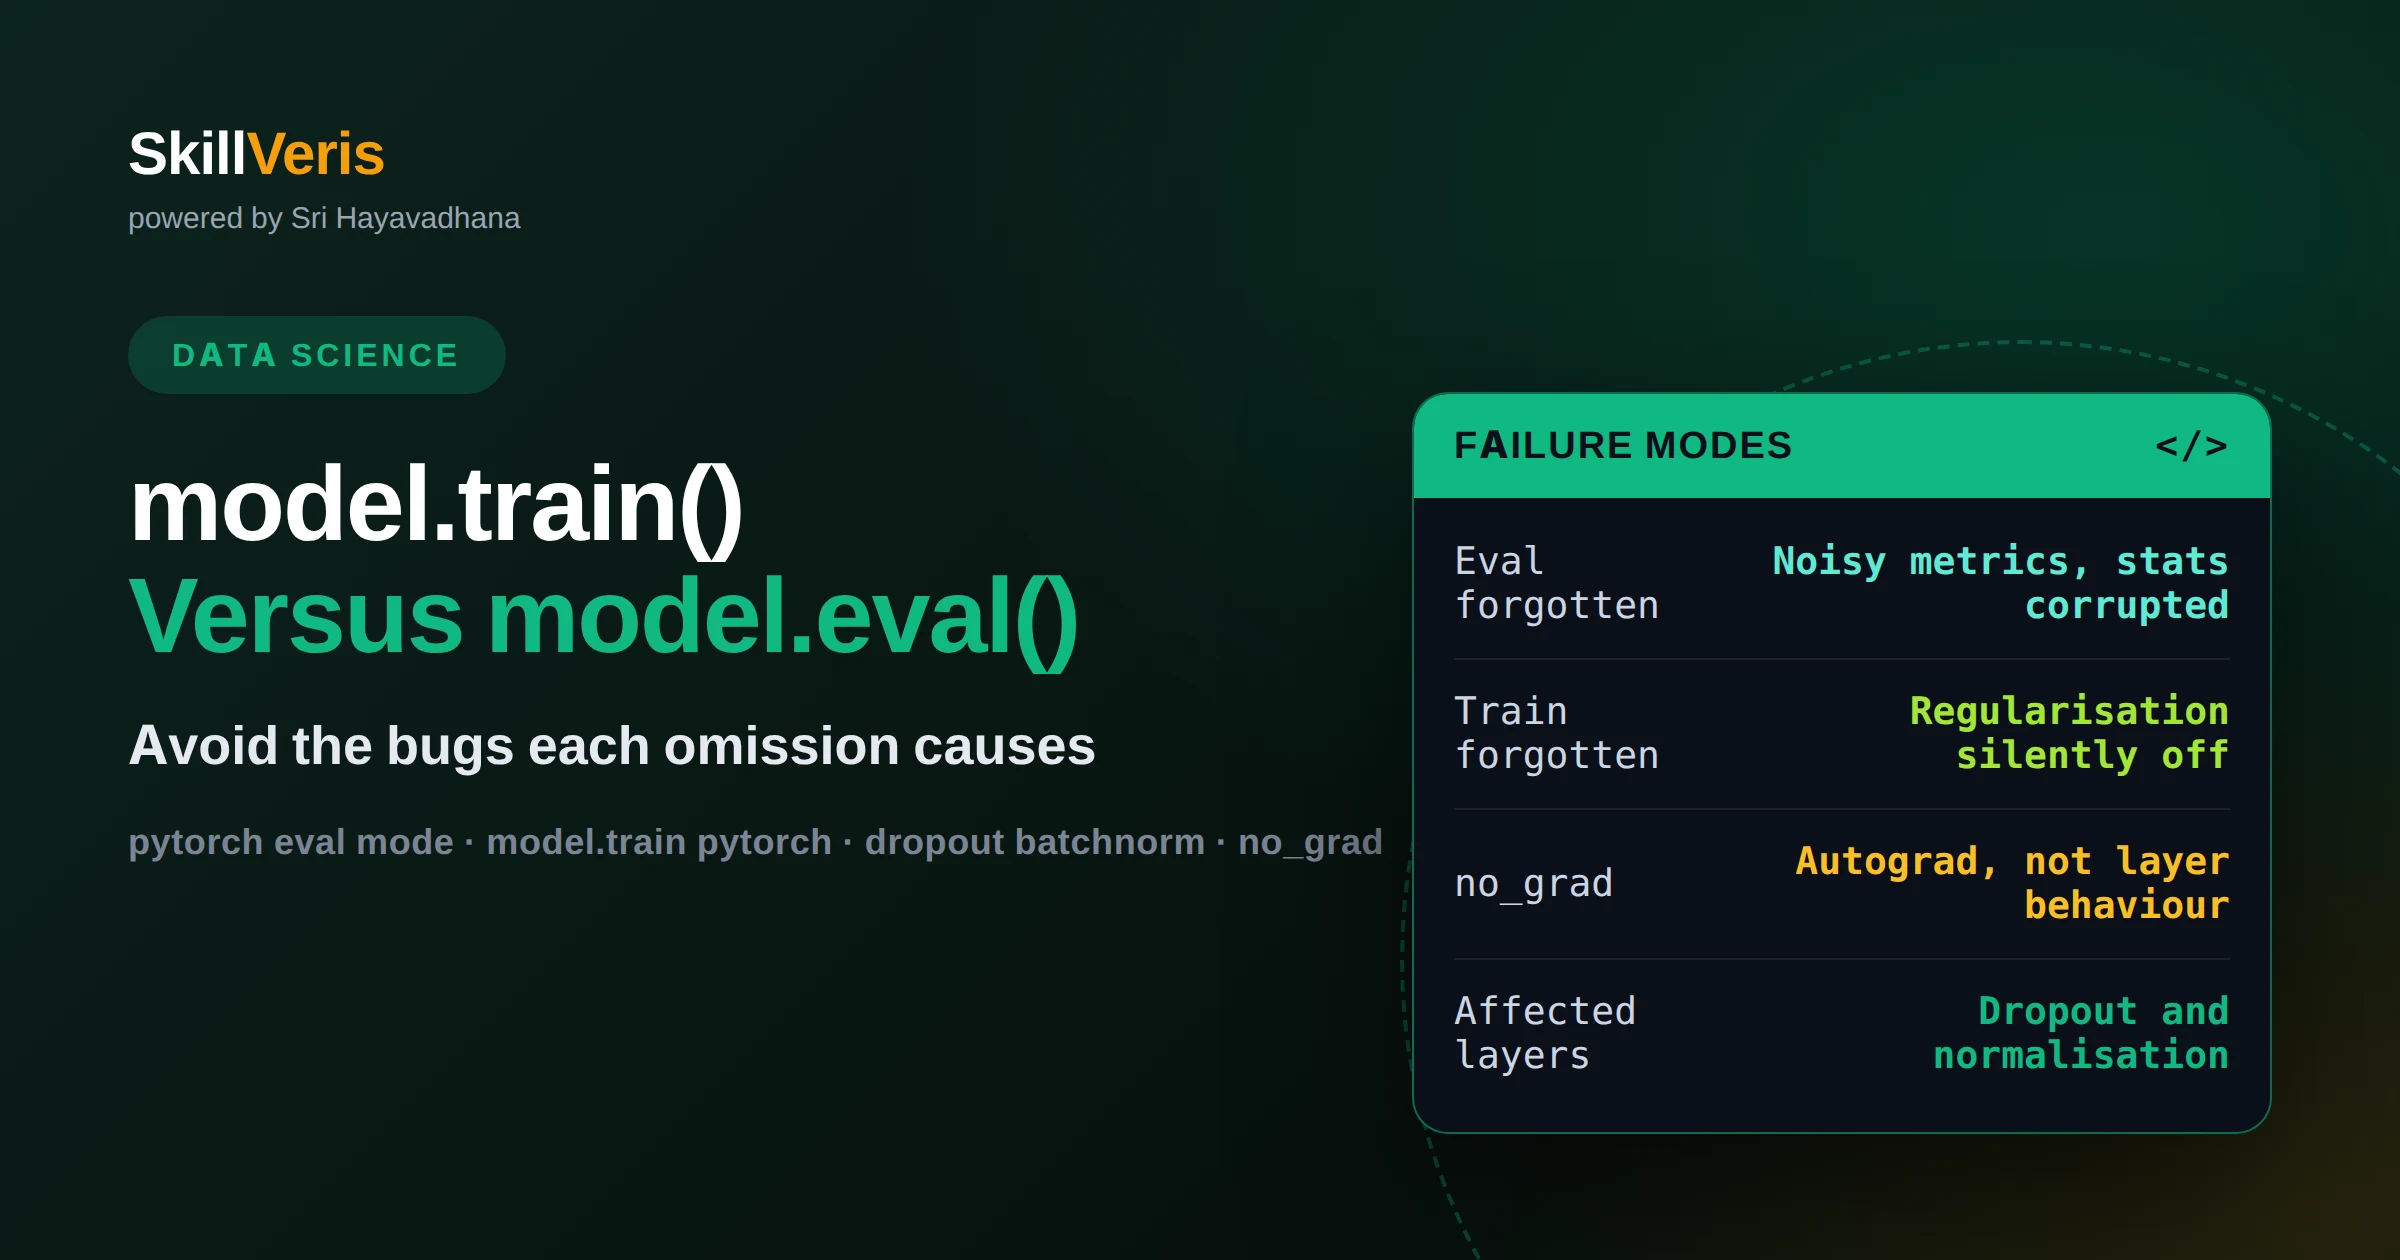
model.train() vs model.eval() in PyTorch: the bugs each omission causes
Only dropout and normalisation layers read the training flag, and each omission causes a distinct bug. Evaluating in train mode gives noisy metrics and corrupts running statistics; training in eval mode silently disables regularisation. Neither is the same switch as no_grad.
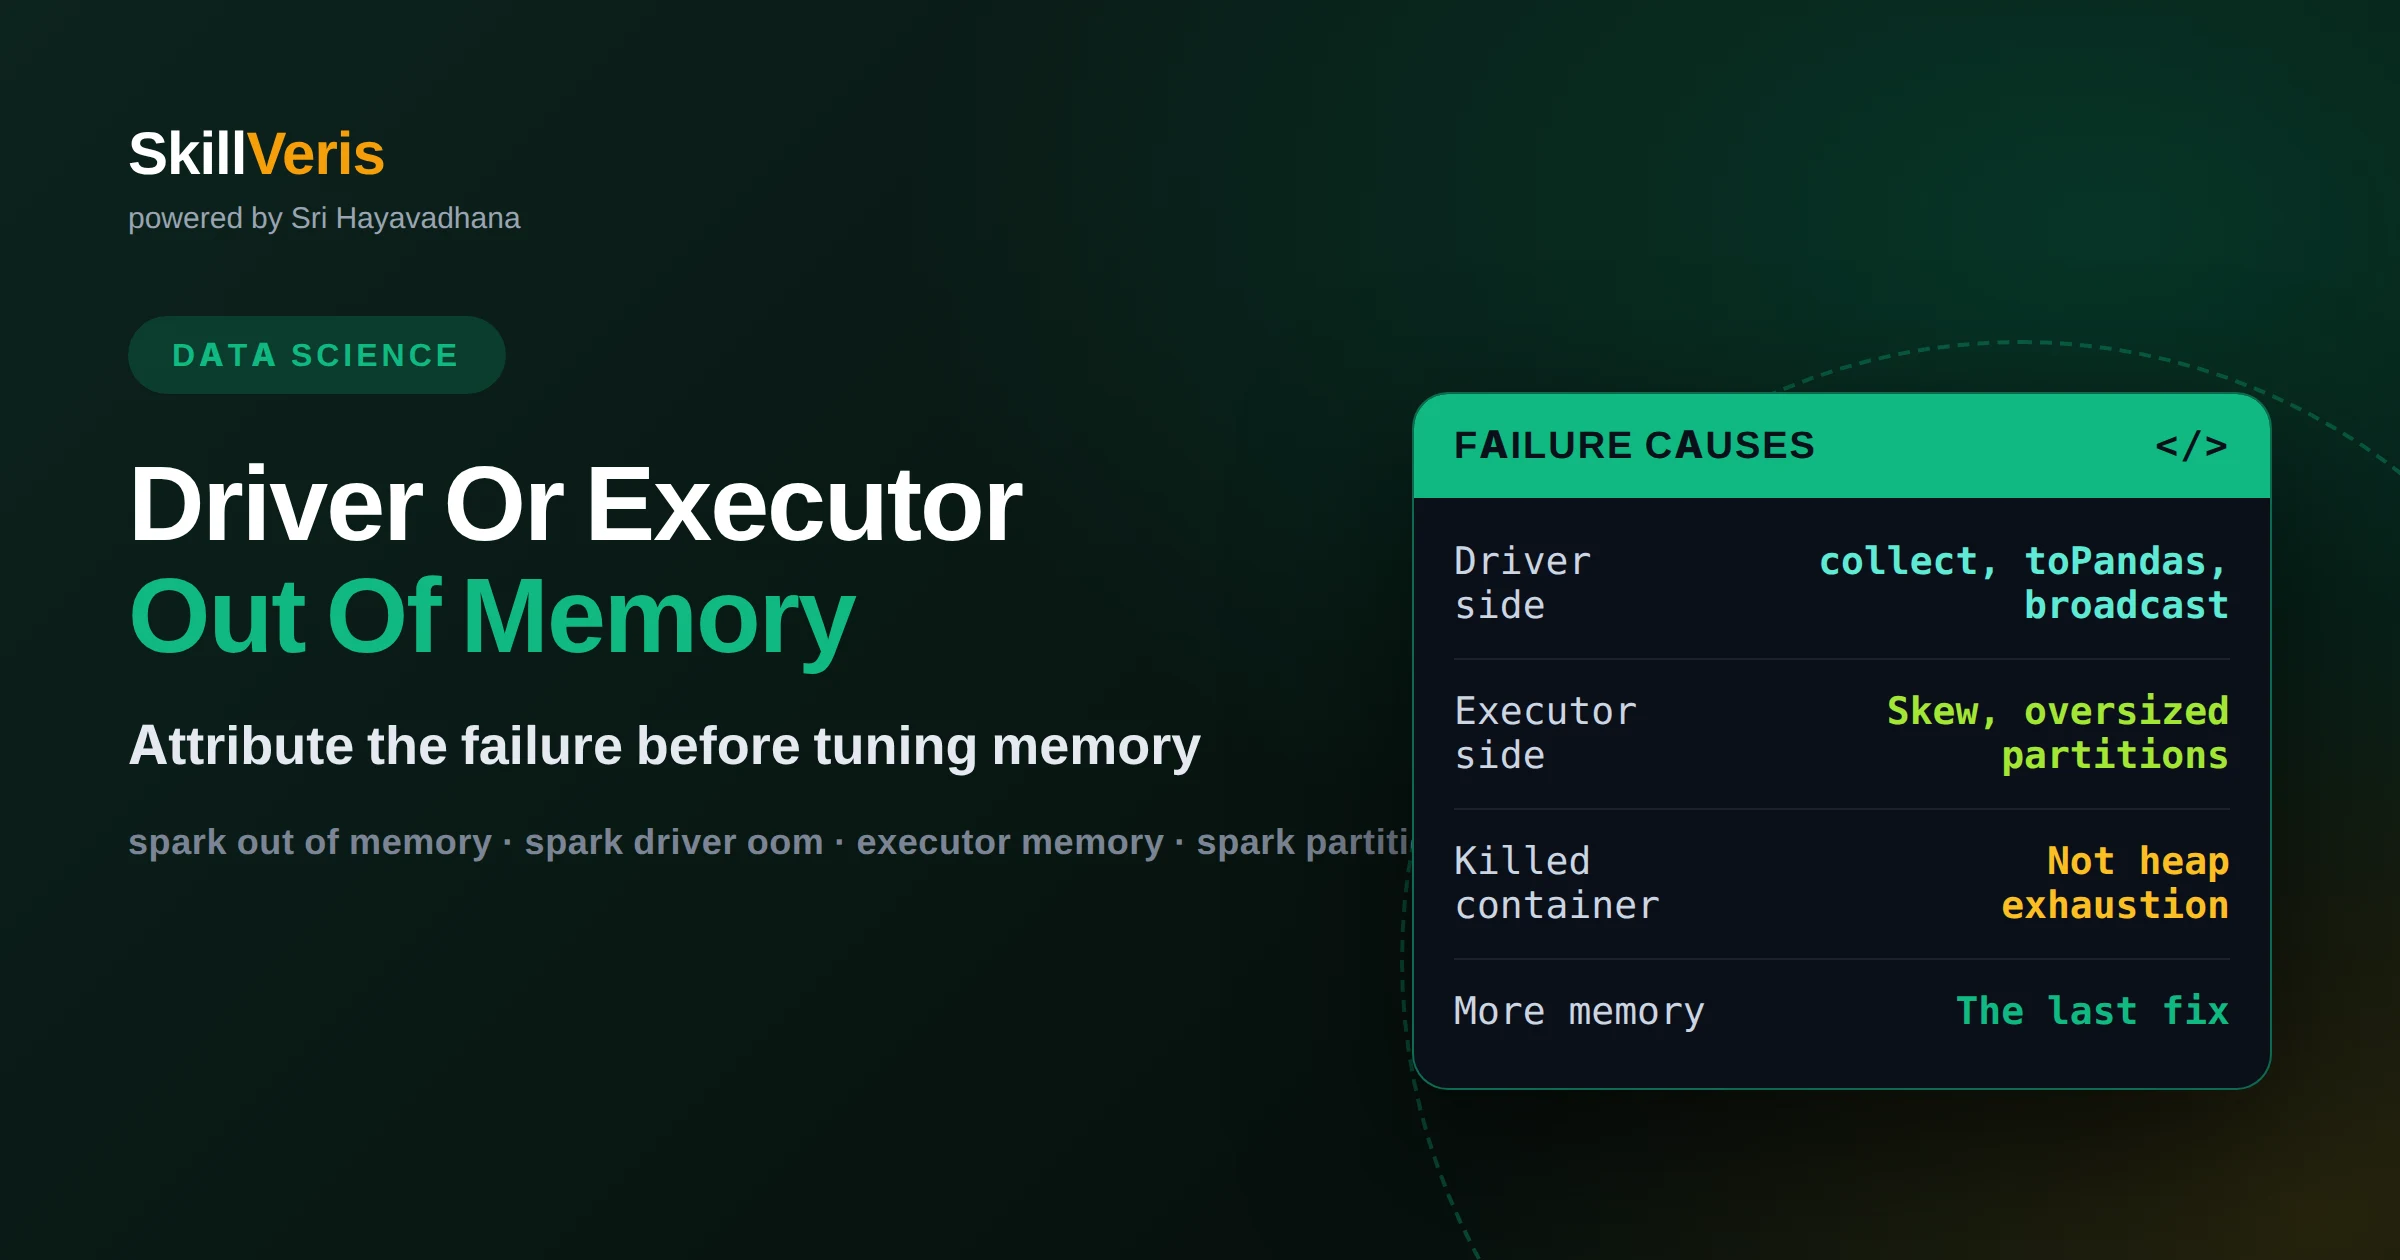
Driver vs executor out of memory in Spark: telling the two apart
Attribute a Spark out-of-memory failure before you change any memory setting. The message text and stack location tell you which side died, and each side has its own short list of real causes. Raising memory is the last fix, because it conceals the design error that produced the failure.
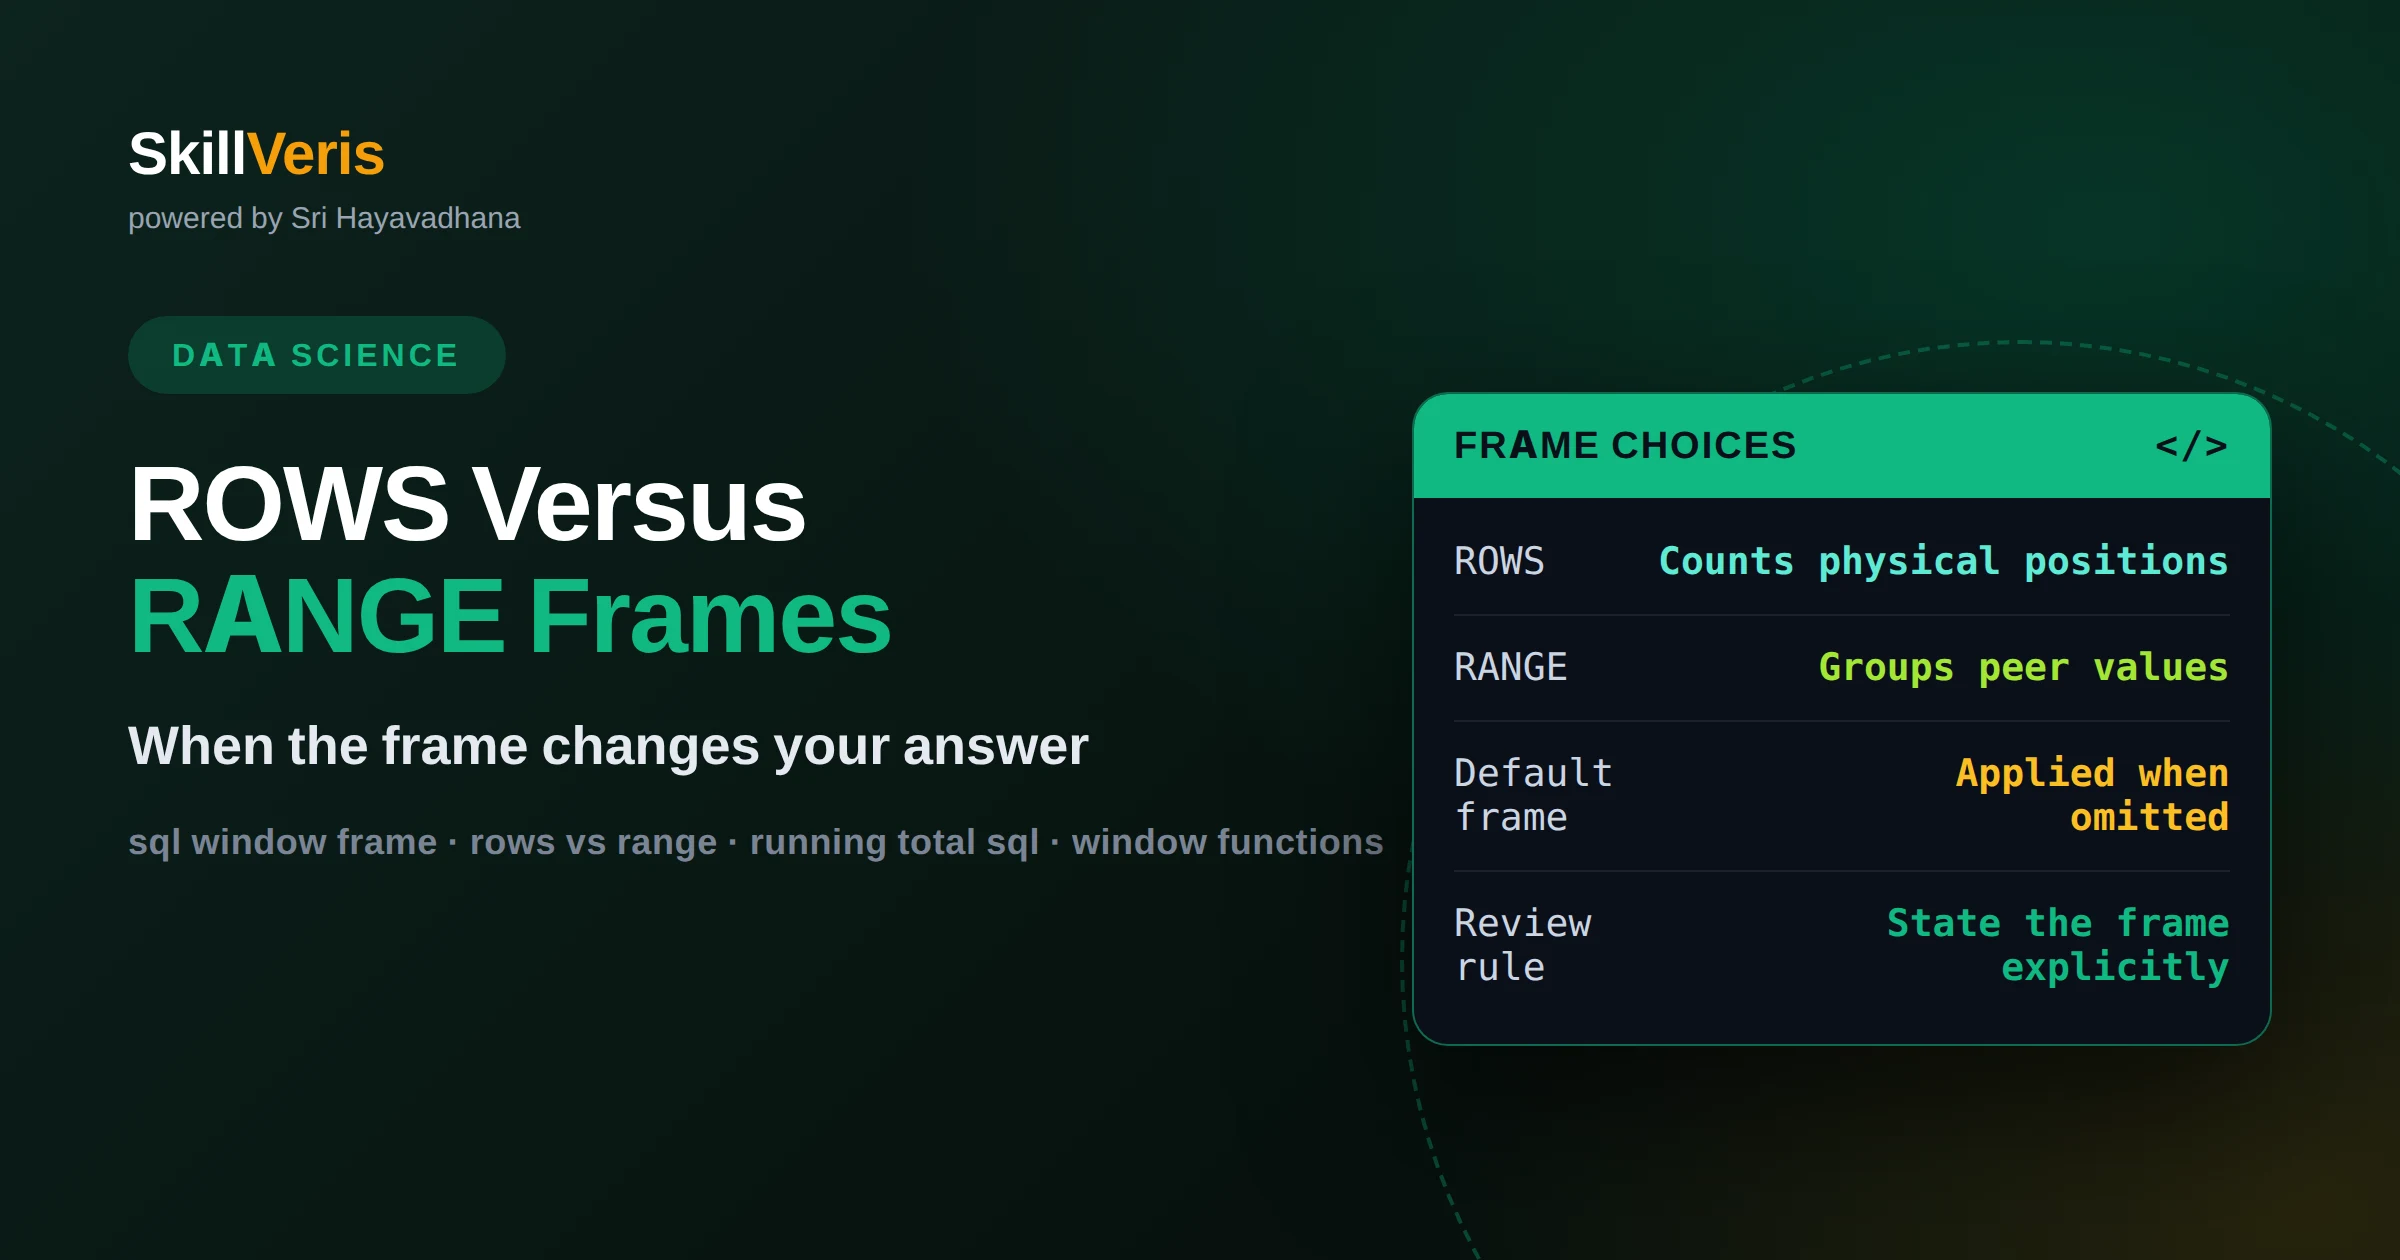
ROWS vs RANGE in SQL window frames: when the choice changes your answer
ROWS counts physical rows; RANGE groups peer rows sharing the same ORDER BY value. On a date column with several rows per day, a running total returns a different number under each. Use ROWS for fixed-length moving windows, RANGE for cumulative-to-date semantics, and always state the frame explicitly.
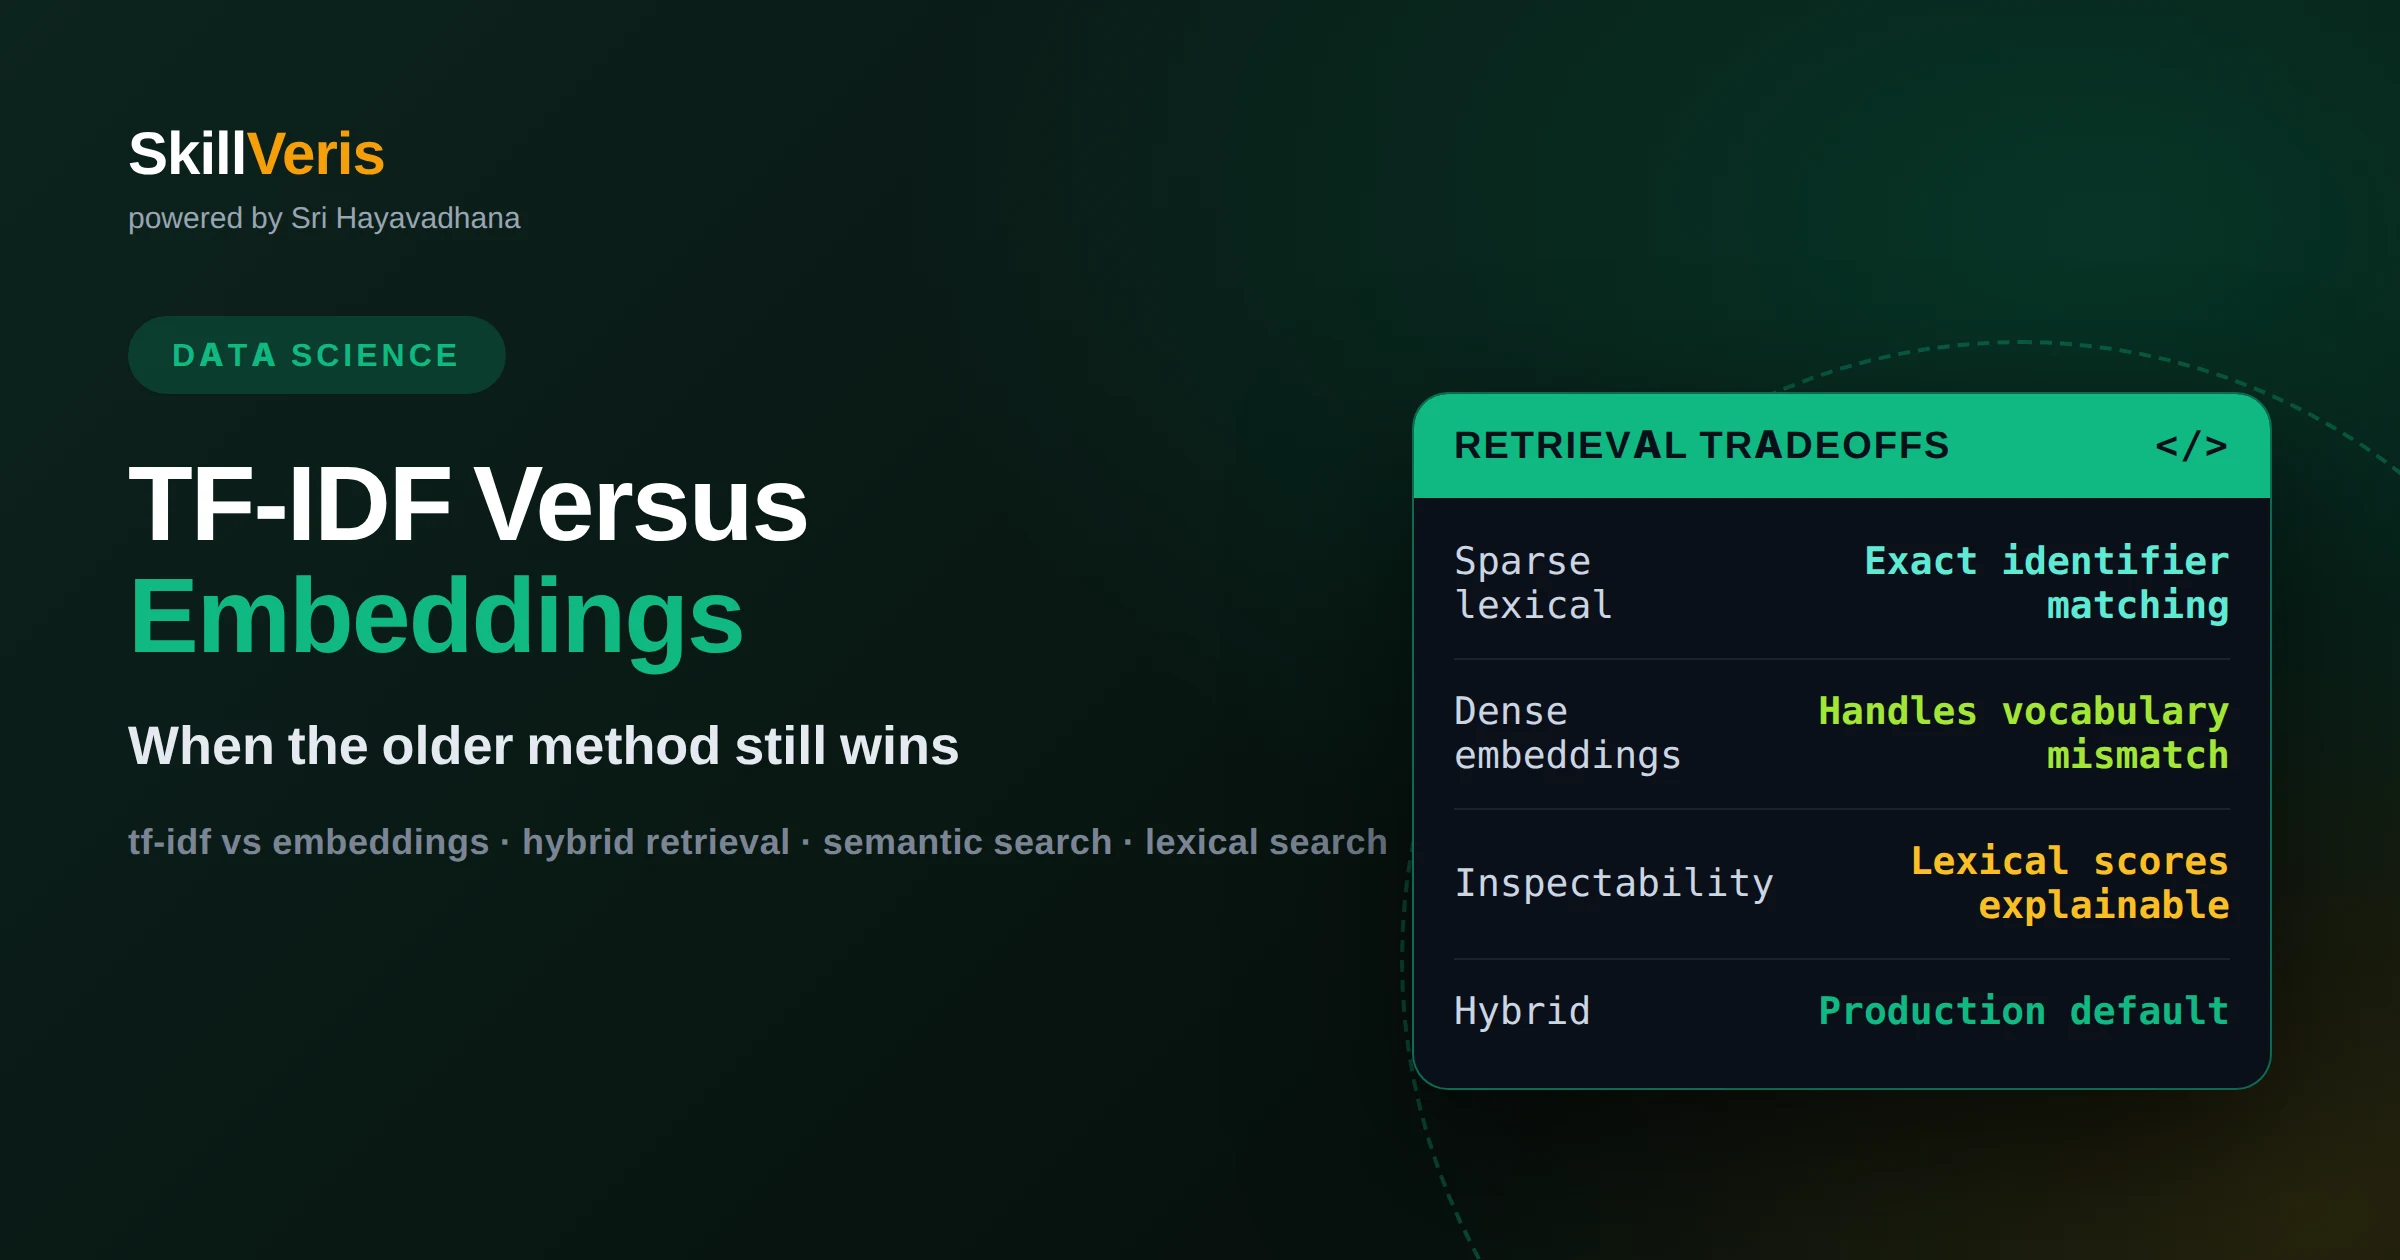
TF-IDF vs embeddings for text search: when the older method still wins
The choice is driven by your query distribution. Sparse lexical matching wins on exact identifiers, product codes, rare domain terms and small corpora where it is also cheap and inspectable; dense embeddings win on paraphrase and vocabulary mismatch. Because each fails on what the other handles, hybrid retrieval is the sensible production default.
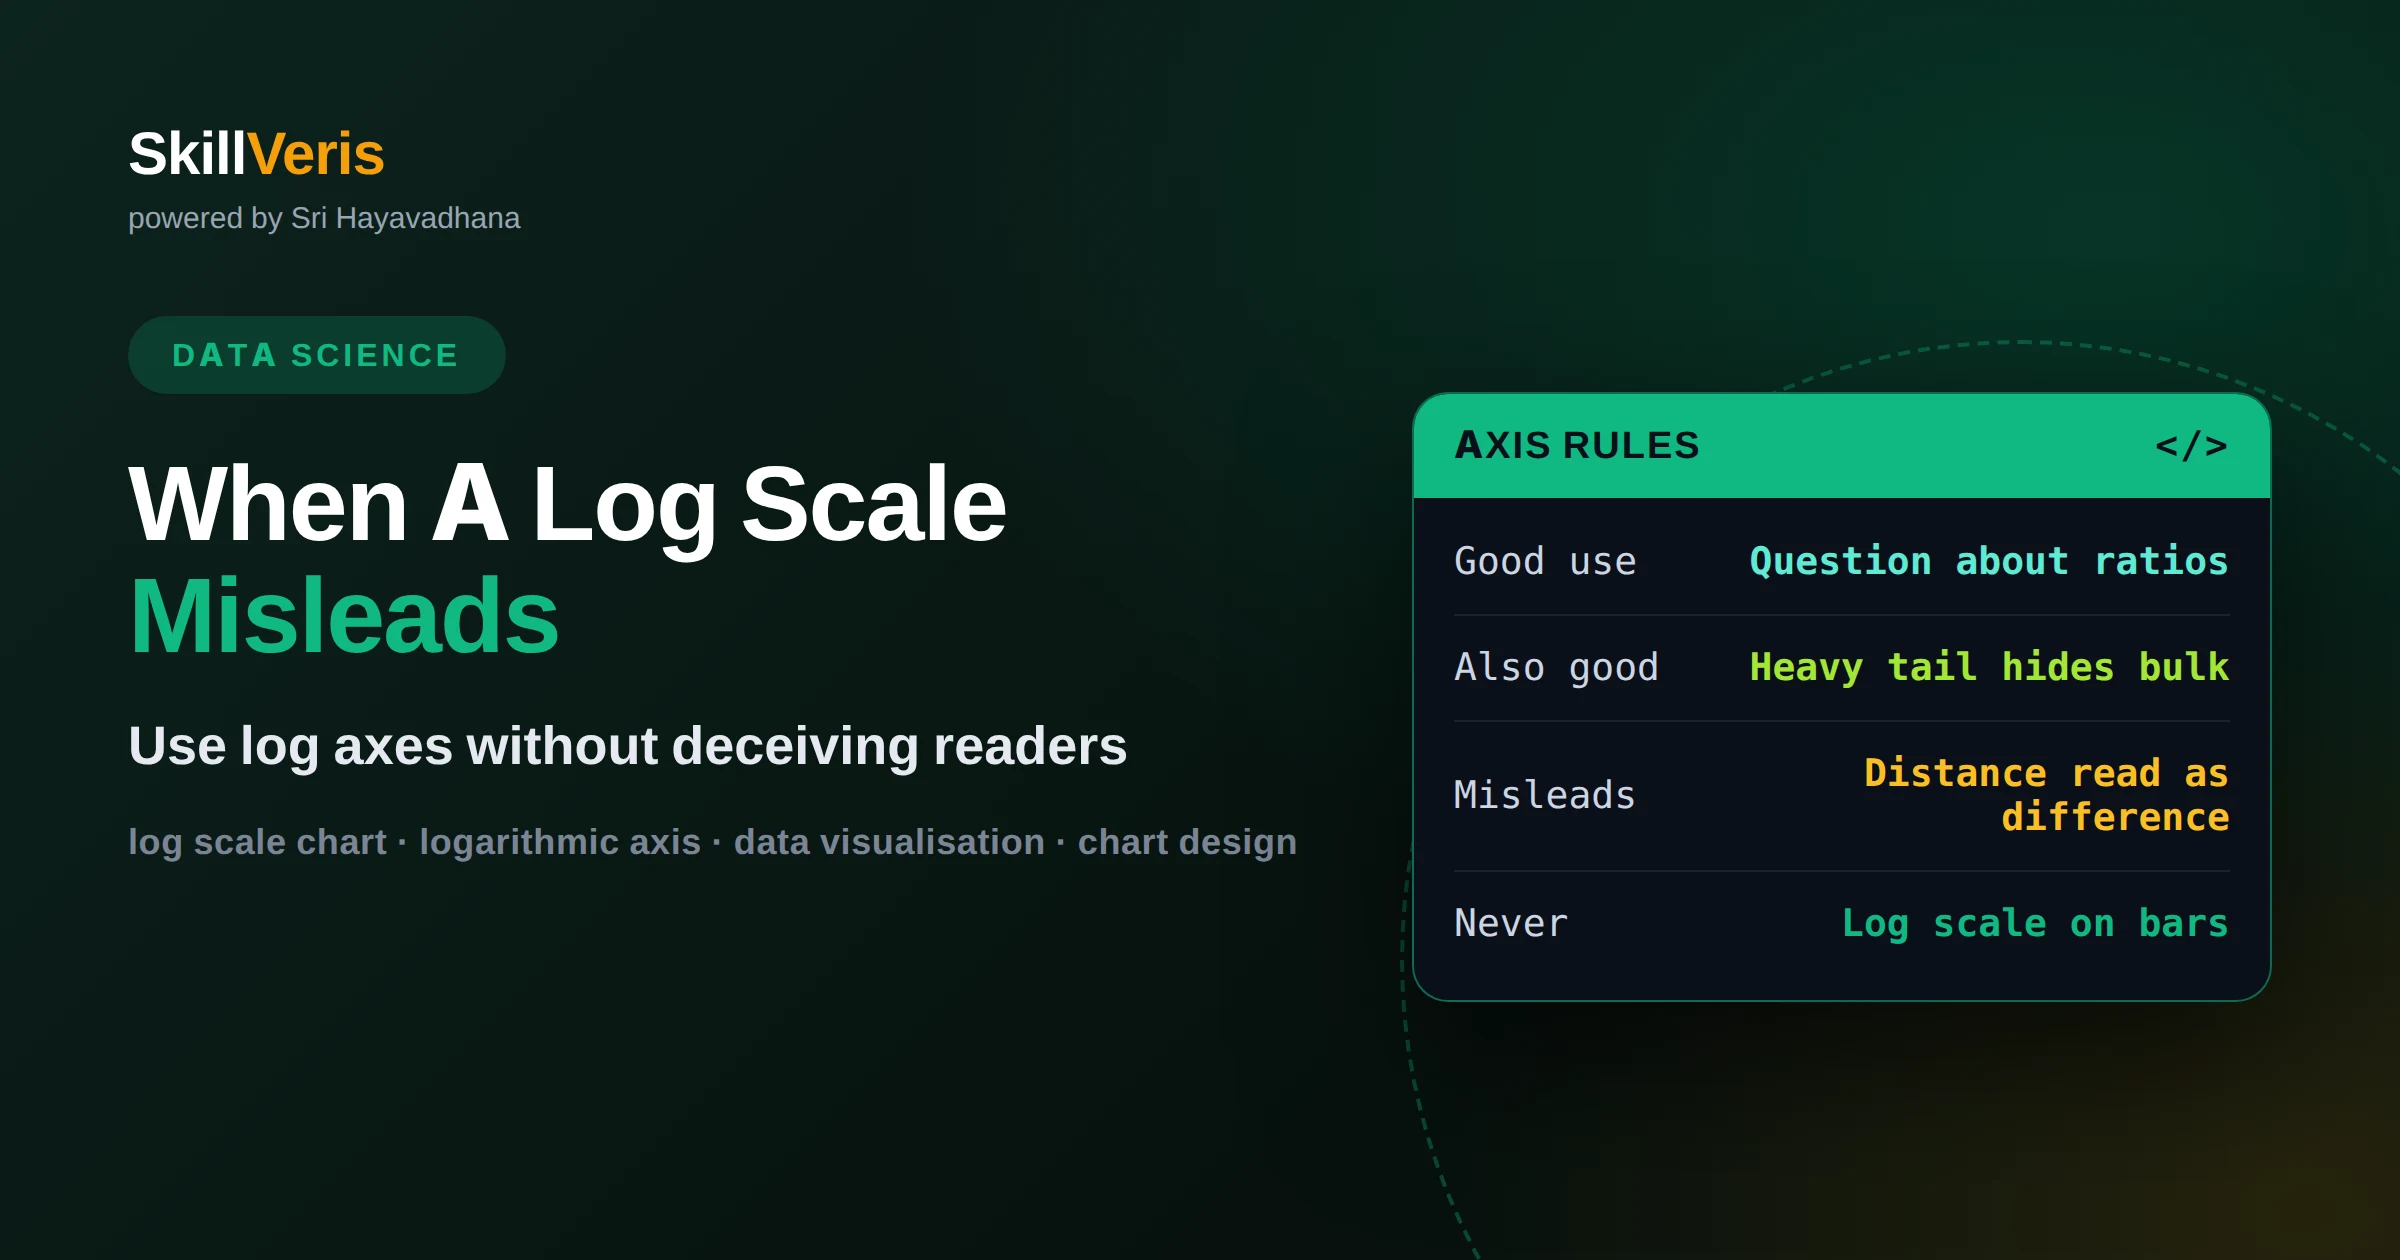
When a log scale helps your chart and when it misleads the reader
A log scale earns its place when the question is about multiplicative change or when a heavy tail hides the bulk of the data. It misleads when the audience will read distances as absolute differences. This article gives the conditions that make a log axis safe, the chart type it must never touch, and the alternatives for a general audience.
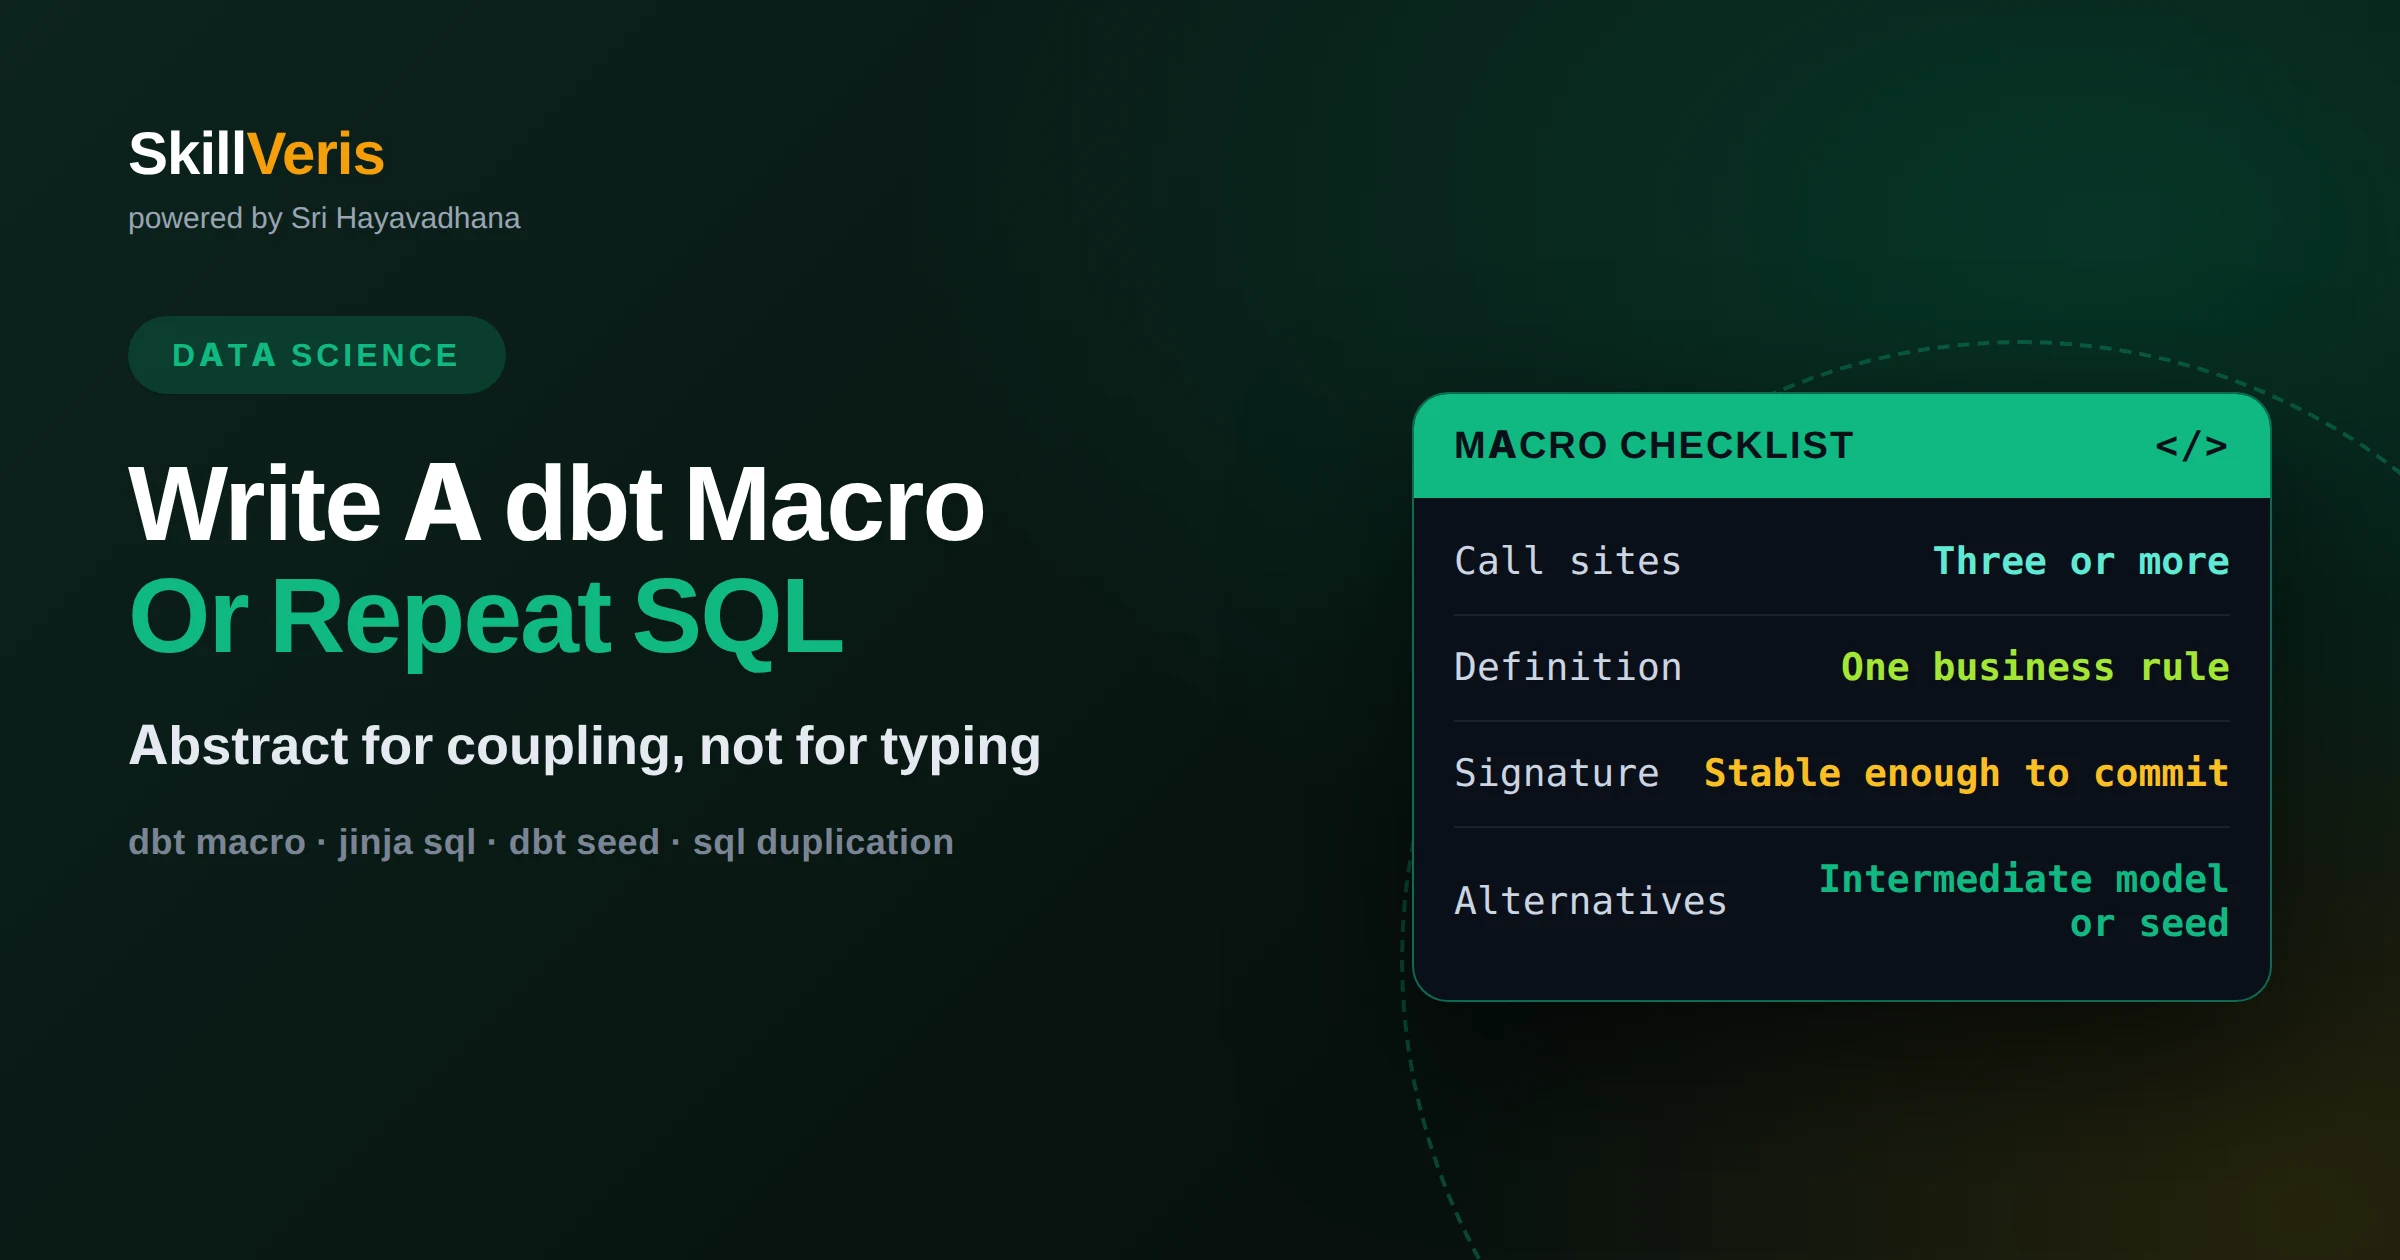
When to write a dbt macro instead of repeating the SQL
Write a macro when it encodes a rule that must change everywhere at once, not merely to save typing. Three or more call sites, one business definition, a stable signature. Where those do not all hold, a shared intermediate model, a generic test or a seed lookup is usually the better abstraction.
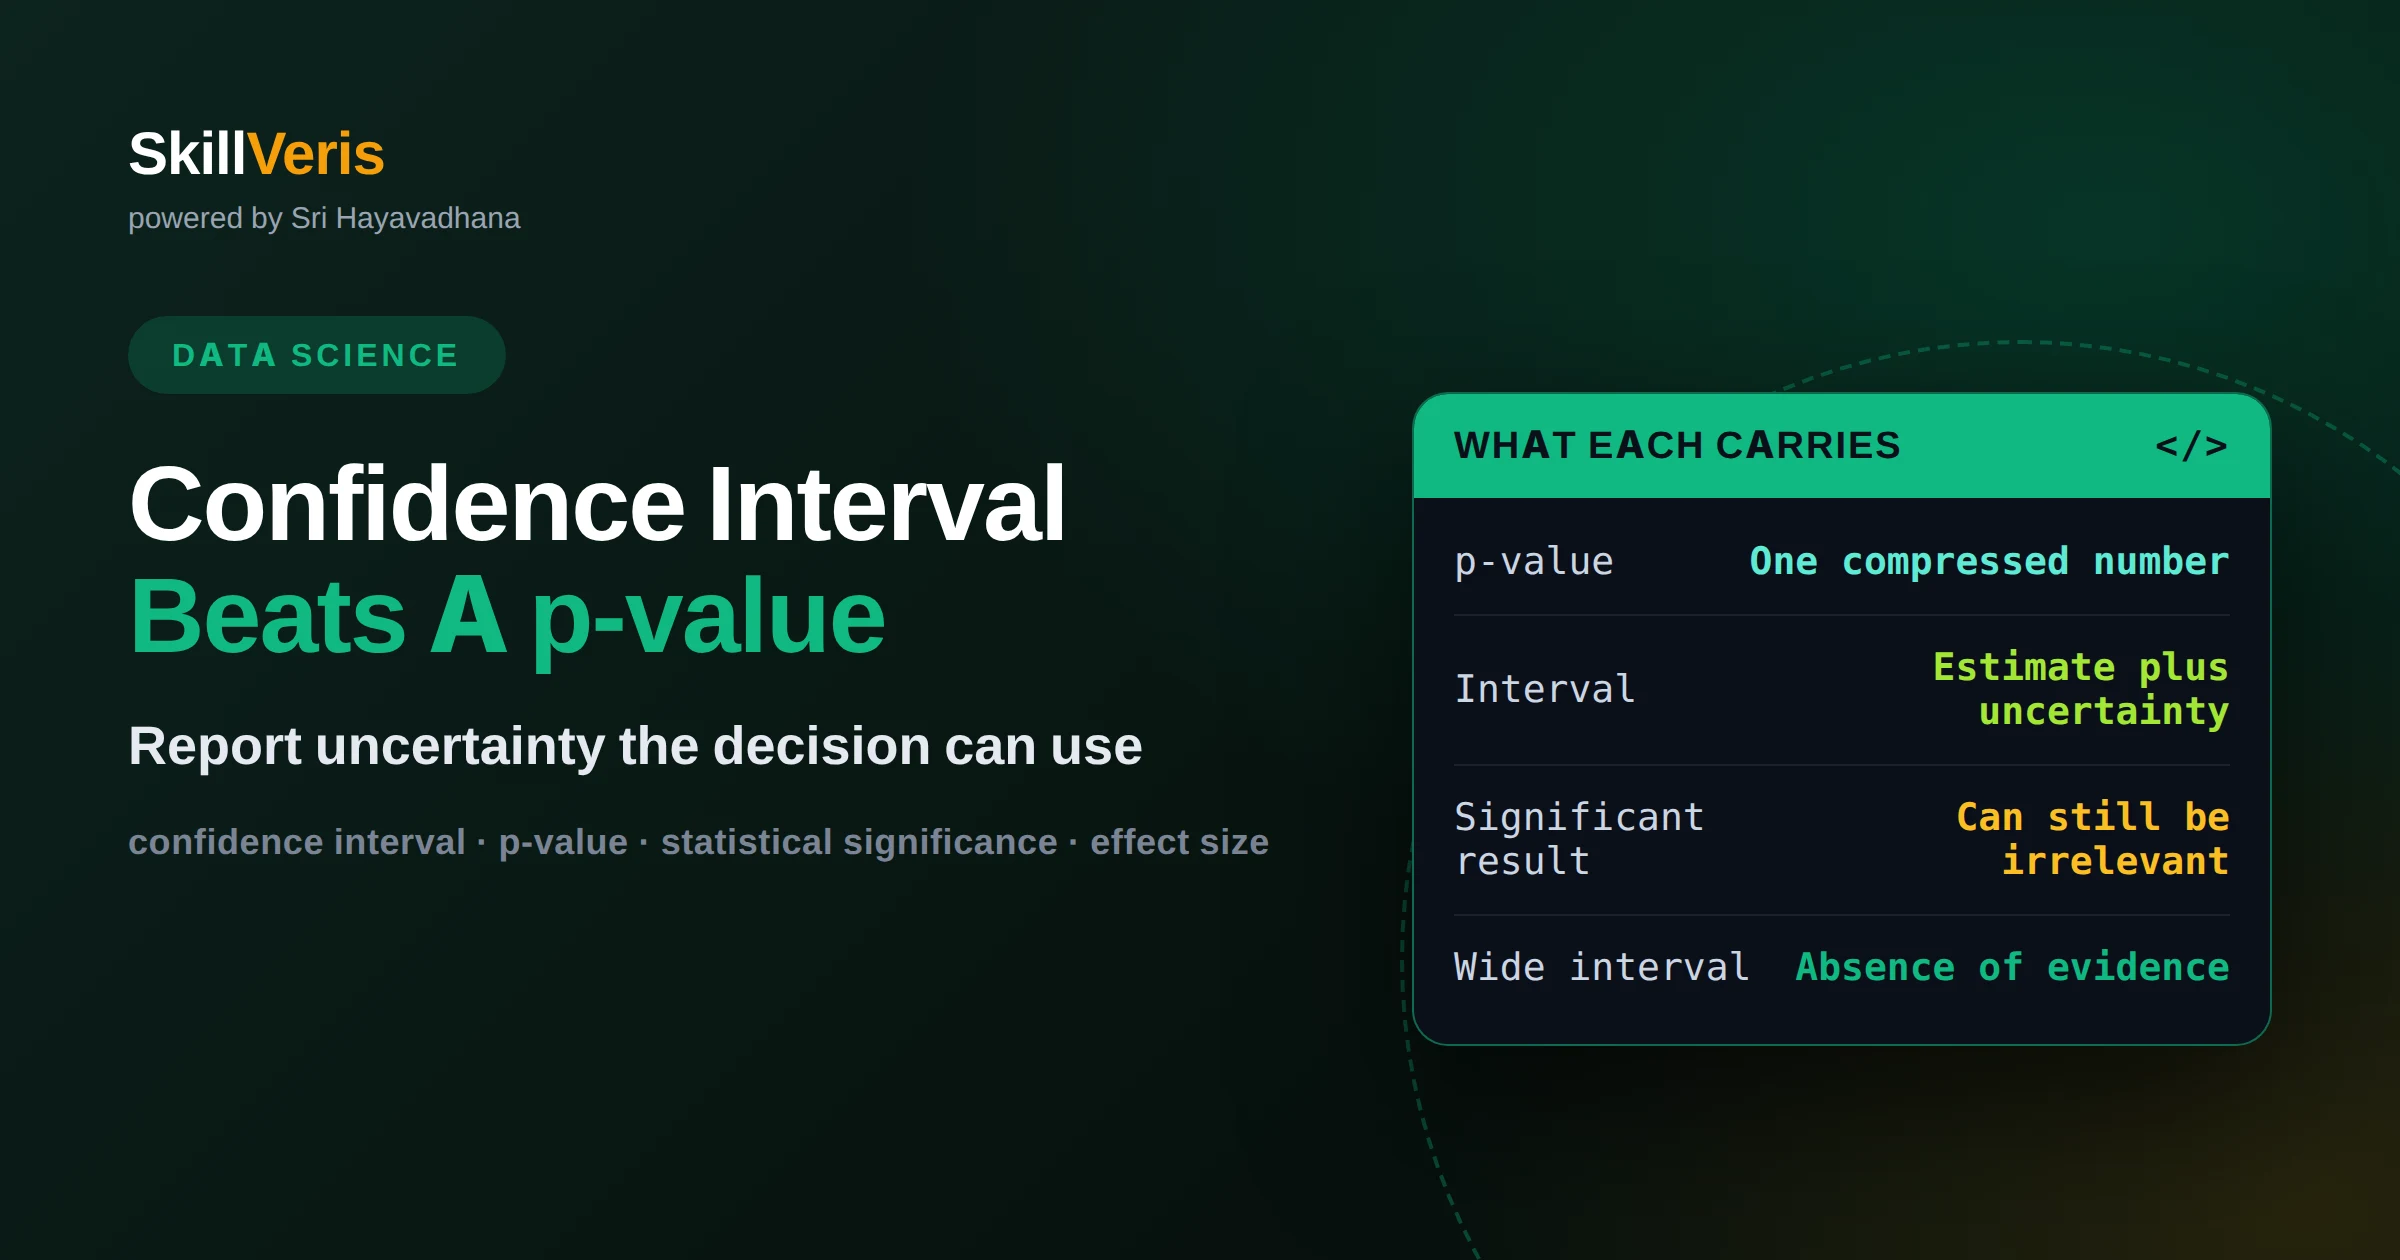
Why a confidence interval tells you more than a p-value
A p-value compresses an estimate and its uncertainty into a single number answering a question nobody asked. An interval keeps both, showing directly whether the plausible range includes effects too small to act on. This article works through a significant-but-irrelevant result and a non-significant one whose interval justifies more data.
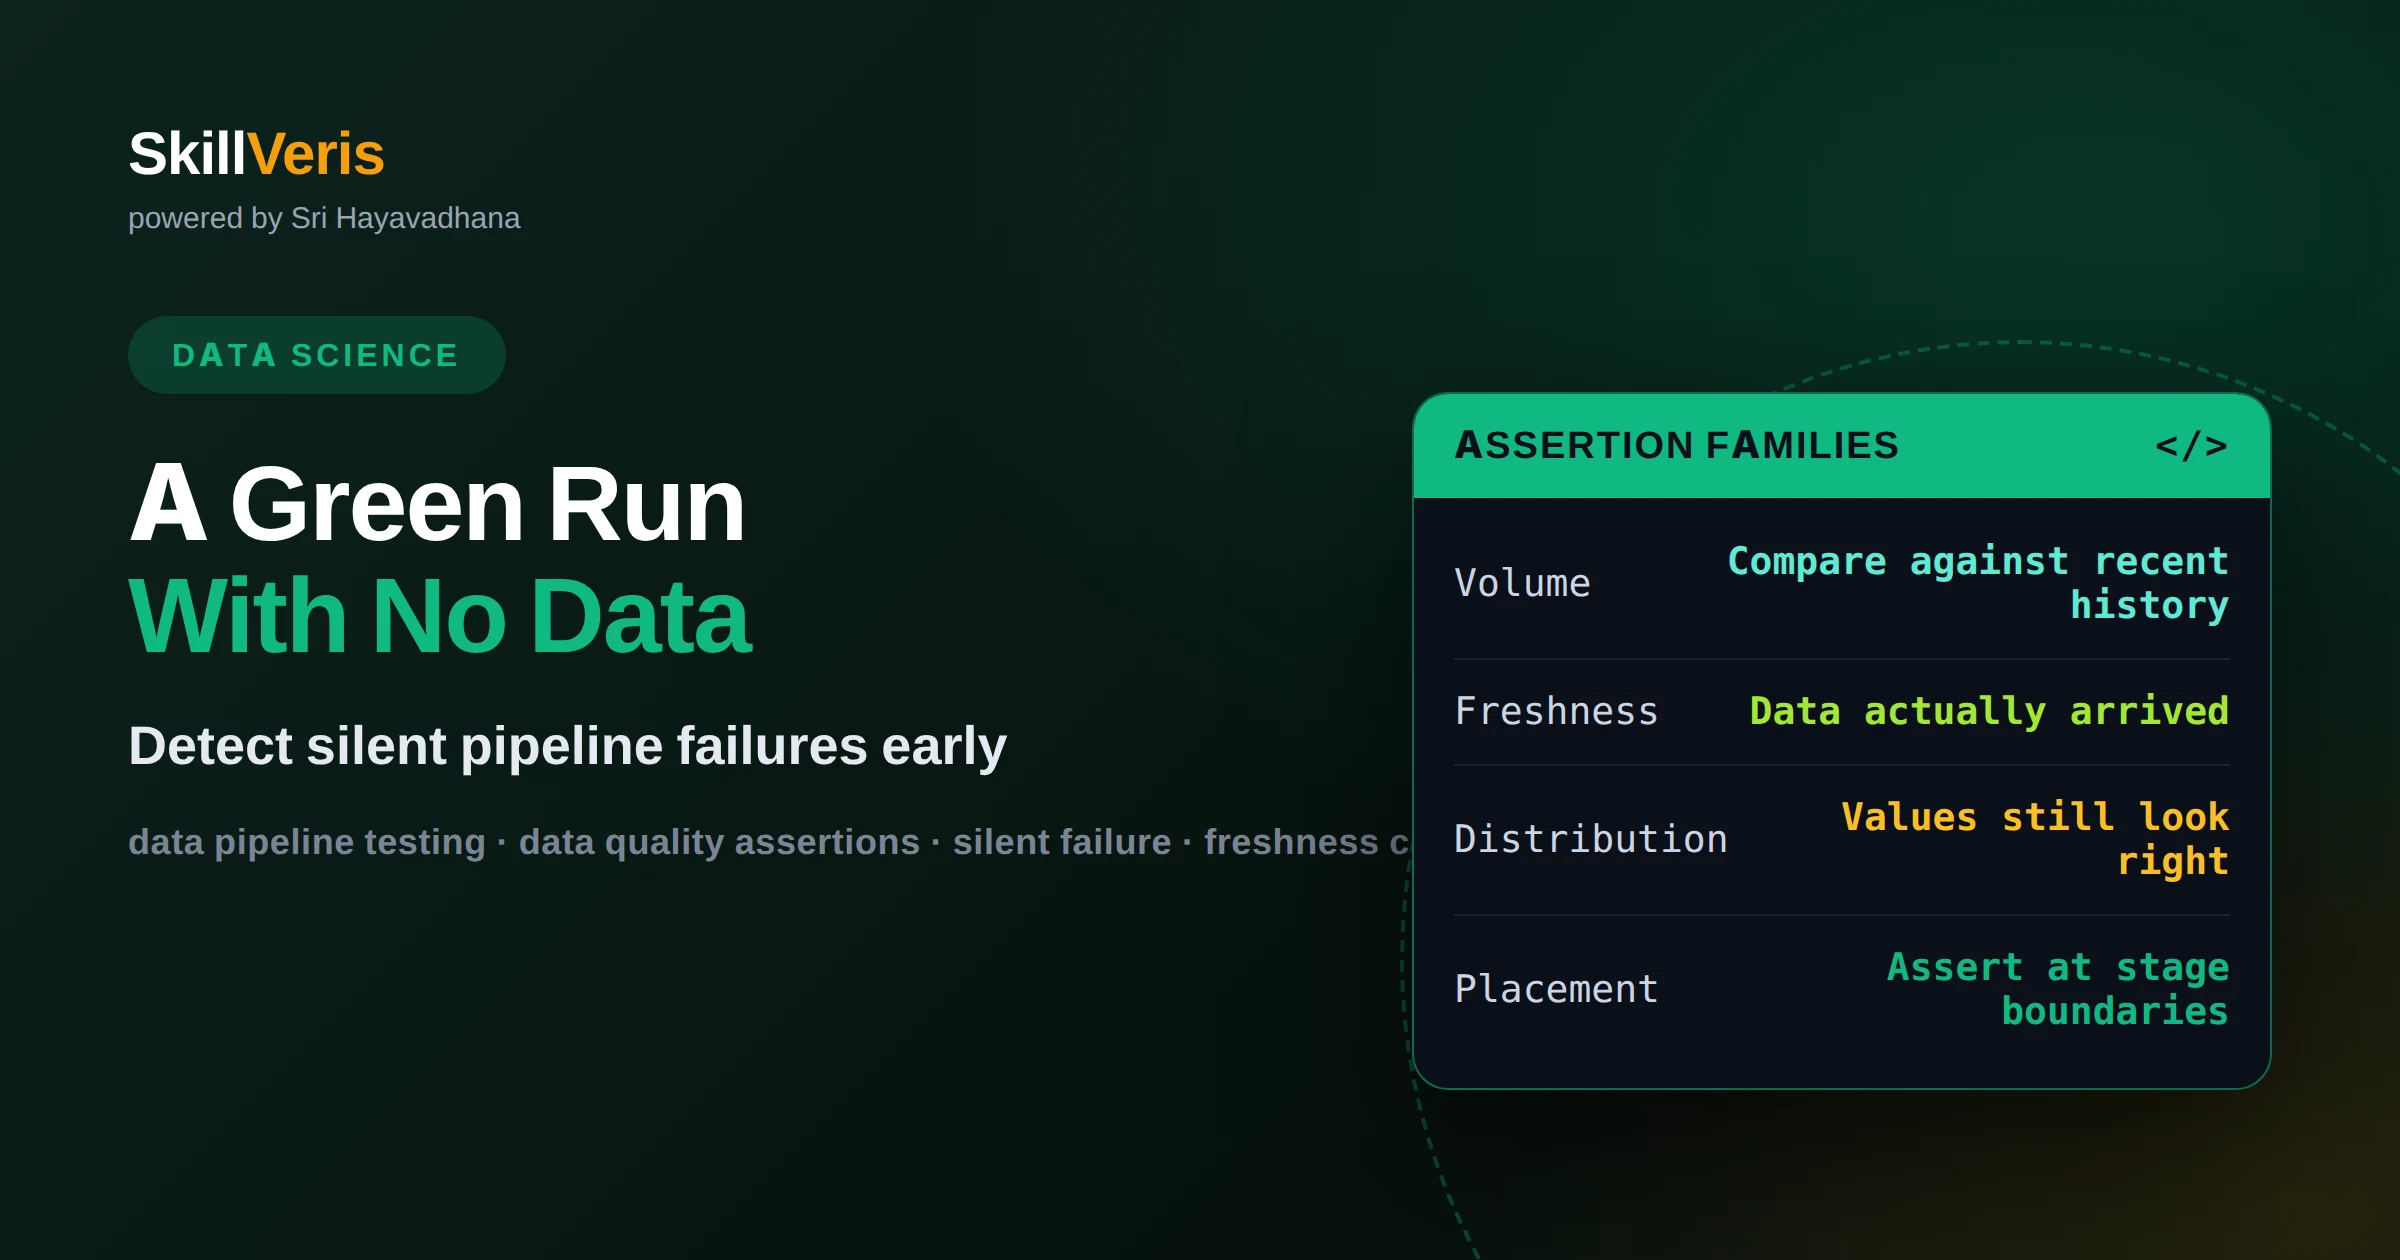
Why a green pipeline run can still produce no data, and how to detect it
A successful task only proves the code did not raise an exception. Pipelines need volume, freshness and distribution assertions at stage boundaries that fail the run when they trip, because the most common silent failures — an absent source file, a filter matching nothing, an empty window — all complete cleanly.
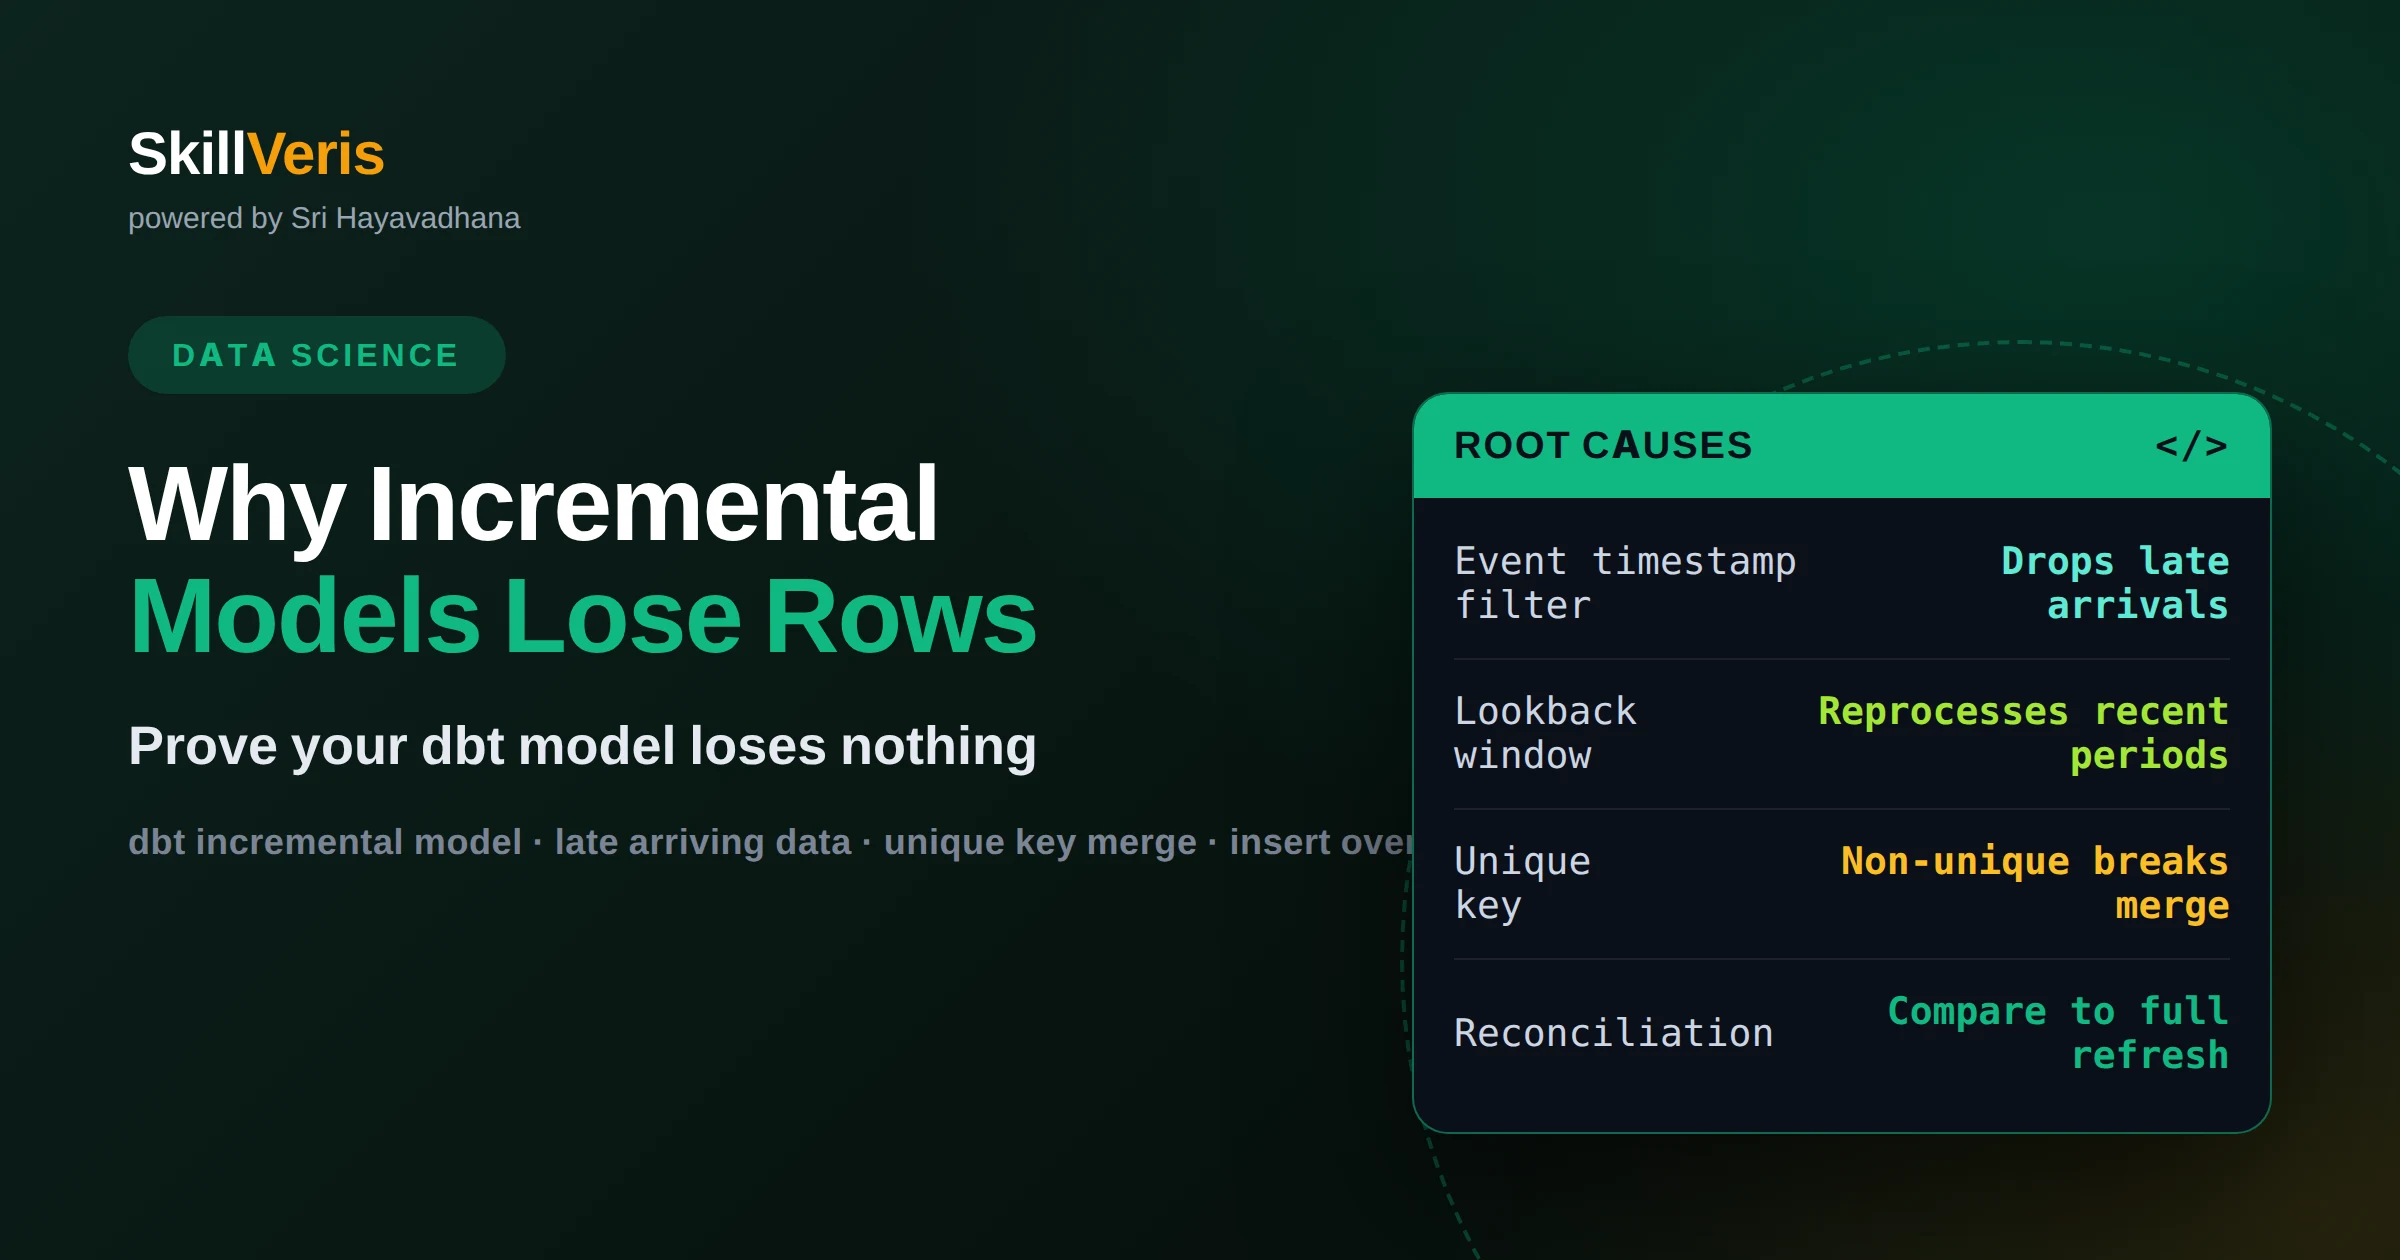
Why dbt incremental models lose rows, and how to prove yours does not
Missing rows in a dbt incremental model nearly always trace to two things: an is_incremental filter on an event timestamp that arrives late, and a unique key that is not actually unique. Add a lookback window, choose merge or insert-overwrite deliberately, and reconcile against a periodic full refresh.
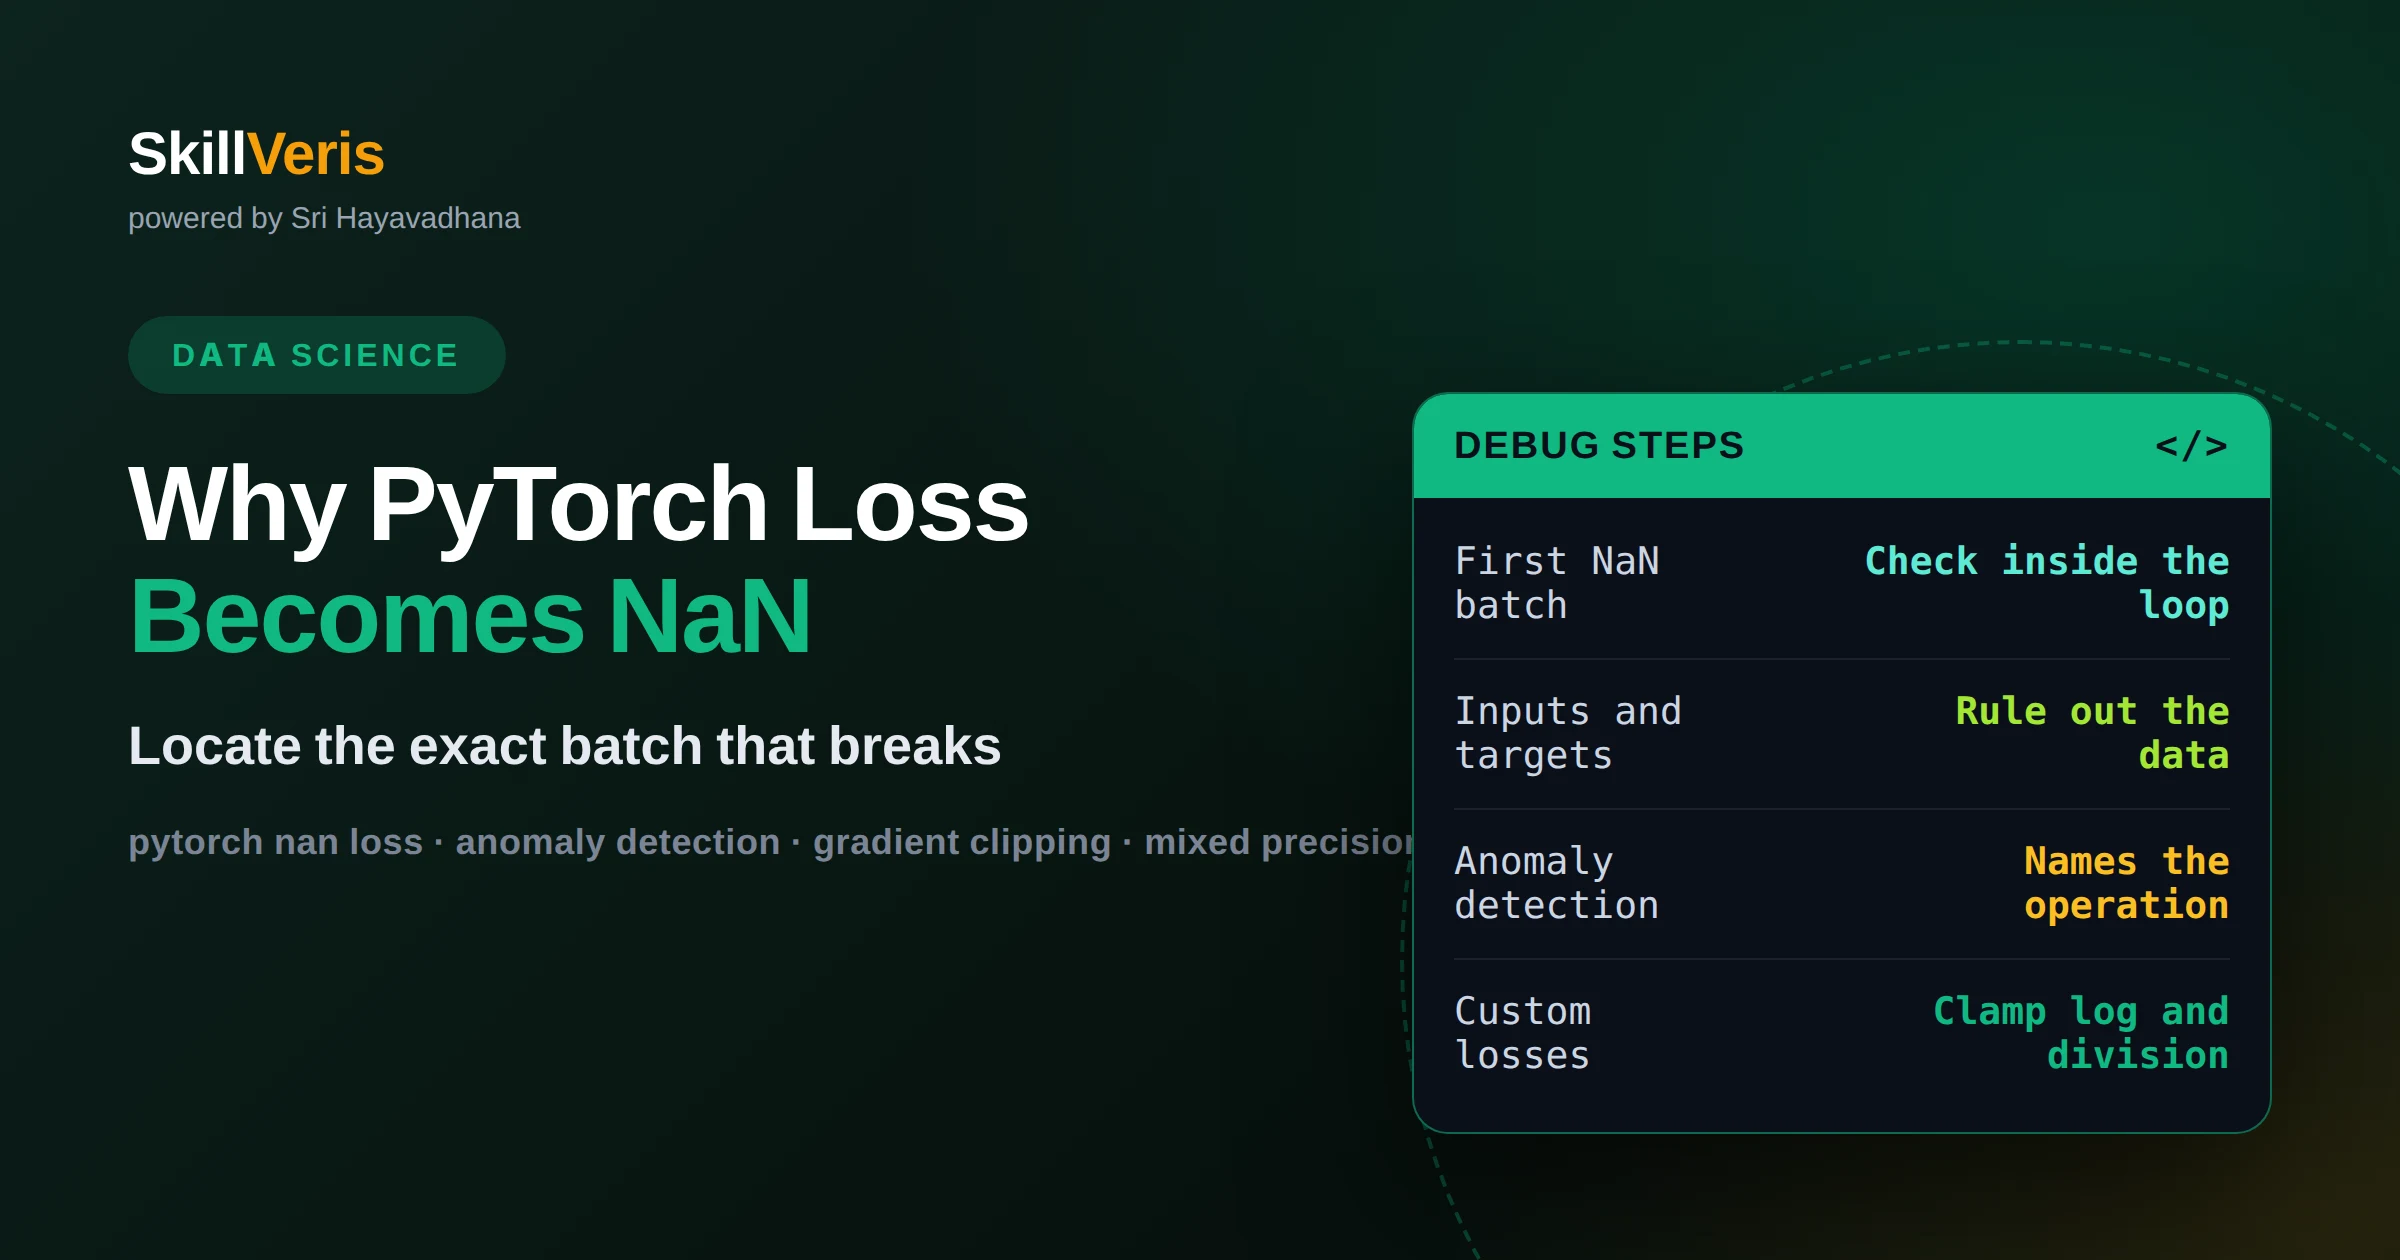
Why your PyTorch loss becomes NaN, and how to find the exact step
A NaN loss has a first occurrence, and finding that exact batch tells you the cause. Detect it with a check inside the loop, inspect the inputs and targets of that batch, then use autograd anomaly detection to locate the operation. Each cause has its own fix.
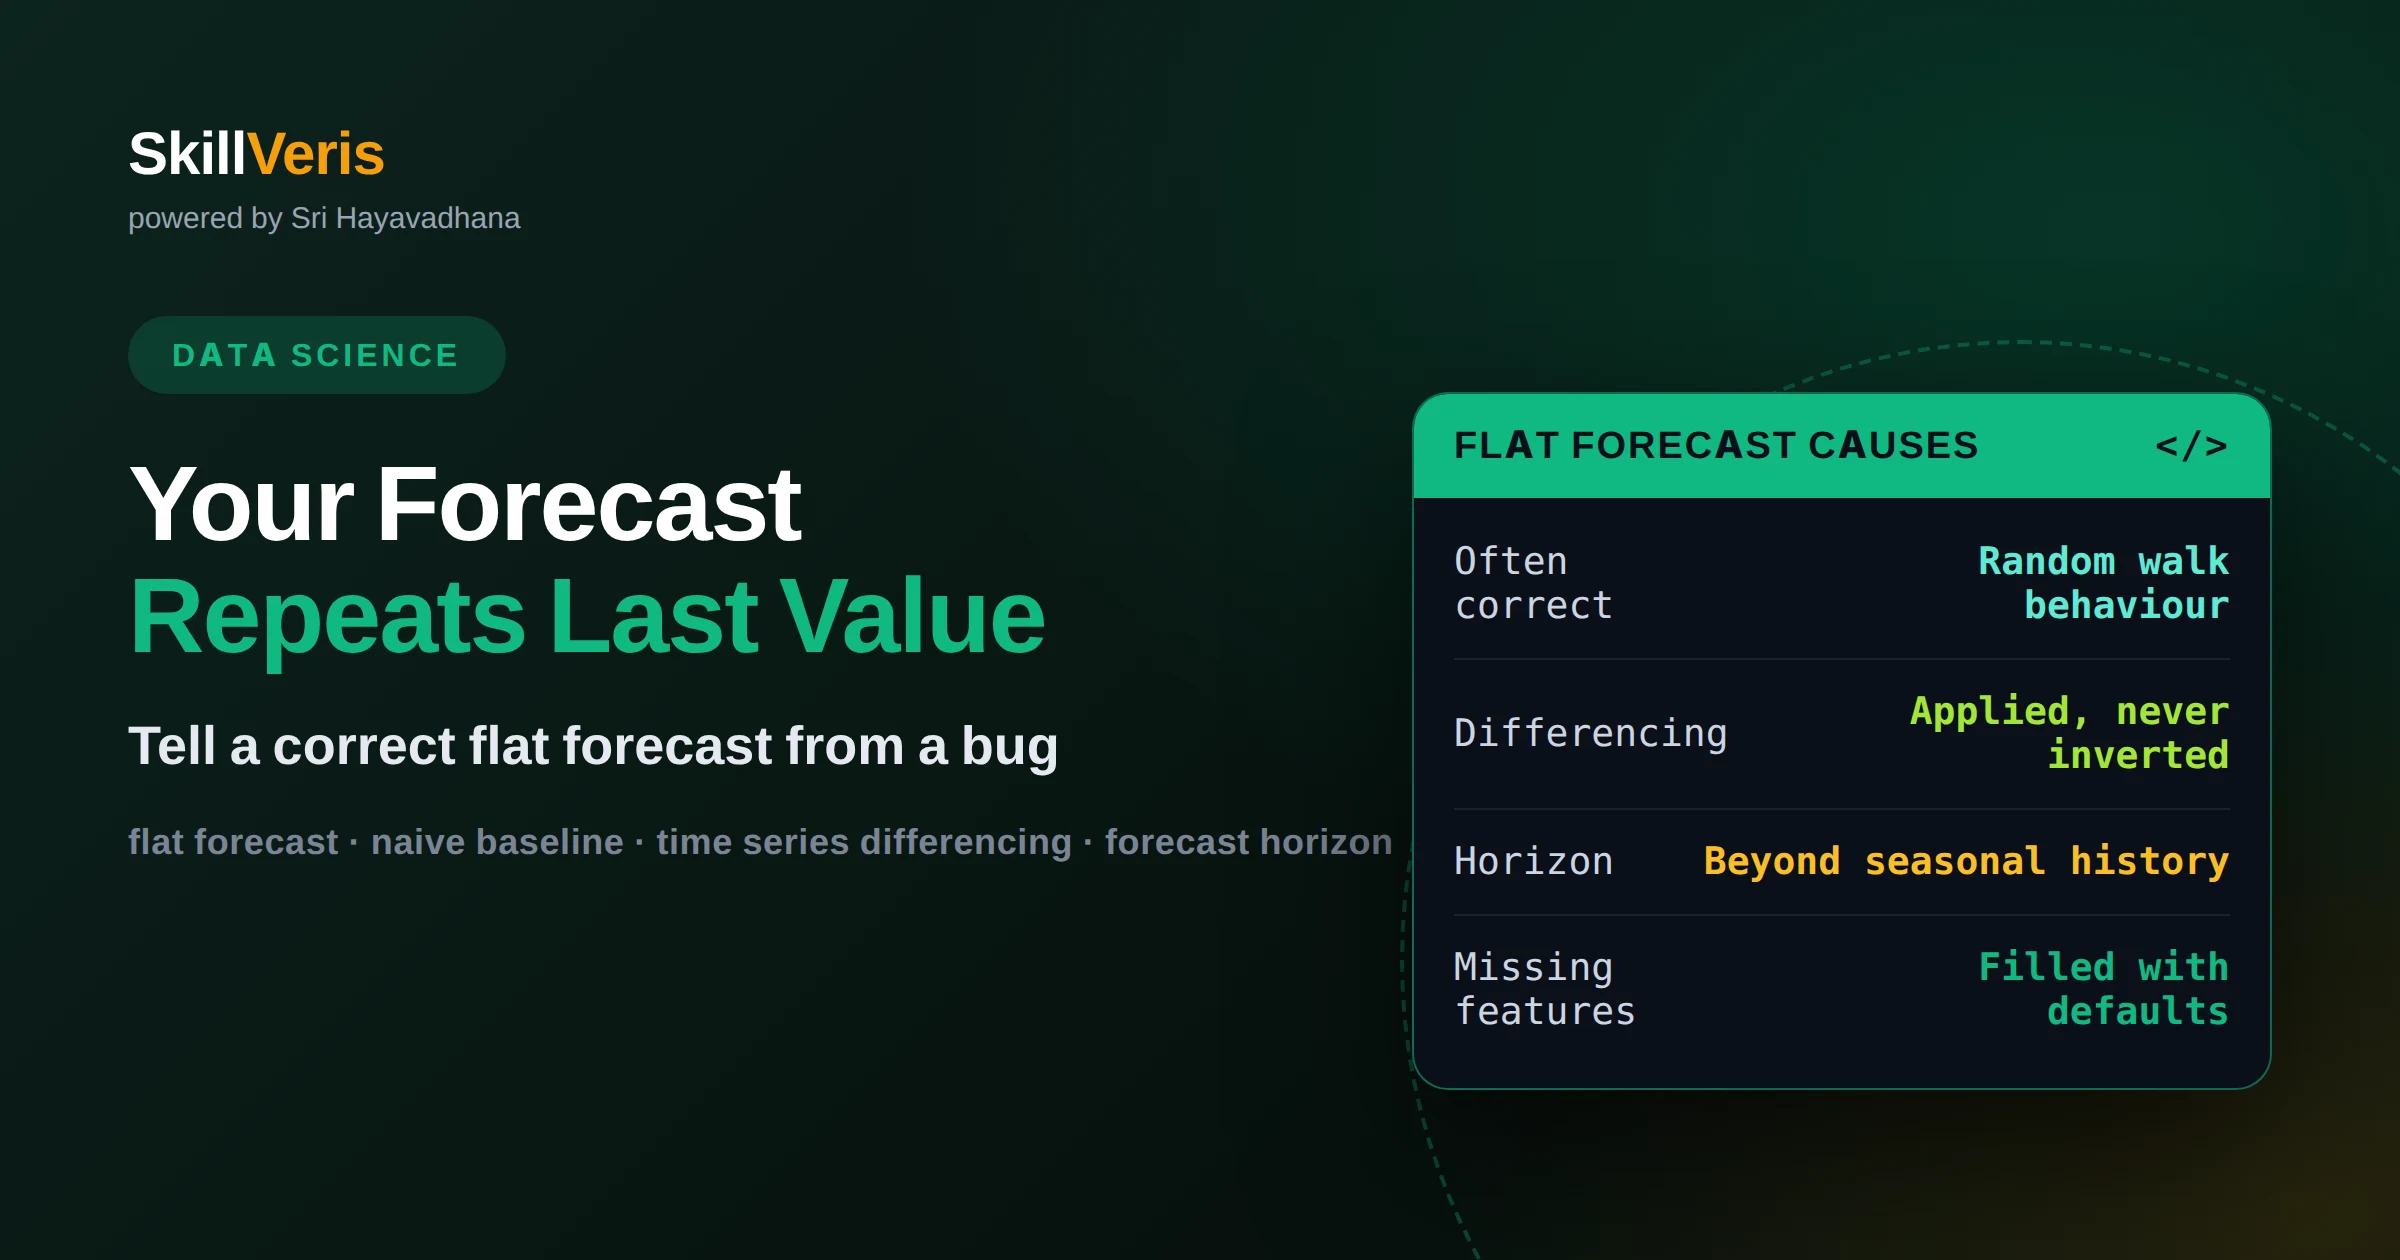
Why your forecast just repeats the last value, and what it means
A flat forecast is usually the model correctly concluding your series has no learnable structure beyond its current level. Before accepting that, rule out three bugs: differencing applied and never inverted, a horizon longer than the seasonal history supports, and features available at training time but absent at forecast time. A naive-baseline comparison settles which case you are in.
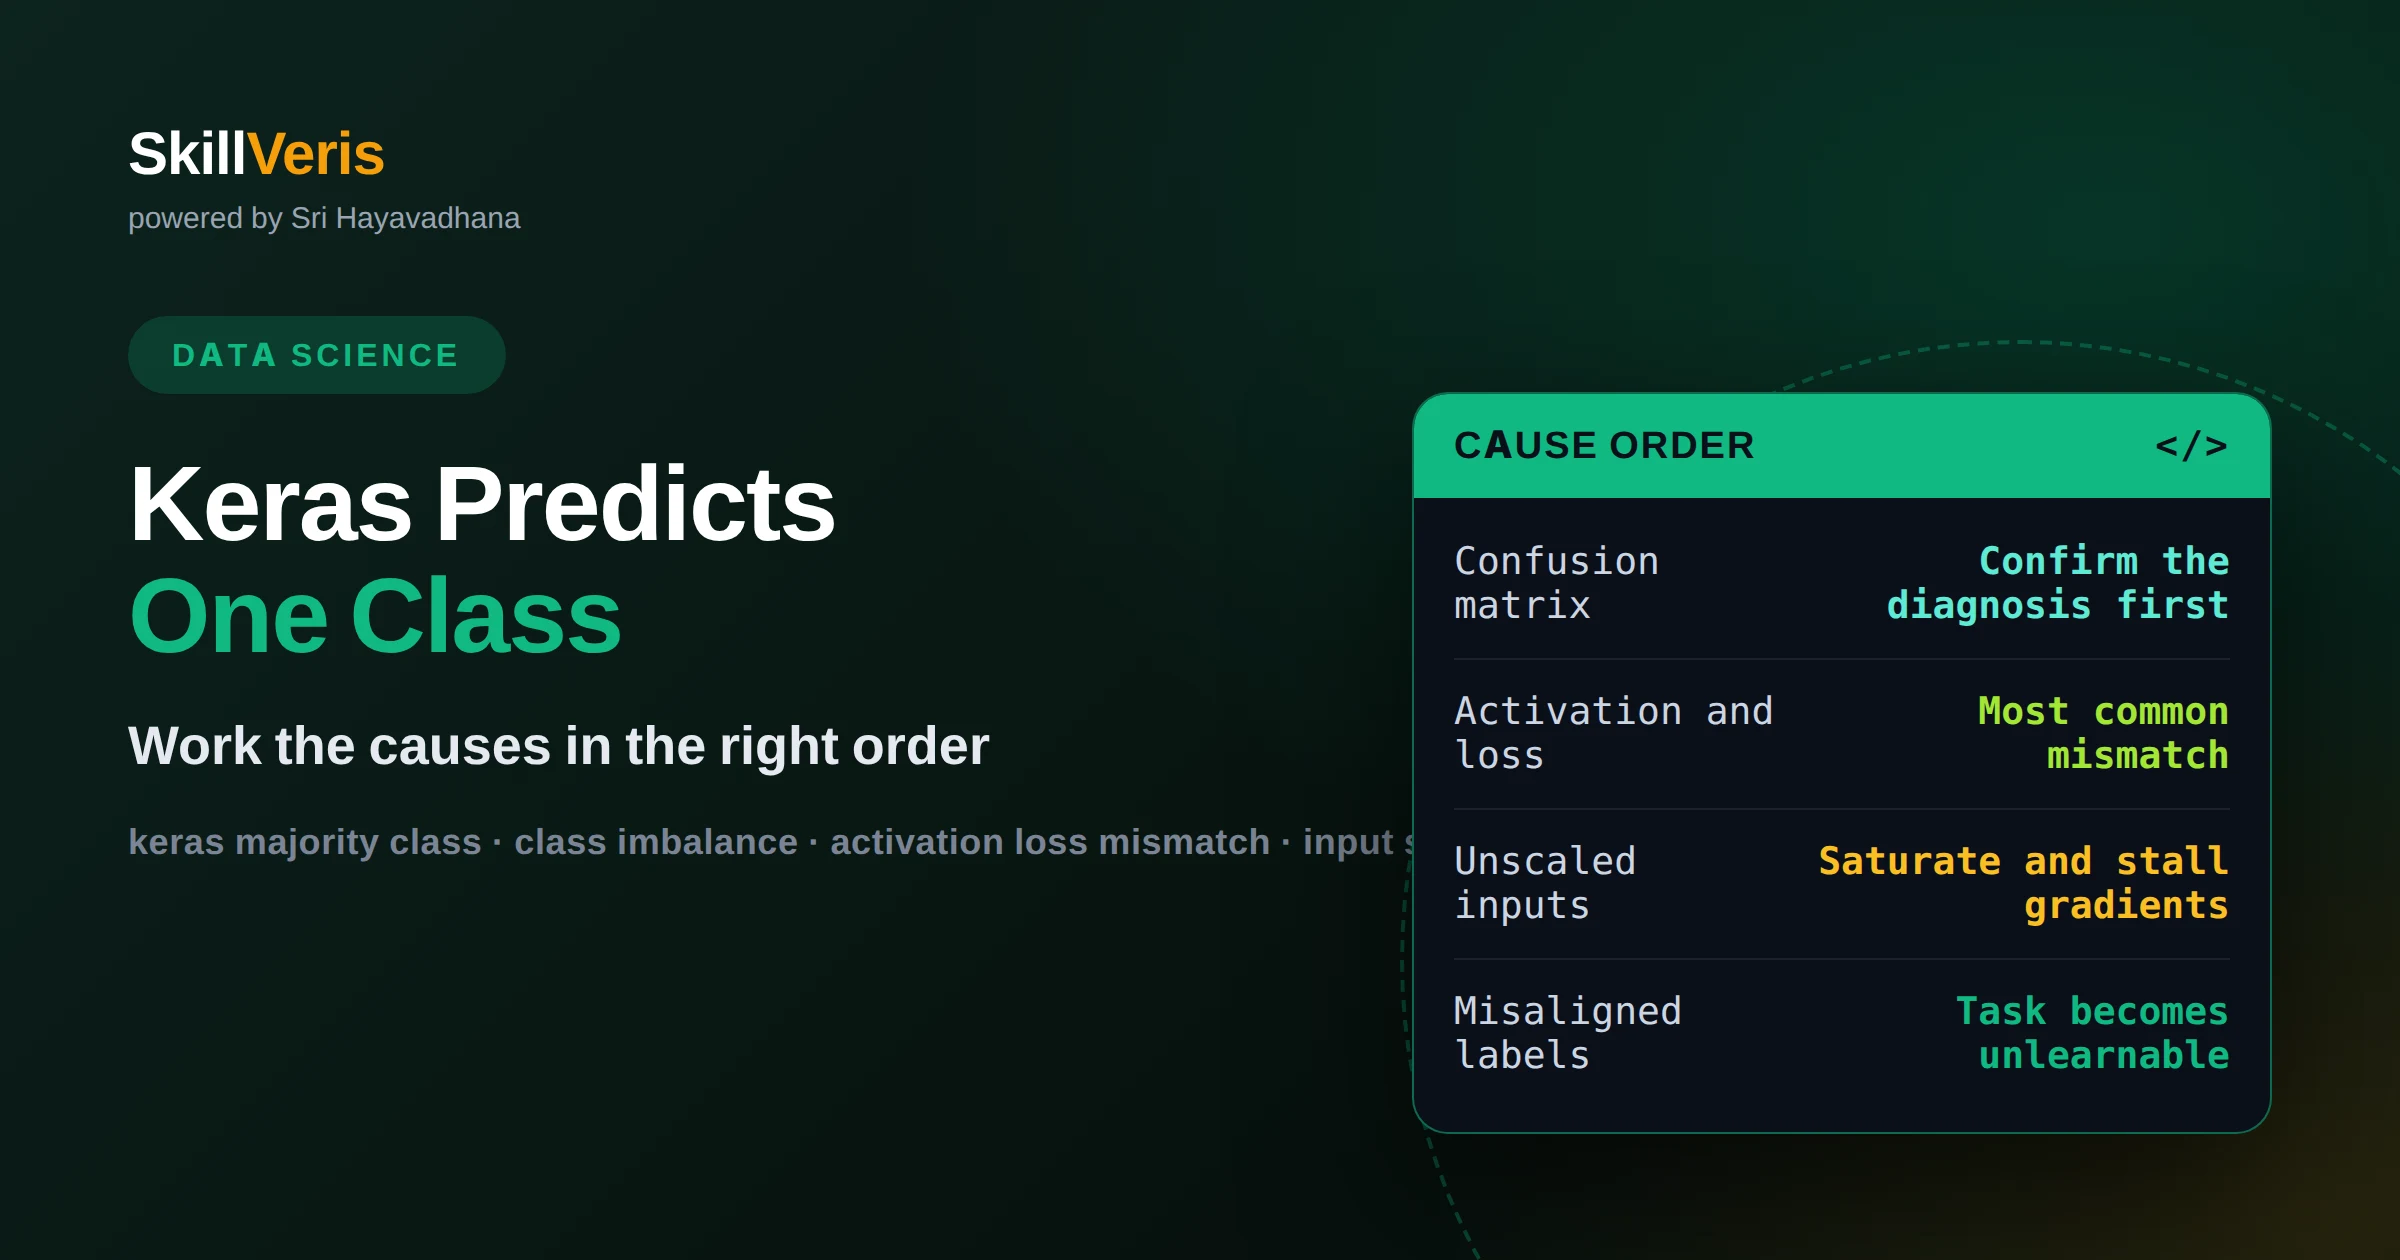
Why your Keras model predicts one class for everything
A model that outputs the majority class for every input has collapsed to the prior, and there are five likely causes. Check the confusion matrix first, then class balance, the activation and loss pairing, input scaling, the learning rate, and label alignment — in that order.
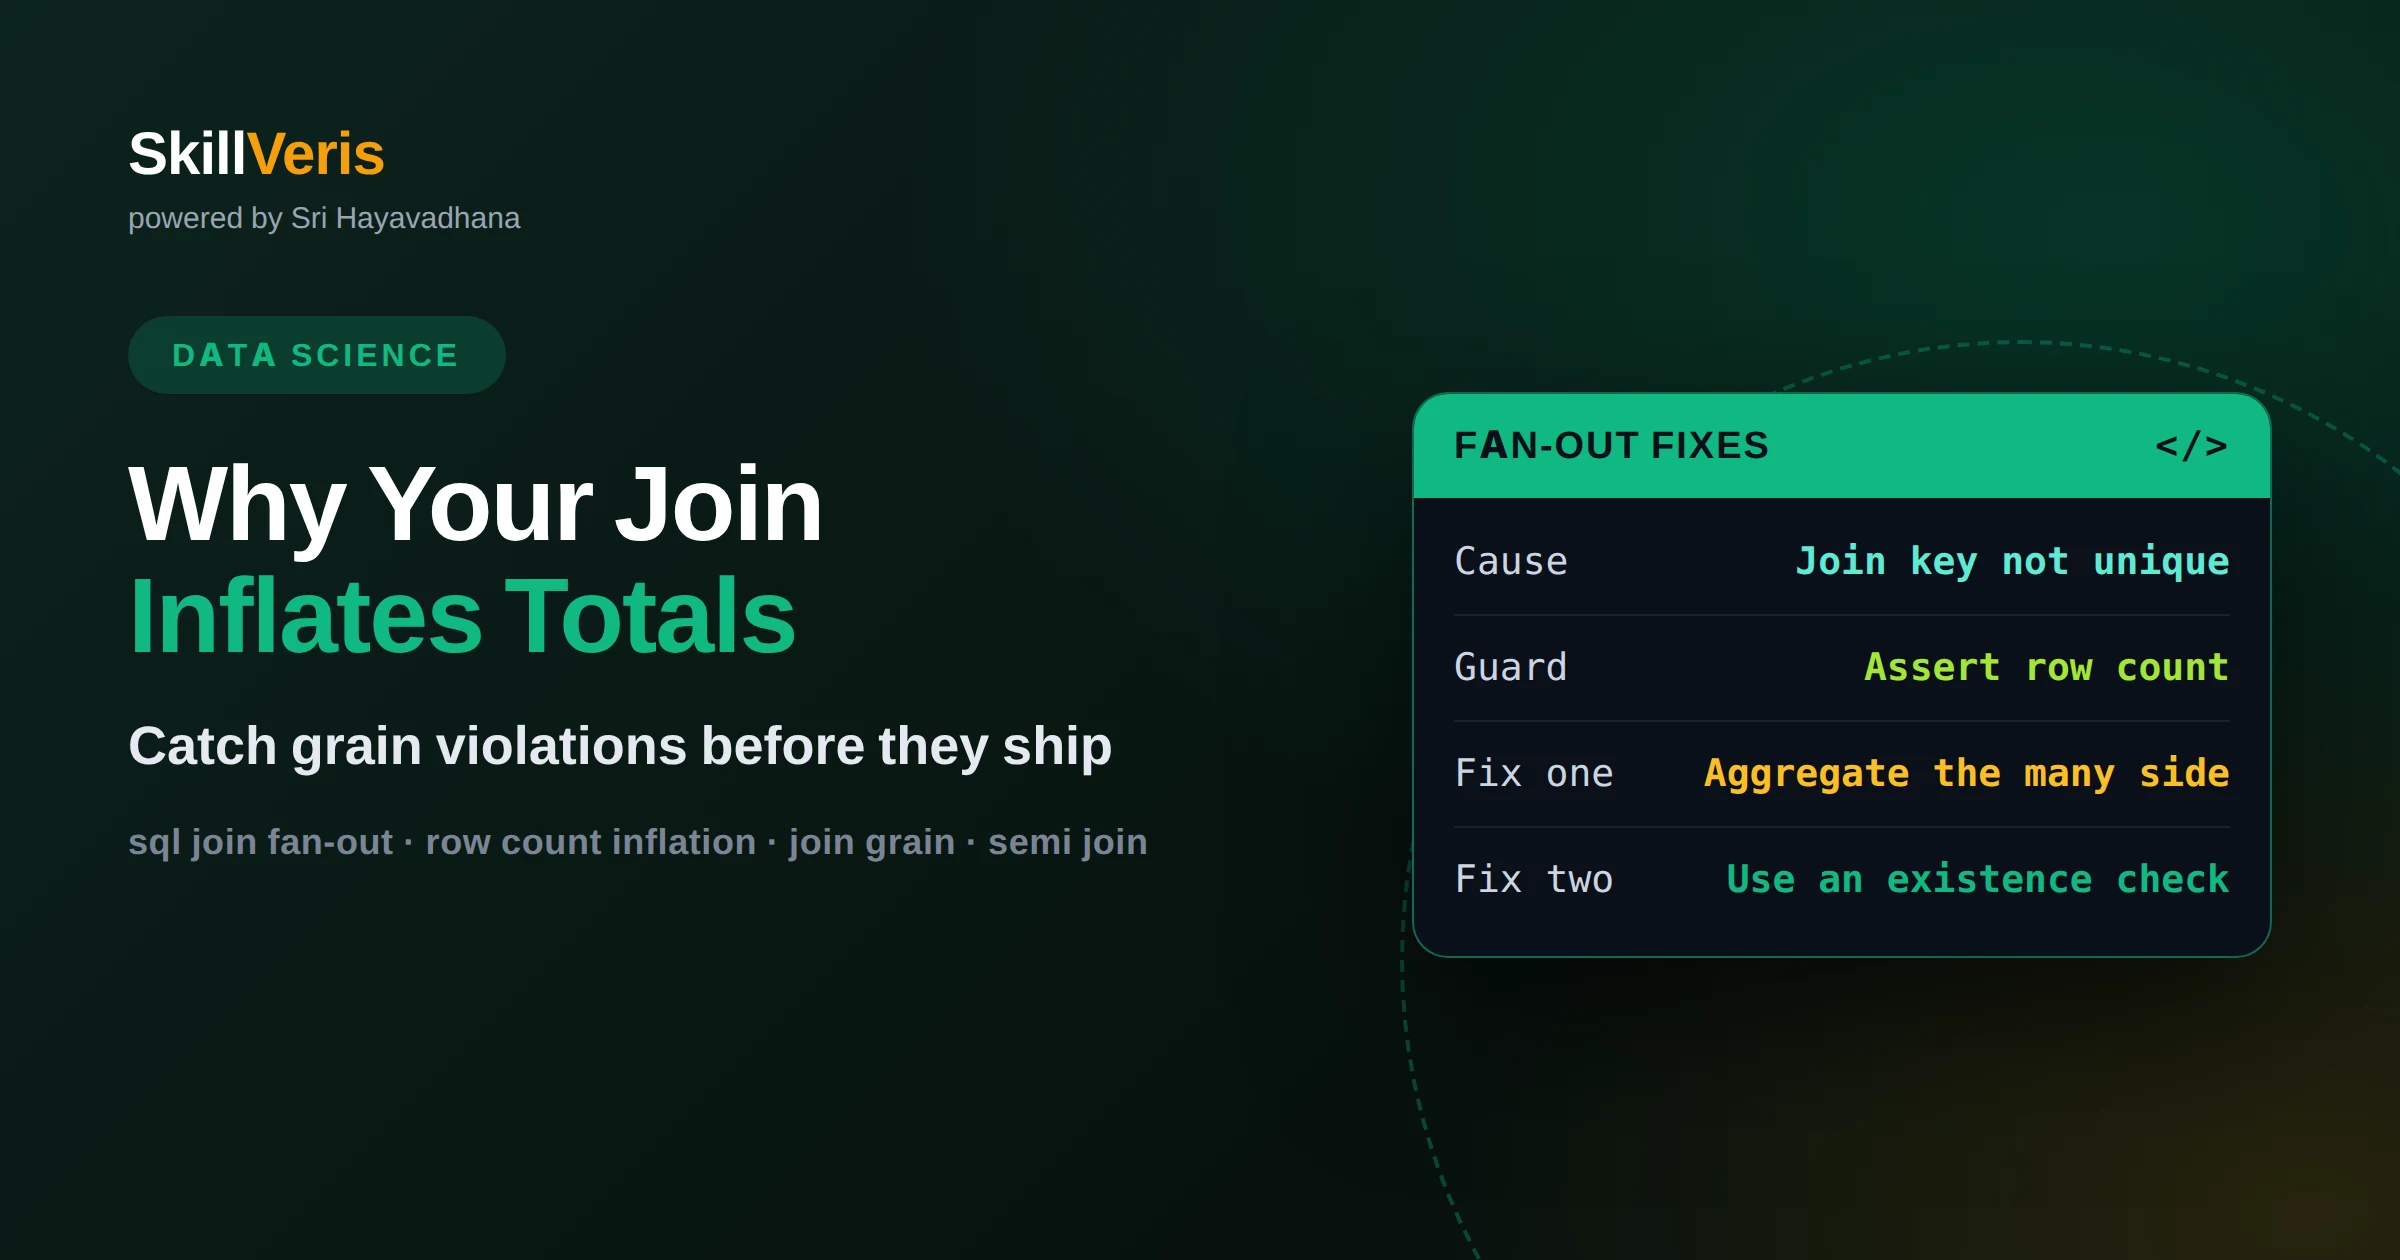
Why your SQL join inflates the totals, and how to catch it
Inflated totals after adding a join are always a grain violation: the joined table is not unique on the join key, so rows fan out and every sum is multiplied. Check uniqueness before joining, guard the row count across the join, and fix it by aggregating first, using a semi join, or redefining the metric.