Logistic Regression: Classification Made Simple
SkillVeris Team
Data Science Team
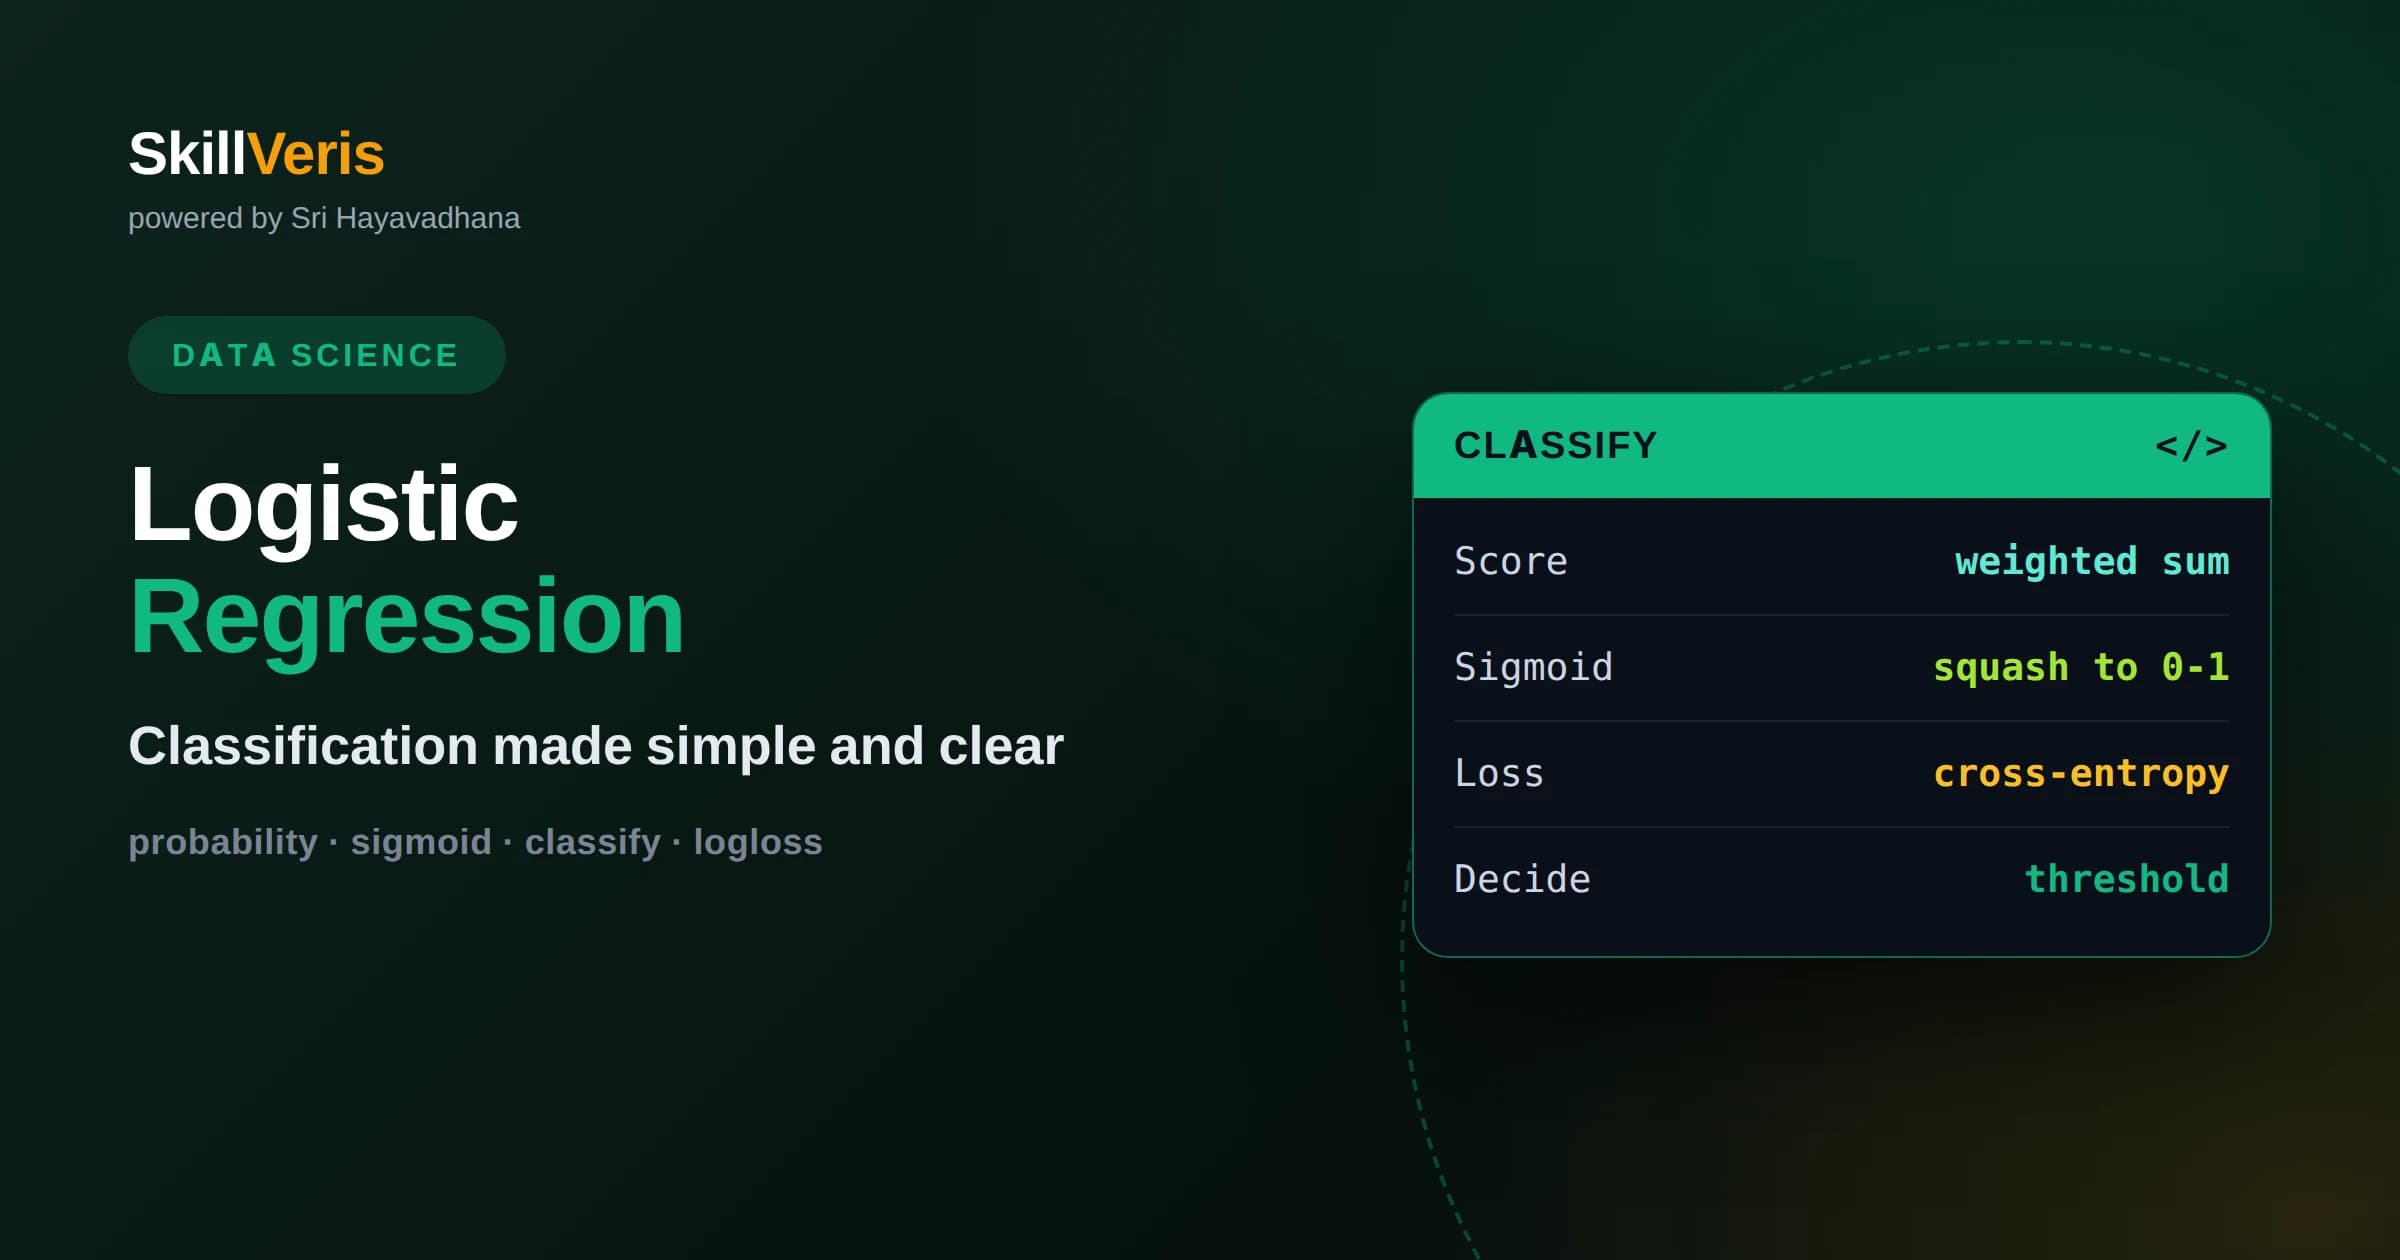
Logistic regression predicts the probability that an input belongs to a class, then decides using a threshold.
In this guide, you'll learn:
- It reshapes a linear score into a value between zero and one using the sigmoid function.
- It learns by minimizing cross-entropy, which rewards confident correct answers and punishes confident wrong ones.
- Its coefficients stay interpretable, telling you how each feature shifts the odds of the outcome.
1What Logistic Regression Does
Logistic regression is a classification method that predicts the probability an input belongs to a particular class, then turns that probability into a decision. Despite the word regression in its name, it answers yes-or-no style questions such as whether an email is spam or a transaction is fraud. It is the standard first model for binary classification.
The key shift from linear regression is the output. Instead of predicting an unbounded number, logistic regression predicts a probability between zero and one. You then apply a threshold, commonly one half, to convert that probability into a class label, though the threshold can be tuned for your needs.
Like linear regression, it is fast, interpretable, and often a strong baseline that harder-to-explain models struggle to beat by much. That combination keeps it in constant use across industry, and it is the natural next step after understanding linear regression. Many production systems that appear sophisticated are, at their core, a well-engineered logistic regression, which is a testament to how far this simple model can go.
2From a Linear Score to a Probability
Logistic regression starts exactly like linear regression: it computes a weighted sum of the features plus an intercept, producing a single number. On its own that number could be anything, positive or negative, large or small, which is not yet a probability.
The trick is to pass that linear score through a squashing function that maps any number onto the range zero to one. This converts the unbounded score into something you can interpret as the probability of the positive class, while preserving the ordering: higher scores yield higher probabilities.
So the model has two conceptual stages. First a linear combination captures how the features push toward or away from the class, and then a transformation turns that push into a calibrated probability. Understanding this two-step structure demystifies the whole method.
3The Sigmoid Function
The squashing function is called the sigmoid, and it has a characteristic S-shape. Large positive inputs map to values near one, large negative inputs map to values near zero, and an input of zero maps to exactly one half. This smooth curve is what gives logistic regression its probabilistic output.
The sigmoid's shape matters. Near the middle it is steep, so small changes in the score change the probability a lot, while at the extremes it flattens, so the model becomes confident and stops moving much. This mirrors how a sensible classifier should behave.
Because the output is a genuine probability, you get more than a label. You get a measure of confidence, which lets you rank cases by risk, set custom thresholds, and make cost-aware decisions rather than treating every prediction as equally certain.
4The Decision Boundary
Applying a threshold to the probability creates a decision boundary, the dividing line between where the model predicts one class versus the other. For logistic regression this boundary is linear, a straight line in two dimensions or a flat plane in more, because the underlying score is a linear combination of features.
This means logistic regression separates classes well when they are roughly linearly separable, meaning a straight boundary can divide them reasonably. When the true boundary is curved, a plain logistic regression will underfit unless you engineer features that let it bend.
Moving the threshold slides the boundary and changes the trade-off between catching positives and avoiding false alarms. A lower threshold flags more cases as positive, catching more true positives but also more false ones. Choosing the threshold is a decision about which errors you can tolerate.
5Learning With Cross-Entropy Loss
Logistic regression cannot use squared error the way linear regression does, because probabilities call for a different measure of wrongness. It uses cross-entropy loss, also called log loss, which measures how surprised the model is by the true answer given its predicted probability.
The loss is small when the model assigns high probability to the correct class and grows sharply when it is confidently wrong. Predicting a probability near zero for something that turns out true incurs a huge penalty. This asymmetry pushes the model toward being calibrated, not just correct.
Unlike linear regression, there is no exact formula for the best coefficients here, so logistic regression is trained by gradient descent. The optimizer repeatedly adjusts the weights to reduce cross-entropy, the same iterative learning that powers larger models.
6Interpreting the Coefficients
Logistic regression keeps much of linear regression's interpretability, though the reading is slightly more subtle. Each coefficient describes how its feature changes the log-odds of the positive class. A positive coefficient means larger values of that feature increase the odds of the outcome, and a negative one decreases them.
Exponentiating a coefficient turns it into an odds ratio, which is often easier to communicate: it says how the odds multiply for each one-unit increase in the feature. This framing is popular in fields like medicine, where practitioners want to explain exactly how a risk factor changes an outcome.
As always, interpret with care. The coefficients describe associations in your data, not proven causes, and they depend on which other features are in the model. Still, this transparency is a major reason logistic regression remains trusted where explanations are required.
7Evaluating a Classifier Properly
Accuracy, the fraction of correct predictions, is the obvious metric but often the wrong one. On imbalanced data where one class is rare, a model that always predicts the majority can score high while being useless. You need metrics that reflect the errors you actually care about.
Precision measures how many of the predicted positives are truly positive, while recall measures how many of the actual positives the model caught. There is usually a trade-off between them, and the F1 score combines them into one number when you want a single summary that respects both.
The confusion matrix underlies all of these by laying out true positives, false positives, true negatives, and false negatives. Reading it directly is the clearest way to understand where a classifier succeeds and where it fails, which numbers alone can obscure.
8ROC Curves and Threshold Choice
Because logistic regression outputs probabilities, you can evaluate it across all possible thresholds rather than just one. The ROC curve plots the true positive rate against the false positive rate as the threshold varies, showing the full range of trade-offs the model offers.
The area under this curve, often called AUC, summarizes how well the model separates the two classes regardless of threshold. A value near one means excellent separation, while a value near one half means the model is no better than guessing. It is a threshold-independent way to compare classifiers.
Choosing the operating threshold is a business decision, not a purely technical one. In fraud detection you might accept many false alarms to catch more fraud, while in a spam filter you might do the opposite. The probability output gives you the freedom to make that choice deliberately.
9Extending to More Than Two Classes
Plain logistic regression handles two classes, but real problems often have more. The standard extension, sometimes called softmax or multinomial logistic regression, generalizes the idea to output a probability for each of several classes that together sum to one.
An alternative strategy trains several binary classifiers, one for each class against all the others, and picks the class whose model is most confident. Libraries handle these extensions automatically, so moving from two classes to many is usually a simple configuration change.
The interpretability carries over with a little more bookkeeping, since each class now has its own set of coefficients. The core intuition, linear scores turned into probabilities, remains exactly the same, which is why mastering the binary case pays off immediately.
10Regularization and Feature Preparation
Logistic regression can overfit, especially with many features, so regularization is applied just as in linear regression. A penalty on large coefficients keeps the model from chasing noise and generally improves how it generalizes to new data. Many library implementations turn regularization on by default.
Feature preparation matters too. Categorical variables need encoding, and scaling numeric features helps the optimizer converge and makes regularization fair across features on different scales. Neglecting scaling can slow training and distort which features the penalty affects most.
As with linear regression, the model only captures curved relationships if you engineer features that express them. Adding interaction or polynomial terms lets a logistic model bend its otherwise straight decision boundary when the data demands it.
11When Logistic Regression Is the Right Tool
Use logistic regression when you need to classify into categories and value speed, interpretability, and calibrated probabilities. It is an excellent baseline for almost any classification task and frequently competitive with far more complex models on tabular data, especially when the classes are roughly linearly separable.
It is particularly valuable when you must explain decisions, because its coefficients and odds ratios translate into plain language. That makes it a favorite in regulated settings where a model's reasoning has to be defensible.
When the decision boundary is deeply nonlinear and hard to engineer around, tree-based methods or neural networks may outperform it. But even then, logistic regression provides the baseline and the conceptual foundation, so it is rarely wasted effort.
12The Value of Probabilities Over Labels
A subtle strength of logistic regression is that it hands you a probability, not just a label. Many models can output a class, but a calibrated probability tells you how confident the model is, and that extra information changes what you can do with the prediction. It turns a blunt yes-or-no into a graded assessment of risk.
Probabilities let you rank cases, which is often what a business actually needs. A fraud team may only have capacity to review a fixed number of transactions per day, so ranking every transaction by its predicted risk and reviewing the riskiest is far more useful than a raw label that says nothing about priority.
They also enable cost-sensitive decisions. When a false negative is far more expensive than a false positive, you can set the threshold to reflect that asymmetry instead of accepting the default. Because logistic regression is naturally probabilistic, it supports this kind of nuanced, real-world decision making out of the box.
13Handling Imbalanced Classes
Many real classification problems are imbalanced, with the class you care about being rare. Fraud, disease, and defaults are all uncommon by nature. A logistic regression trained naively on such data can learn to favor the majority class heavily, predicting the rare event too seldom to be useful.
Several remedies help. You can weight the classes so mistakes on the rare class cost the model more during training, which pushes it to pay attention. You can also resample the data, either duplicating rare cases or trimming common ones, to present a more balanced picture to the optimizer.
Just as important is lowering the decision threshold below one half so the model flags more cases as positive. Because logistic regression outputs probabilities, you have this dial available, and tuning it against precision and recall is often the simplest and most effective fix for imbalance.
14Master Classification on SkillVeris
Logistic regression clicks once you build one, feed it real data, and study its probabilities and errors yourself. Seeing how the threshold reshapes precision and recall, and how the coefficients map to odds, turns the theory here into practical, durable understanding you can apply anywhere.
SkillVeris provides hands-on lessons that take you through training, evaluating, and tuning classifiers on realistic datasets, then connect logistic regression to the broader toolkit of metrics and models. Working through them gives you the confidence to choose and defend the right classifier for any problem you meet.
Related Reading
Get The Print Version
Download a PDF of this article for offline reading.
About the Publisher
SkillVeris Team
Data Science Team
Our data team shares real-world analytics, ML, and SQL insights grounded in industry practice.
View all postsRelated Posts




Never miss an update
Get the latest tutorials and guides delivered to your inbox.
No spam. Unsubscribe anytime.