Statistics for Data Science: The Essentials
SkillVeris Team
Data Science Team
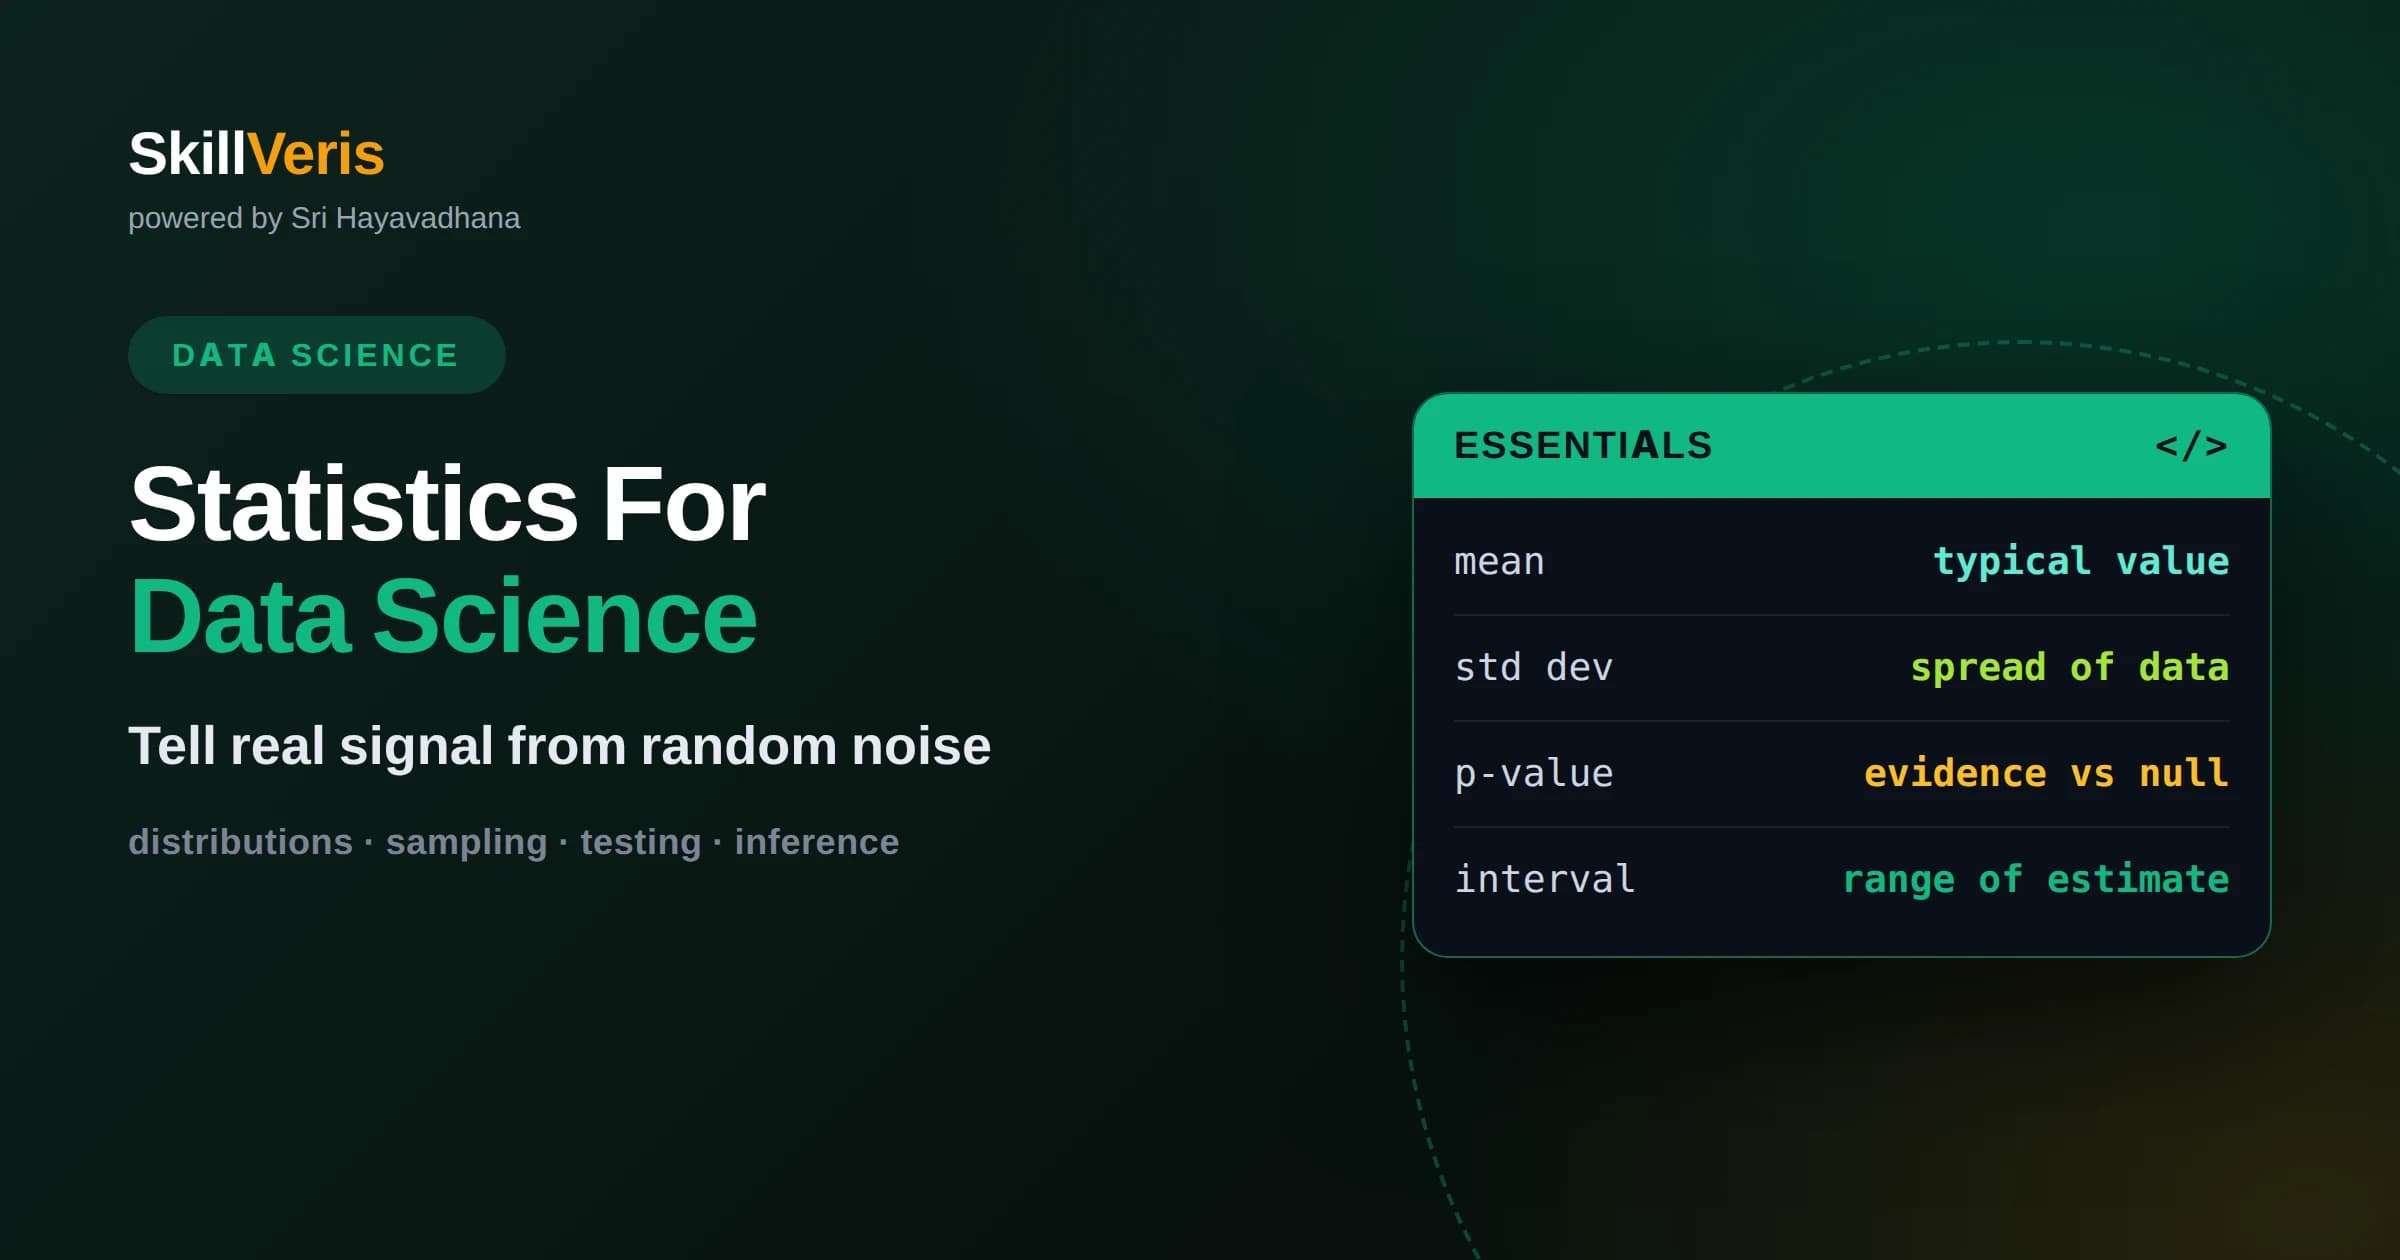
Statistics gives data science its rigor, letting you separate real signal from random noise and quantify how confident you should be.
In this guide, you'll learn:
- Descriptive statistics summarize data, while inferential statistics use a sample to draw conclusions about a larger population.
- Hypothesis testing, confidence intervals, and p-values are tools for judging whether a pattern is likely real or just chance.
- Understanding correlation, variability, and sampling protects you from the most common analytical mistakes.
1Why Statistics Matters For Data Science
Statistics is the discipline that lets data scientists tell real patterns apart from random noise and state how confident they can be in a conclusion. Without it, you are just eyeballing numbers and hoping; with it, you can measure uncertainty, test claims, and make decisions that hold up. Every model evaluation, every A B test, and every honest data story rests on statistical thinking.
The reason is that data is almost always a sample, a limited glimpse of some larger reality, and samples are noisy. Two groups can differ in your data purely by chance even when they are identical in truth. Statistics provides the machinery to ask whether a difference you observe is big enough and consistent enough to be believed, or whether it could easily have arisen from luck alone.
You do not need to be a mathematician to use statistics well in data science. What you need is a solid grasp of a handful of core ideas and the judgment to apply them honestly. This guide walks through those essentials in plain language, building the intuition that makes the formulas meaningful.
2Descriptive Versus Inferential Statistics
Statistics splits into two broad activities. Descriptive statistics summarize the data you actually have, condensing many numbers into a few informative ones like an average or a spread. They answer what does this data look like, making no claims beyond the sample in front of you.
Inferential statistics go further, using a sample to draw conclusions about a larger population you did not fully measure. They answer what can I reasonably conclude about the whole from this part. This leap from sample to population is where uncertainty enters and where the more powerful and more dangerous tools live.
Both halves matter. You almost always start by describing your data to understand it, then move to inference to generalize. Confusing the two is a classic error: reporting a sample average as if it were the exact population truth ignores the uncertainty that inference is designed to quantify.
3Measures Of Center
The most familiar summary is a measure of center, a single number representing the typical value. The mean, or arithmetic average, sums the values and divides by the count. It is intuitive and widely used but sensitive to extreme values, since one enormous outlier can drag the mean far from what most of the data looks like.
The median, the middle value when the data is sorted, resists that problem. Because it depends only on rank, a few extreme values barely move it, which makes it a better summary for skewed data like incomes or house prices. The mode, the most frequent value, is useful for categorical data where averaging makes no sense.
Choosing the right measure of center is a small decision with real consequences. When data is roughly symmetric the mean and median agree and either works. When data is skewed they diverge, and reporting the mean alone can paint a misleading picture. A thoughtful analyst reports the measure that honestly represents the data.
4Measures Of Spread
A center alone hides half the story; you also need to know how spread out the data is. Two datasets can share the same mean while one is tightly clustered and the other wildly scattered, and that difference matters enormously. Variance and its square root, the standard deviation, quantify this spread by measuring how far values typically sit from the mean.
The standard deviation is especially handy because it is in the same units as the data, so you can say values typically fall within so many units of the average. The range, the gap between the largest and smallest value, and the interquartile range, the spread of the middle half, give complementary views. The interquartile range, like the median, is robust to outliers.
Spread is the foundation of statistical thinking because uncertainty is fundamentally about variability. Nearly every inferential tool works by comparing the size of an effect to the size of the natural variation around it. If you internalize one habit, let it be always asking not just what is the typical value but how much does it vary.
5Probability Distributions
A probability distribution describes how likely different values are for a variable. Picturing your data's distribution, often through a histogram, tells you far more than any single summary number, revealing where values cluster, how symmetric they are, and whether extreme values are common or rare.
The normal distribution, the familiar bell curve, is central because many natural quantities approximate it and because it underpins much of statistical theory. In a normal distribution most values sit near the mean and become rarer the farther out you go, in a predictable way. But not everything is normal; income is skewed, counts of rare events follow their own patterns, and assuming normality where it does not hold leads to wrong conclusions.
Recognizing the shape of your data is a practical skill. Before applying any method that assumes a particular distribution, look at the data and check whether that assumption is reasonable. Many analytical mistakes trace back to forcing a method built for one shape onto data of another.
6Sampling And The Central Limit Theorem
In practice you rarely measure an entire population, so you work with a sample and hope it represents the whole. The quality of that representation depends on how the sample was drawn. Random sampling, where every member has an equal chance of selection, is the gold standard because it avoids systematic bias. A convenient but skewed sample can mislead no matter how large it is.
The central limit theorem is one of the most useful results in all of statistics. It says that if you take many samples and compute the average of each, those averages tend to follow a normal distribution, regardless of the shape of the original data, as long as the samples are large enough. This is why so many methods rely on the normal distribution even when the underlying data is not normal.
The practical payoff is that averages are well-behaved and predictable, which lets you attach uncertainty to a sample mean and reason about how far it might sit from the true population value. Much of inferential statistics rests quietly on this theorem.
7Probability Basics
Probability is the language of uncertainty, expressing how likely an event is on a scale from zero, impossible, to one, certain. A firm grip on a few probability ideas prevents many reasoning errors. Independence, for instance, means one event does not affect another, and wrongly assuming independence is a frequent source of mistaken conclusions.
Conditional probability, the chance of one event given that another has occurred, is where intuition often fails. People routinely confuse the probability of a test being positive given a disease with the probability of the disease given a positive test, and these can be wildly different when the disease is rare. Being careful about which conditional you actually mean is a skill that repays itself constantly in data work.
You do not need heavy probability theory to be effective, but you do need to reason clearly about independence, conditionals, and base rates. These ideas underlie everything from spam filters to medical testing to the way models estimate likelihoods.
8Hypothesis Testing
Hypothesis testing is a formal way to decide whether an observed effect is likely real or could easily be chance. You start with a null hypothesis, the skeptical default that there is no effect, and ask how surprising your data would be if that null were true. If the data would be very surprising under the null, you have evidence against it.
The classic example is comparing two groups, such as two versions of a web page. The null hypothesis says they perform equally; the test asks whether the difference you observed is larger than random variation would comfortably produce. The logic is deliberately conservative: you assume no effect until the evidence is strong enough to overturn that assumption.
Hypothesis testing is powerful but easy to abuse. Running many tests until one comes up significant, or peeking at results repeatedly and stopping when they look good, manufactures false positives. Using it honestly means deciding your test in advance and interpreting the outcome with care rather than hunting for a result you want.
9Understanding P-Values
A p-value is the probability of seeing data at least as extreme as yours if the null hypothesis were true. A small p-value means your data would be unlikely under the assumption of no effect, which counts as evidence against that assumption. A common threshold treats a p-value below a chosen small cutoff as statistically significant.
P-values are among the most misunderstood ideas in statistics. A p-value is not the probability that the null hypothesis is true, and it does not measure the size or importance of an effect. A tiny p-value can accompany a trivially small effect if the sample is huge, and a large p-value does not prove there is no effect, only that you lack strong evidence for one.
The healthy stance is to treat a p-value as one piece of evidence, not a verdict. Pair it with the size of the effect and a confidence interval to judge whether a result is both real and meaningful. Statistical significance and practical importance are different questions, and good analysis keeps them separate.
10Confidence Intervals
A confidence interval expresses uncertainty as a range rather than a single point. Instead of claiming the average is exactly some value, you report a range that is likely to contain the true population value, along with a confidence level such as ninety-five percent. This honestly communicates that your estimate from a sample carries wiggle room.
Confidence intervals are often more informative than p-values because they show both whether an effect is plausibly present and how large it might be. A narrow interval reflects a precise estimate; a wide one signals that the data leaves much uncertain. Reporting intervals encourages readers to think in terms of ranges and plausibility rather than false precision, which is exactly the mindset good statistics cultivates.
11Correlation And Causation
Correlation measures how strongly two variables move together, on a scale from a perfect negative relationship through no relationship to a perfect positive one. It is a workhorse of exploratory analysis, quickly surfacing which variables might be related. But correlation captures only linear, straight-line association and can miss curved relationships entirely.
The essential warning is that correlation does not imply causation. Two variables can move together because one causes the other, because both are driven by some third factor, or by sheer coincidence. Ice cream sales and drowning rates rise together, not because one causes the other but because both increase in summer heat. Confusing correlation with causation is perhaps the single most common and most costly error in data analysis, and establishing genuine causation usually requires a controlled experiment rather than observational data alone.
12Build Your Statistical Intuition
Statistics rewards intuition over memorization, and intuition is built by working with data. Simulate coin flips and watch the central limit theorem emerge, generate two identical groups and see how often chance alone produces a significant difference, or compute a confidence interval and check how often it captures a known truth. These small experiments make abstract ideas concrete.
On SkillVeris you can work through hands-on lessons that turn each of these essentials, from distributions and sampling to hypothesis testing and correlation, into interactive practice with real and simulated data. Building statistical intuition this way gives you the judgment to analyze honestly, avoid the common traps, and trust your own conclusions, which is the foundation every strong data scientist stands on.
Related Reading
Get The Print Version
Download a PDF of this article for offline reading.
About the Publisher
SkillVeris Team
Data Science Team
Our data team shares real-world analytics, ML, and SQL insights grounded in industry practice.
View all postsRelated Posts




Never miss an update
Get the latest tutorials and guides delivered to your inbox.
No spam. Unsubscribe anytime.