SQL for Data Analytics: Complete Guide
SkillVeris Team
Data Science Team
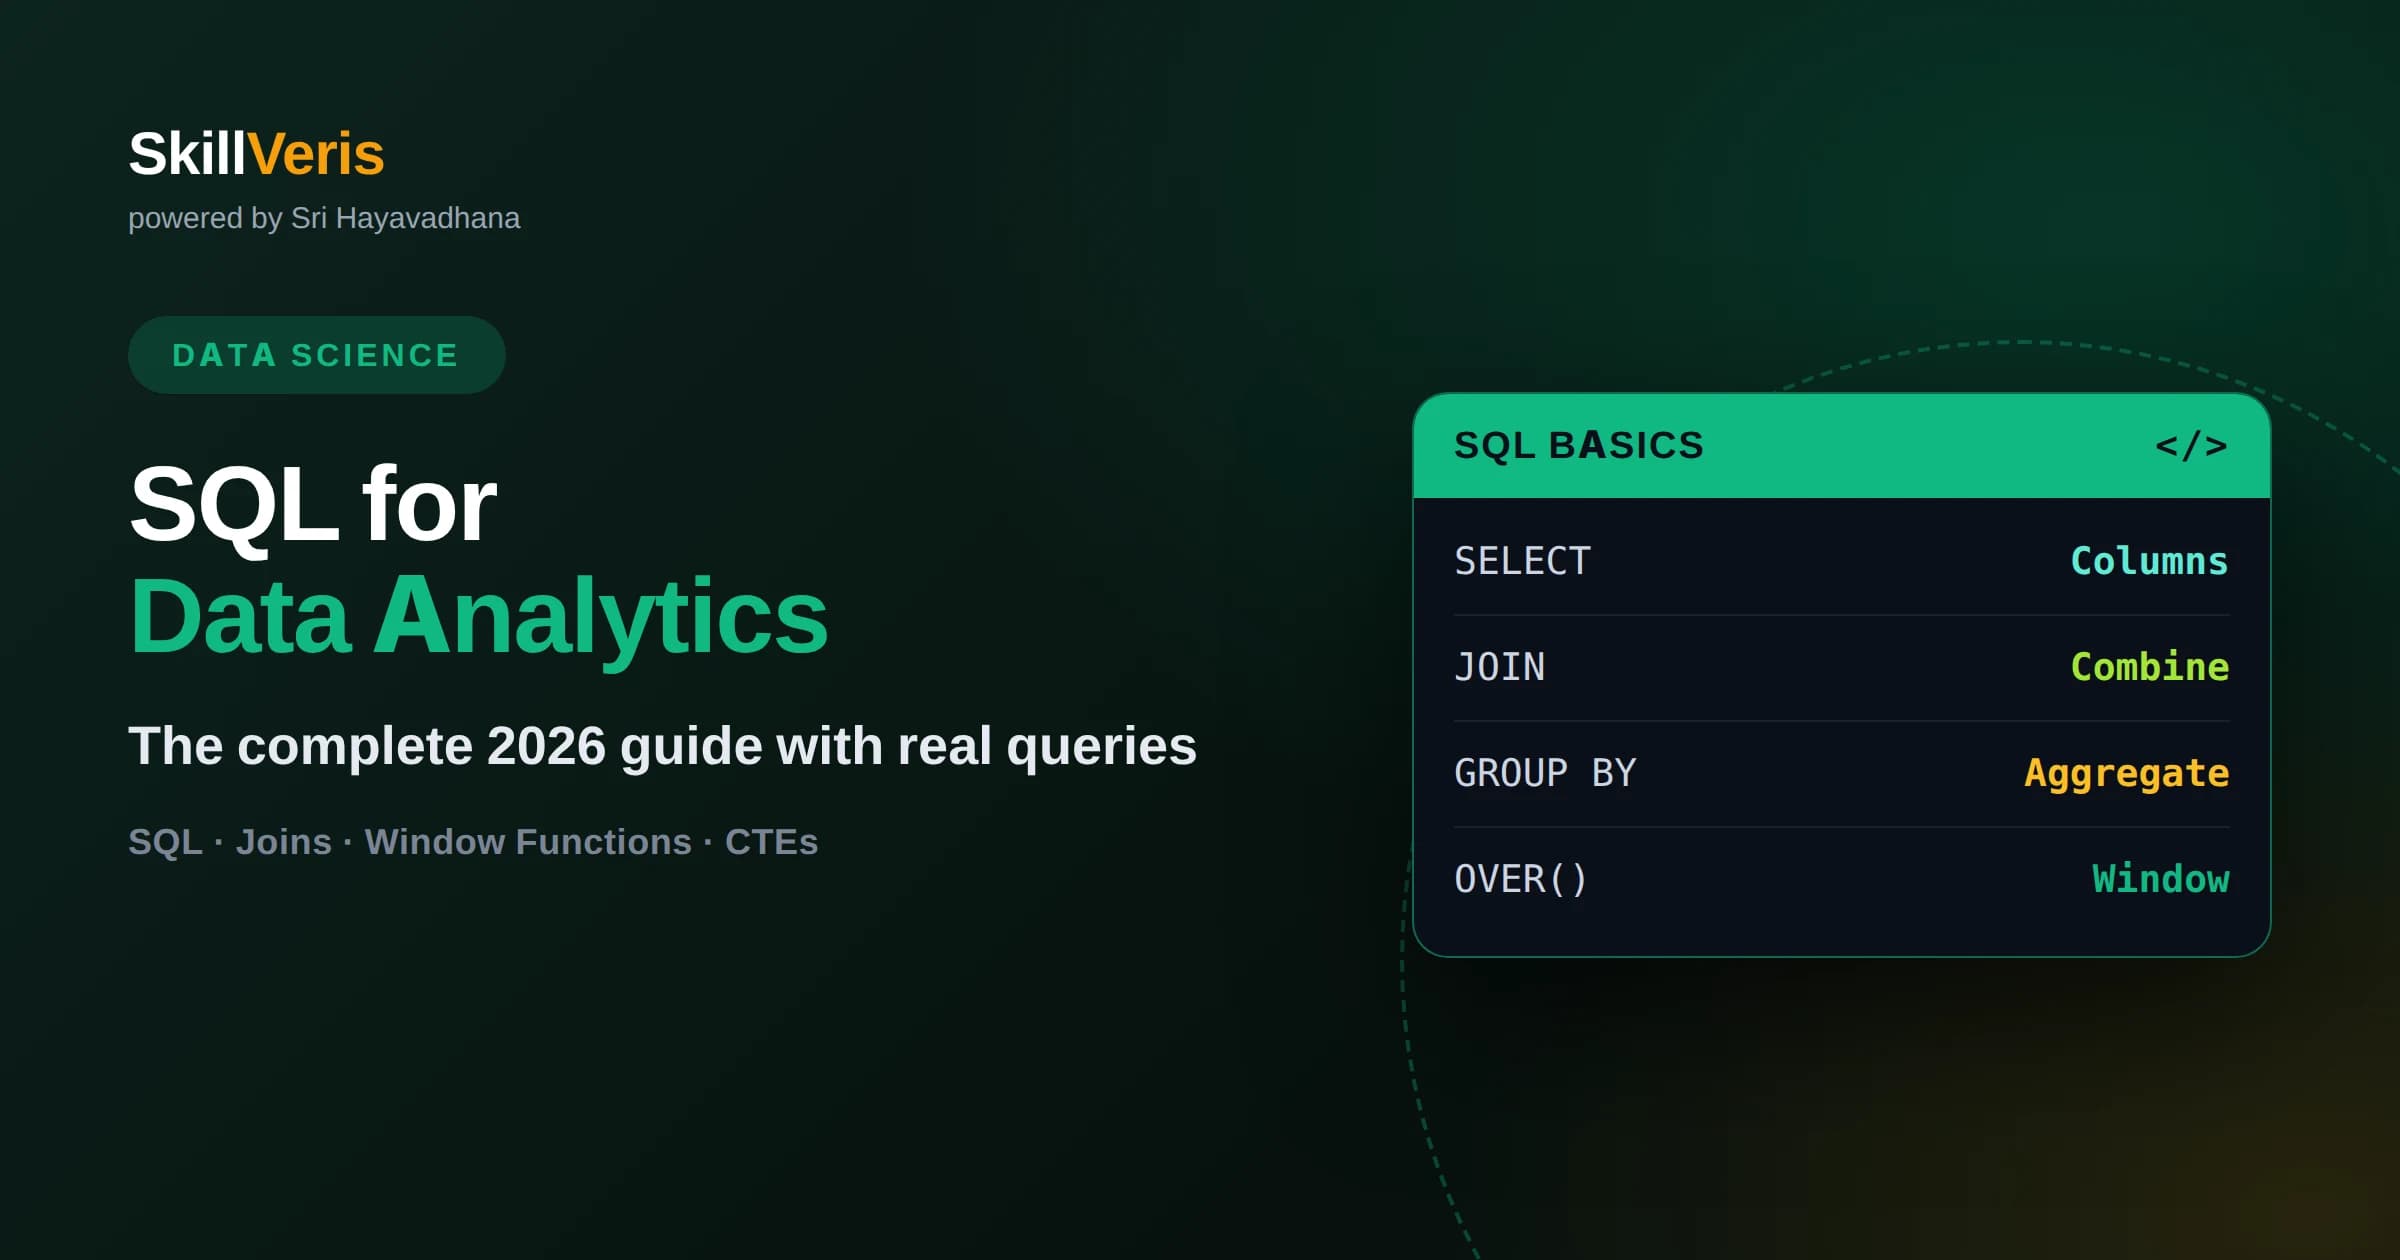
SQL remains the primary language analysts use to query, aggregate, and reshape relational data before it reaches a dashboard.
In this guide, you'll learn:
- The SELECT-FROM-WHERE-GROUP BY-ORDER BY sequence is the backbone of nearly every analytics query you will ever write.
- JOINs let you combine data spread across multiple tables, such as orders and customers, into a single analyzable result.
- Window functions like ROW_NUMBER, RANK, and SUM OVER compute running totals and rankings without collapsing rows the way GROUP BY does.
- Common Table Expressions (CTEs) break complex multi-step logic into named, readable blocks instead of deeply nested subqueries.
1What Is SQL for Data Analytics and Why Does It Still Matter in 2026?
SQL for data analytics is the practice of using Structured Query Language to retrieve, filter, aggregate, and join data stored in relational databases so analysts can answer business questions directly from raw tables.
Despite the rise of no-code BI tools and AI assistants that can write queries on your behalf, SQL has not been displaced — it has become more important. Every data warehouse, every BI tool, and every AI-generated query ultimately compiles down to SQL running against a relational engine, so understanding the language yourself is what lets you verify, debug, and extend what those tools produce.
This guide is a complete, practical SQL tutorial built for people who want to learn SQL for data analysis specifically, not software engineering. We will move through filtering and sorting, aggregation, joins, window functions, and CTEs, with real, annotated SQL queries examples at each stage that mirror the questions analysts actually get asked at work.
2SELECT, WHERE, and ORDER BY: The Foundation of Every Query
Every analytics query starts by choosing which columns you want, filtering to the rows that matter, and ordering the result so it's readable — that is exactly what SELECT, WHERE, and ORDER BY do together.
SELECT defines the columns returned. WHERE filters rows before any aggregation happens, using comparison operators (=, !=, >, <), logical operators (AND, OR, NOT), and pattern matching (LIKE, IN, BETWEEN). ORDER BY controls the sequence of the final result, ascending by default or descending with DESC.
A typical analyst query looks like this: SELECT customer_id, order_date, total_amount FROM orders WHERE order_date >= '2026-01-01' AND total_amount > 100 ORDER BY total_amount DESC LIMIT 20. This pulls the 20 largest orders placed since the start of the year, which is a common first step when investigating revenue spikes or auditing high-value transactions.
- WHERE filters raw rows; HAVING filters after aggregation — mixing these up is one of the most common beginner mistakes
- LIMIT (or TOP/FETCH FIRST depending on the engine) caps result size, which matters when exploring huge tables
- IS NULL and IS NOT NULL are required for null checks — '= NULL' never matches anything
- Combine multiple conditions with parentheses to avoid ambiguous AND/OR precedence
3Aggregations and GROUP BY: Turning Rows into Insight
GROUP BY answers questions like 'how much per category' or 'how many per month' by collapsing many rows into one summary row per group, computed with aggregate functions like SUM, COUNT, AVG, MIN, and MAX.
The pattern is consistent: SELECT the grouping column plus an aggregate, FROM the table, GROUP BY the same non-aggregated column, and optionally filter groups afterward with HAVING. This two-stage filtering — WHERE for rows, HAVING for groups — is what lets you say 'only show categories with more than 50 orders' after the totals are computed.
For example: SELECT category, COUNT(*) AS order_count, SUM(total_amount) AS revenue FROM orders WHERE order_date >= '2026-01-01' GROUP BY category HAVING COUNT(*) > 50 ORDER BY revenue DESC. This is the exact shape of query behind most 'top categories this quarter' reports.
4How Do JOINs Work in SQL Analytics Queries?
JOINs work by matching rows between two or more tables on a shared key, such as customer_id, so you can pull related information — like a customer's name — into a query that starts from a different table, like orders.
INNER JOIN returns only rows with a match in both tables. LEFT JOIN returns every row from the left table plus matches from the right, filling in NULL when there's no match — this is the join analysts reach for most, because it preserves data instead of silently dropping unmatched rows.
Consider a realistic scenario: you have an orders table and a customers table, and you want revenue per customer including customers who signed up but never ordered. SELECT c.customer_name, COALESCE(SUM(o.total_amount), 0) AS lifetime_value FROM customers c LEFT JOIN orders o ON c.customer_id = o.customer_id GROUP BY c.customer_name ORDER BY lifetime_value DESC. Using INNER JOIN here would silently exclude customers with zero orders, which is a common and costly analytics bug.
- INNER JOIN: only matching rows in both tables
- LEFT JOIN: all rows from the left table, matched or not
- FULL OUTER JOIN: all rows from both tables, matched or not (not supported in every engine, e.g. MySQL)
- Always join on indexed, correctly typed keys — mismatched types silently return zero matches instead of an error
5What Are Window Functions and When Should You Use Them?
Window functions calculate a value across a set of related rows — like a running total or a rank — while still returning every individual row, which is exactly what GROUP BY cannot do since it collapses rows into one per group.
The syntax adds OVER (PARTITION BY ... ORDER BY ...) after a function. PARTITION BY defines the 'window' of rows to calculate across (similar to GROUP BY, but without collapsing), and ORDER BY within OVER controls running calculations like cumulative sums or sequential rankings.
A running total of daily revenue: SELECT order_date, daily_revenue, SUM(daily_revenue) OVER (ORDER BY order_date) AS running_total FROM daily_sales. A ranking of customers by spend within each region: SELECT customer_id, region, total_spend, RANK() OVER (PARTITION BY region ORDER BY total_spend DESC) AS regional_rank FROM customer_totals. These two patterns — running totals and partitioned rankings — cover the large majority of window function use cases analysts encounter.
6Why Use CTEs Instead of Nested Subqueries?
CTEs (Common Table Expressions) make multi-step SQL readable by letting you name each intermediate result with WITH, instead of nesting nine layers of subqueries that are nearly impossible to debug or hand off to a teammate.
A CTE is defined with WITH name AS (subquery), and can be referenced later in the main query just like a table. You can chain multiple CTEs, each building on the last, which mirrors how you'd naturally reason through a problem step by step: first compute this, then filter it, then join it.
Example — finding customers whose spending grew month over month: WITH monthly_totals AS (SELECT customer_id, DATE_TRUNC('month', order_date) AS month, SUM(total_amount) AS spend FROM orders GROUP BY customer_id, DATE_TRUNC('month', order_date)), ranked AS (SELECT customer_id, month, spend, LAG(spend) OVER (PARTITION BY customer_id ORDER BY month) AS prev_month_spend FROM monthly_totals) SELECT customer_id, month, spend, prev_month_spend FROM ranked WHERE spend > prev_month_spend. Notice how the CTE names (monthly_totals, ranked) turn a dense calculation into something a colleague can read top to bottom.
7Real SQL Queries Examples Analysts Use Every Day
The queries analysts write daily are rarely exotic — they're combinations of the fundamentals above applied to recurring business questions: retention, conversion, cohort behavior, and anomaly spotting.
Month-over-month active user count: SELECT DATE_TRUNC('month', event_date) AS month, COUNT(DISTINCT user_id) AS active_users FROM events GROUP BY 1 ORDER BY 1. Simple conversion rate between two funnel steps: SELECT COUNT(DISTINCT CASE WHEN event_type = 'purchase' THEN user_id END) * 1.0 / COUNT(DISTINCT CASE WHEN event_type = 'view' THEN user_id END) AS conversion_rate FROM events. A duplicate-row check that every analyst should run before trusting a dataset: SELECT order_id, COUNT(*) FROM orders GROUP BY order_id HAVING COUNT(*) > 1.
These patterns — trend over time, funnel conversion, and data-quality checks — combined with the JOIN, GROUP BY, window function, and CTE techniques above, will cover the overwhelming majority of real analytics work. If you want to go further and pair SQL with Python for statistical analysis, automation, and machine learning workflows, SkillVeris's Python for AI & ML course covers exactly that transition without assuming a data engineering background.
8Frequently Asked Questions
Q: Do I need to learn a specific SQL dialect, like PostgreSQL or MySQL? A: Learn standard SQL (SELECT, JOIN, GROUP BY, window functions) first — it transfers almost unchanged across PostgreSQL, MySQL, SQL Server, Snowflake, and BigQuery; dialect differences mostly show up in date functions and a handful of syntax quirks you can look up as needed.
Q: How long does it take to learn SQL for data analysis? A: Most people can write useful SELECT, WHERE, JOIN, and GROUP BY queries within one to two weeks of regular practice, with window functions and CTEs adding another few weeks to reach comfortable fluency.
Q: What's the difference between WHERE and HAVING? A: WHERE filters individual rows before grouping happens, while HAVING filters aggregated groups after GROUP BY has run — you cannot use an aggregate function like SUM() inside WHERE, which is exactly when HAVING is required.
Q: Is SQL still relevant now that AI tools can write queries automatically? A: Yes — AI-generated SQL still needs a human who can read the query, verify the joins and filters are correct, and catch subtle errors like an unintended fan-out from a one-to-many join, so SQL literacy is what makes AI-assisted analytics trustworthy rather than a black box.
Q: Should I learn SQL or Python first for a data analytics career? A: Learn SQL first, since it's how you'll retrieve and shape data from almost any company's database, then add Python when you need statistical modeling, automation, or machine learning on top of that data.
Q: What's a good way to practice SQL queries beyond tutorials? A: Recreate real analytics questions against a public sample dataset — calculate month-over-month growth, rank top customers per region, and find duplicate records — since practicing the actual question types analysts face builds far more durable skill than isolated syntax drills.
Related Reading
Get The Print Version
Download a PDF of this article for offline reading.
About the Publisher
SkillVeris Team
Data Science Team
Our data team shares real-world analytics, ML, and SQL insights grounded in industry practice.
View all postsRelated Posts




Never miss an update
Get the latest tutorials and guides delivered to your inbox.
No spam. Unsubscribe anytime.