K-Means Clustering Explained for Beginners
SkillVeris Team
Data Science Team
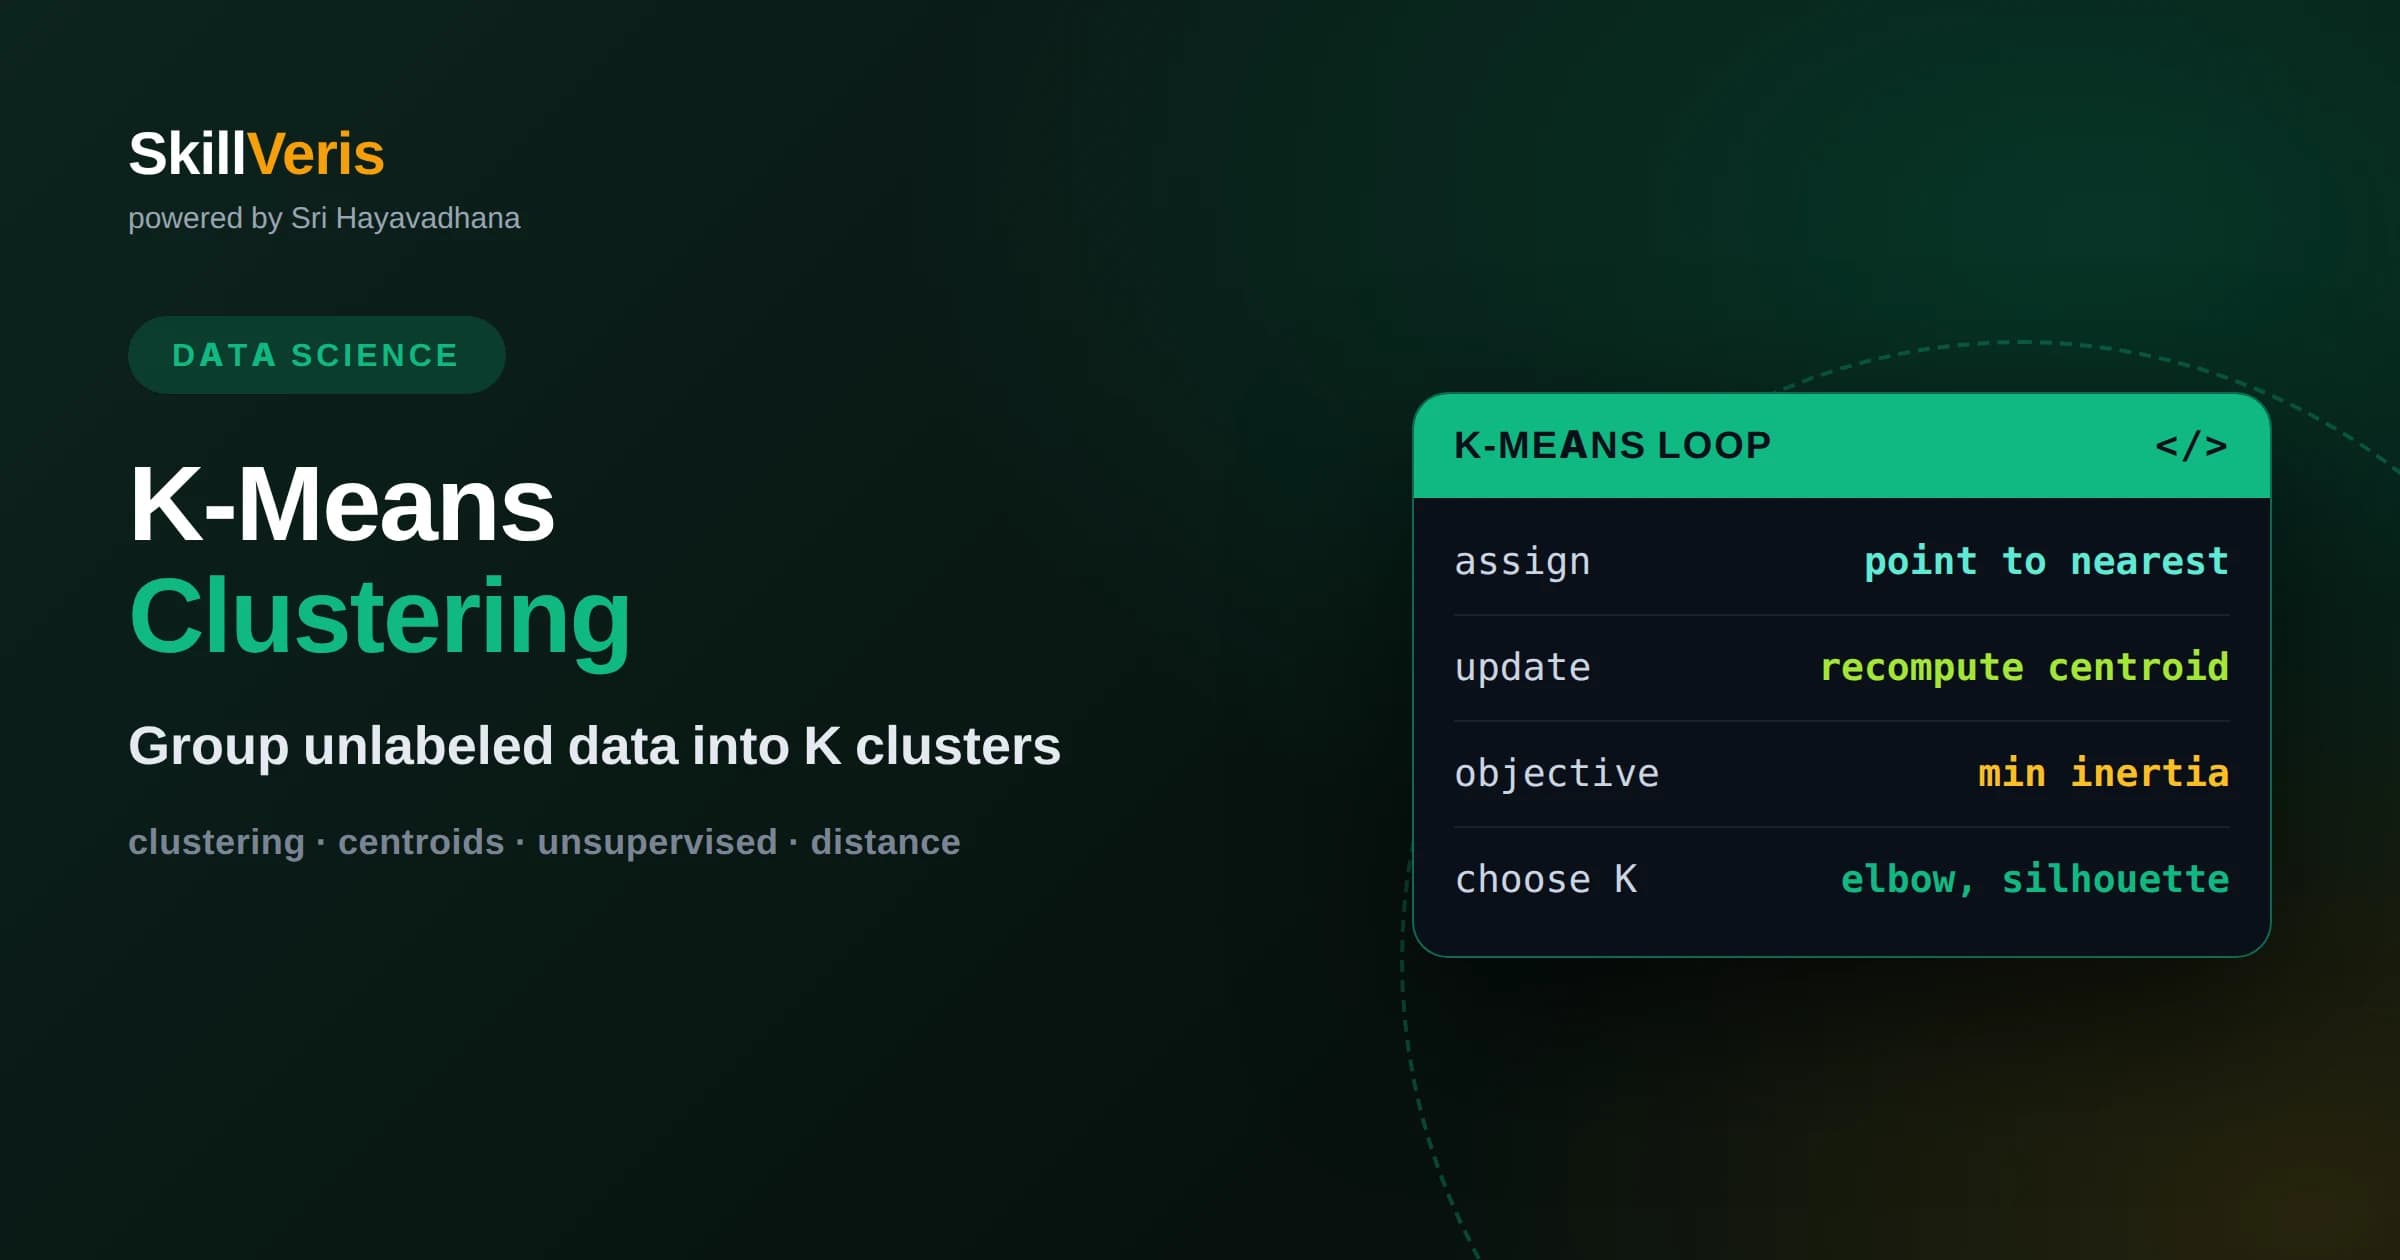
K-means is an unsupervised algorithm that partitions data into K clusters by repeatedly assigning points to the nearest center and recomputing those centers.
In this guide, you'll learn:
- You must choose K in advance, and techniques like the elbow method and silhouette score help you pick a sensible value.
- The algorithm assumes roughly round, similarly sized clusters and is sensitive to feature scaling and initial center placement.
- K-means powers practical tasks like customer segmentation, image color reduction, and anomaly detection when its assumptions hold.
1What Is K-Means Clustering
K-means clustering is an unsupervised machine learning algorithm that divides a dataset into K groups, called clusters, so that points inside each group are as similar as possible while different groups stay as distinct as possible. It does this by finding K center points, called centroids, and assigning every data point to its nearest centroid. Because the data has no labels telling the algorithm what the right answer is, K-means discovers structure on its own.
The name captures the two core ideas. The K is the number of clusters you decide on before running the algorithm. The means refers to how each cluster is represented: by the average, or mean, position of all the points assigned to it. That mean is the centroid, and it acts as the typical or representative example of everything in the cluster.
Think of a shopkeeper who wants to organize a pile of mixed customers into a handful of marketing groups without any predefined categories. K-means looks at the numeric traits of each customer and forms groups where members behave alike. Nobody told the algorithm what the groups mean; it simply found natural gatherings in the data based on distance.
2How The Algorithm Works Step By Step
K-means follows a simple loop that alternates between two steps until it settles. First, it places K centroids somewhere in the data space, often at random positions or at randomly chosen data points. Then it assigns each data point to whichever centroid is closest, usually measured by straight-line Euclidean distance. This assignment step carves the space into K regions.
Next comes the update step. For each cluster, the algorithm recomputes the centroid as the average position of all points currently assigned to it. Moving the centroid to the true middle of its members usually shifts some boundary points closer to a different centroid, so the assignment step runs again. Assignment and update repeat, and with each pass the centroids drift toward the dense middles of natural groups.
The loop stops when assignments no longer change, or when the centroids move less than a tiny threshold, or after a fixed number of iterations. At that point the algorithm has converged. Each convergence gives you K centroids and a label for every point saying which cluster it belongs to.
3The Objective K-Means Tries To Minimize
Under the hood, K-means is minimizing a single quantity often called inertia or within-cluster sum of squares. For every point, you measure the squared distance to its cluster centroid, then add all those squared distances together. A lower total means points sit tightly around their centroids, which is what we want from good clusters.
Each iteration of the assign-and-update loop is guaranteed to lower this total or leave it unchanged, which is why the algorithm always converges to some solution. Understanding the objective explains many of the algorithm's quirks: it favors compact, roughly spherical clusters because squared distance punishes far-flung points heavily, and it can be fooled by clusters that are stretched or oddly shaped.
4Choosing The Value Of K
The biggest decision in K-means is picking K, because the algorithm cannot choose it for you. Set K too low and you merge distinct groups into a blurry blob. Set it too high and you split a single natural group into meaningless fragments. Choosing well is part judgment and part measurement.
The elbow method is the classic starting point. You run K-means for a range of K values, plot the inertia for each, and look for the point where adding another cluster stops giving a big drop in inertia. On the plot this bend looks like an elbow, and the K at the elbow is often a reasonable choice because more clusters beyond it buy little extra tightness.
The silhouette score offers a second opinion. For each point it compares how close that point is to its own cluster versus the nearest other cluster, producing a value between minus one and one. Averaging across all points gives a single number where higher is better. Trying several K values and comparing silhouette scores, alongside the elbow plot and your domain knowledge, usually points to a defensible answer.
5Why Feature Scaling Matters
Because K-means relies entirely on distance, the scale of your features quietly controls the result. Imagine clustering customers by annual spend measured in thousands and by number of visits measured in single digits. The spend numbers are so much larger that distance is dominated by spend, and the visit count barely influences anything. The clusters end up being about spend alone, whether or not that was your intent.
The fix is to standardize or normalize features before clustering so each one contributes comparably. Standardization rescales each feature to have zero mean and unit variance, while min-max normalization squeezes each feature into a fixed range like zero to one. Either way, every feature gets a fair say in the distance calculation. Scaling is not optional polish for K-means; it is a routine step that often changes the clusters entirely.
6The Initialization Problem And K-Means Plus Plus
K-means only guarantees convergence to a local optimum, not the best possible clustering. Where you place the initial centroids strongly influences where the algorithm ends up. Unlucky starting positions can trap it in a poor solution where two centroids share one dense region while a genuine cluster elsewhere goes unrepresented.
Two practical habits address this. First, run the algorithm several times with different random starts and keep the run with the lowest inertia. Second, use a smarter initialization called k-means plus plus, which spreads the initial centroids out by preferentially choosing starting points that are far from ones already chosen. Most modern libraries use k-means plus plus by default, and combining it with multiple restarts makes results far more stable and reliable.
7Strengths Of K-Means
K-means is popular because it is simple, fast, and scales well. Its per-iteration cost grows roughly linearly with the number of points, so it handles large datasets that would overwhelm heavier clustering methods. The results are also easy to explain: each cluster has a centroid you can inspect as a prototype, which makes it straightforward to describe what a group represents.
The algorithm is also flexible about what a feature is, as long as you can express similarity as distance. That makes it a natural first tool to reach for whenever you suspect your data contains a modest number of reasonably compact groups and you want a quick, interpretable partition to build on.
Its speed has a second benefit: it lets you iterate. Because a run finishes quickly, you can try several values of K, several feature sets, and several scalings in the time a heavier method would take for a single fit. That fast feedback loop makes K-means an excellent way to explore your data early, even in cases where you eventually switch to a more specialized method for the final model.
8Limitations And Hidden Assumptions
K-means quietly assumes that clusters are roughly round, similar in size, and similar in density. When those assumptions break, the results mislead. Long, curved, or nested shapes get chopped across their true boundaries, and a small tight cluster sitting next to a large sparse one often gets swallowed or split in unnatural ways.
The algorithm is also sensitive to outliers, because a single extreme point drags a centroid toward it and distorts the whole cluster. And since K is fixed in advance, K-means will always return exactly K clusters even when the natural number is different or when there is no real cluster structure at all. Knowing these limits helps you avoid trusting clusters that are artifacts of the method rather than features of the data.
A further subtlety is that Euclidean distance loses meaning in very high dimensions, where points tend to become almost equally far from one another. On data with many features, plain K-means can struggle, and reducing the dimensionality first, or engineering a smaller set of meaningful features, often produces far cleaner clusters than throwing every column at the algorithm.
9Real-World Applications
Customer segmentation is the textbook use case. Businesses cluster customers by behavior such as purchase frequency, average order value, and recency, then tailor messaging to each resulting group. The centroids give marketers a concise portrait of each segment without labeling anyone by hand.
K-means also shines in image color quantization, where it reduces the thousands of colors in a photo to a small palette by clustering pixel colors and replacing each pixel with its cluster centroid. Other common uses include grouping documents by topic after converting text to numeric vectors, compressing data, and flagging anomalies as points that sit far from every centroid.
10How It Compares To Other Clustering Methods
K-means is one tool among several, and knowing its neighbors helps you choose. Hierarchical clustering builds a tree of nested groups and does not force you to pick K up front, but it is slower and harder to scale. Density-based methods like DBSCAN find clusters of arbitrary shape and can label sparse points as noise, which K-means cannot do, though they demand their own parameter tuning.
Gaussian mixture models generalize K-means by allowing elliptical clusters and giving each point a soft probability of belonging to each cluster rather than a hard assignment. When your clusters are compact and roughly round and you want speed and simplicity, K-means is usually the right starting choice; when they are not, these alternatives are worth reaching for.
11A Practical Workflow For Using K-Means
A dependable workflow starts with exploring and cleaning your data, handling missing values, and removing or capping extreme outliers that would distort centroids. Next, scale your features so distance is fair. These preparation steps do more for cluster quality than any clever tuning later.
Then run K-means across a range of K values, examine the elbow plot and silhouette scores, and shortlist a couple of candidate values. For each candidate, inspect the centroids and a few example members to see whether the clusters make sense in the real world. The best K is the one that is both statistically reasonable and meaningful to a human who understands the domain.
Finally, treat the clustering as a hypothesis rather than a final truth. Validate it by checking whether the groups behave differently on some outcome you did not cluster on, and be ready to revisit your features or your choice of K if the groups do not hold up.
12Common Beginner Mistakes
The most frequent mistake is skipping feature scaling and then wondering why one variable dominates every cluster. Close behind is trusting a single run without multiple restarts, which leaves results at the mercy of random initialization. Both are easy to fix once you know to look for them.
Beginners also tend to read too much meaning into cluster labels. The numbers K-means assigns to clusters are arbitrary and can change between runs; only the groupings matter. And because K-means always returns K clusters, it is tempting to accept its output as proof that structure exists. Always sanity-check whether the clusters are genuinely separated or merely a forced partition of otherwise uniform data.
13Put K-Means Into Practice
The fastest way to understand K-means is to run it yourself on real data and watch the centroids move. Start with a small, two-feature dataset you can plot, so you can literally see the clusters form and the boundaries shift with each iteration. Then repeat the exercise with unscaled and scaled features to feel how much scaling changes the outcome.
On SkillVeris you can work through guided, hands-on lessons that walk you from a single cluster all the way to choosing K, evaluating silhouette scores, and applying clustering to a realistic segmentation problem. Building the intuition through practice, rather than memorizing steps, is what turns K-means from a formula into a tool you can reach for with confidence.
Related Reading
Get The Print Version
Download a PDF of this article for offline reading.
About the Publisher
SkillVeris Team
Data Science Team
Our data team shares real-world analytics, ML, and SQL insights grounded in industry practice.
View all postsRelated Posts




Never miss an update
Get the latest tutorials and guides delivered to your inbox.
No spam. Unsubscribe anytime.