Pandas for Data Analysis: A Complete Guide
SkillVeris Team
Data Science Team
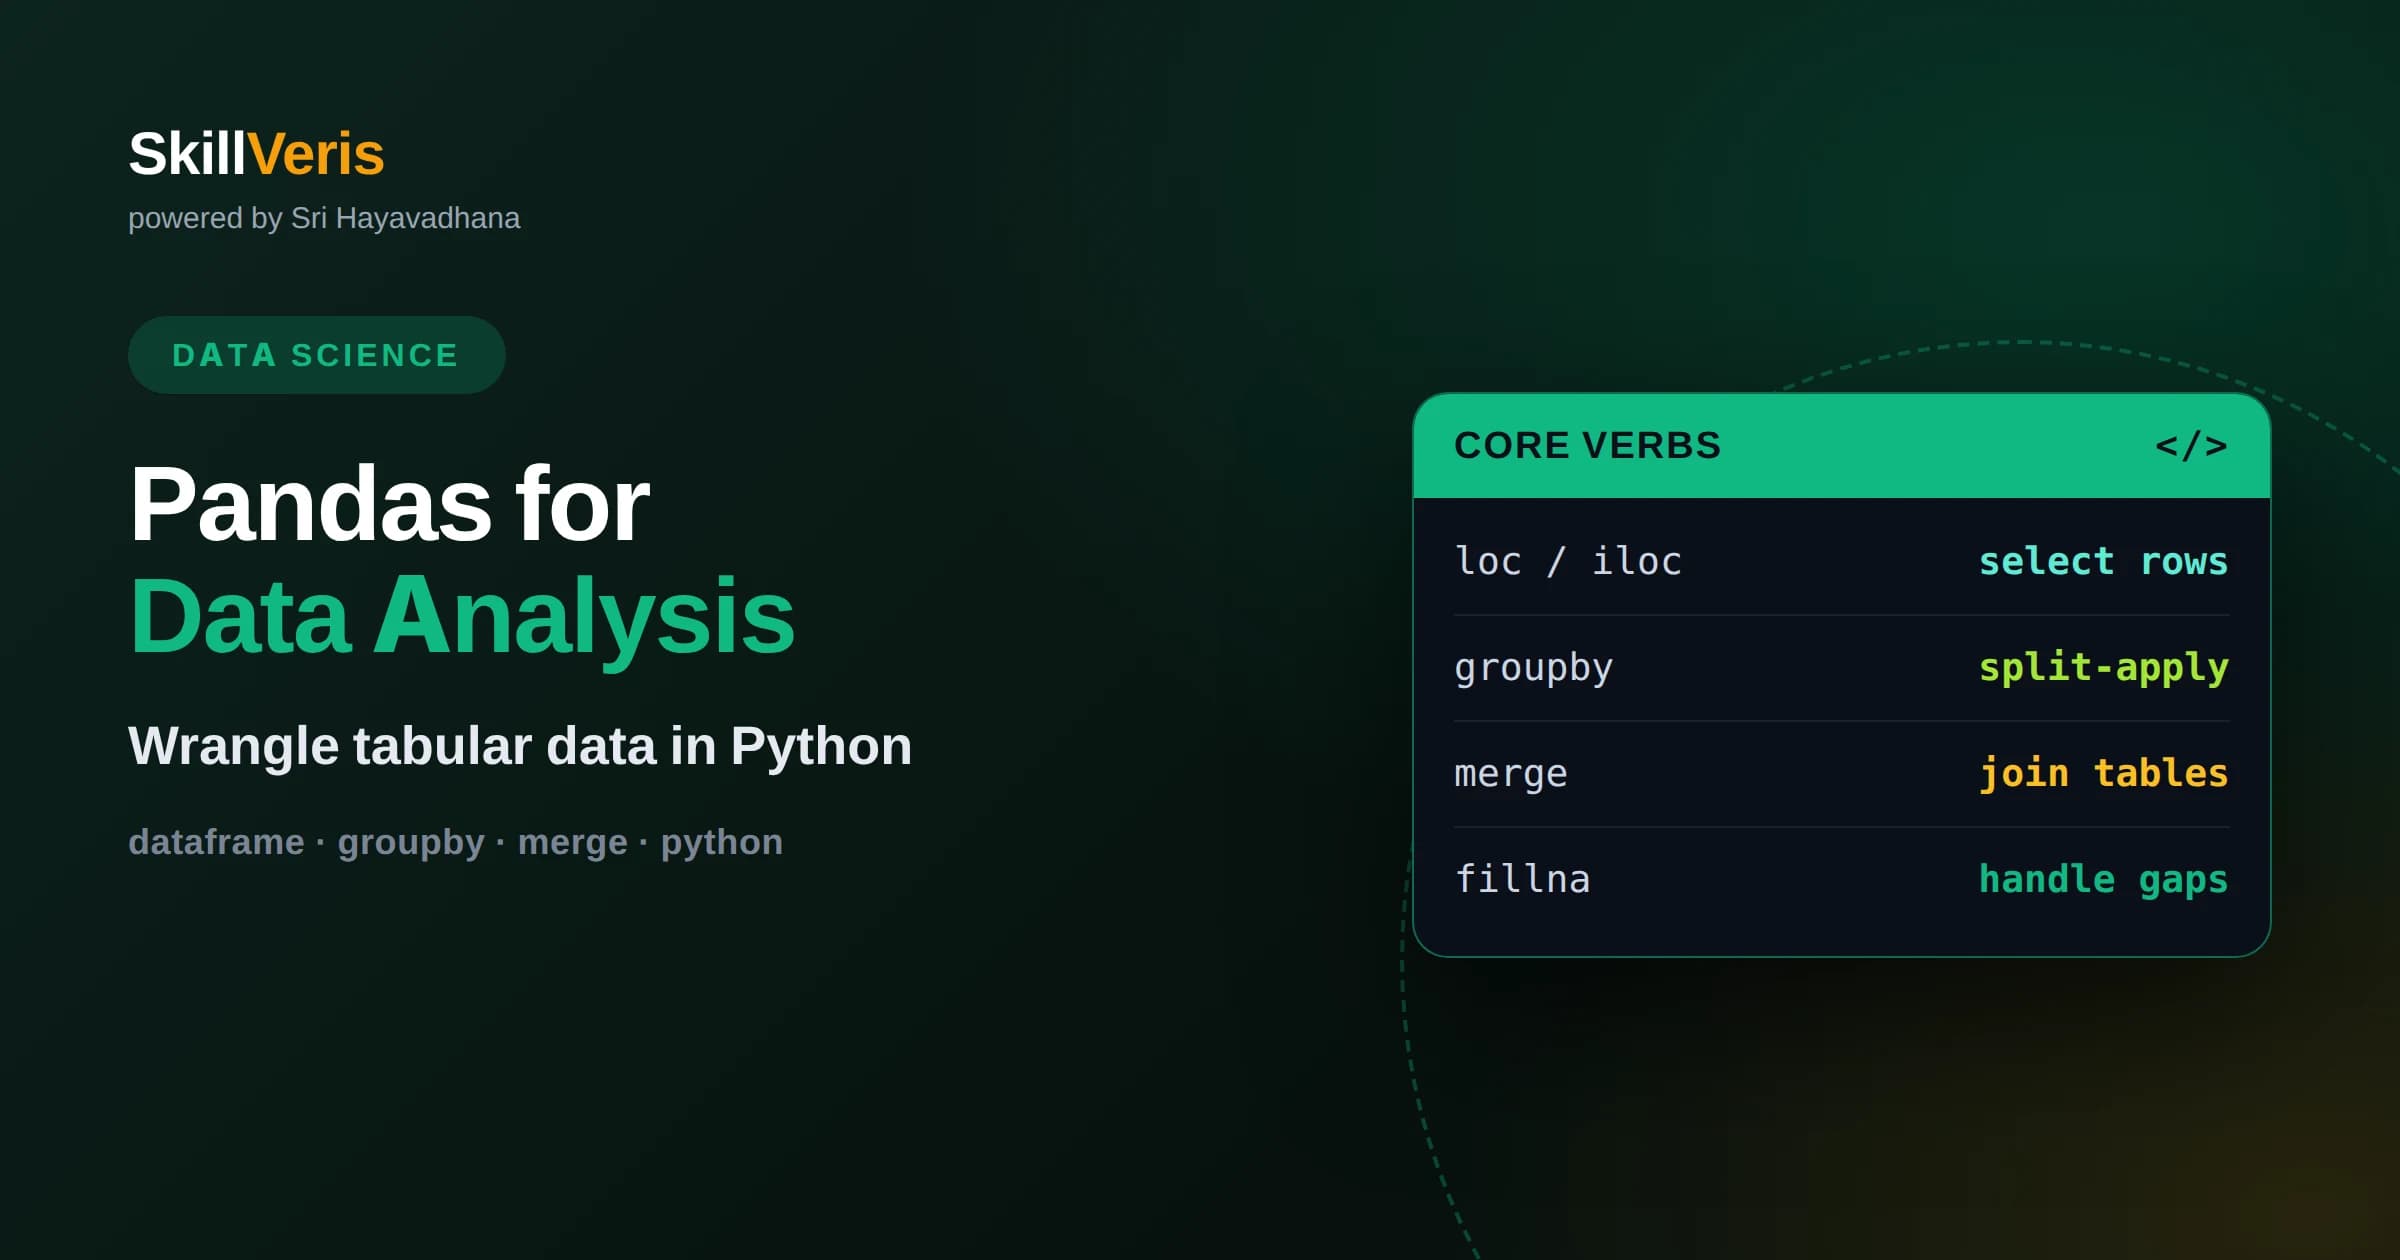
Pandas gives you the DataFrame, a fast, labeled table that makes loading, cleaning, and analyzing tabular data in Python natural and expressive.
In this guide, you'll learn:
- Mastering selection with loc and iloc, plus boolean filtering, unlocks most of the data-wrangling work you will do day to day.
- Group-by aggregation and merging are the heart of real analysis, letting you summarize data and combine datasets the way SQL does.
- Understanding vectorized operations and avoiding row-by-row loops is what keeps pandas fast on large datasets.
1What Is Pandas?
Pandas is the standard Python library for working with structured, tabular data, the kind you would otherwise open in a spreadsheet or query from a database. Its central object is the DataFrame, a two-dimensional table with labeled rows and columns that you can filter, transform, summarize, and combine with concise, readable code.
Pandas exists because raw Python is clumsy for data work. Looping over lists of dictionaries to compute an average or join two datasets is verbose and slow. Pandas replaces that with expressive operations that work on entire columns at once, backed by fast, compiled routines, so both your code and your programs run efficiently.
It sits at the center of the Python data ecosystem. Pandas reads from and writes to CSV files, Excel, databases, and many other sources, and it hands off cleanly to visualization and machine learning libraries. For most analysts and data scientists, pandas is where a data project begins.
2Series and DataFrames
Pandas has two core structures. A Series is a one-dimensional labeled array, essentially a single column of data with an index attached to each value. A DataFrame is a collection of Series sharing a common index, forming a table where each column can hold a different type, such as numbers in one and text in another.
The index is a defining feature. Every row and column carries a label, not just a numeric position, which lets you align data meaningfully. When you perform operations across DataFrames, pandas aligns them by their labels automatically, so values line up correctly even if the rows are in different orders.
Understanding that a DataFrame is really a dictionary-like container of aligned Series demystifies much of the library. Selecting a column gives you a Series, operations on a column apply to every value, and adding a column is like adding a key. Keeping this mental model in mind makes the rest of pandas far easier to reason about.
3Loading and Inspecting Data
Most analyses start by reading a file into a DataFrame, most commonly a CSV using the read csv function, though pandas supports Excel, JSON, SQL, and more. A single line of code turns a file on disk into a table you can explore, and options let you control things like which column becomes the index or how missing values are recognized.
Before analyzing anything, inspect what you loaded. The head and tail methods show the first and last rows, shape reports the number of rows and columns, and info summarizes column names, types, and non-null counts. The describe method gives quick statistics for numeric columns, offering an instant sense of ranges and distributions.
This inspection step is not optional busywork. Real data is messy, and looking closely at types, missing values, and unexpected entries early prevents you from building an analysis on faulty assumptions. A few minutes understanding the data saves hours of chasing confusing results later.
4Selecting and Indexing Data
Selecting the data you want is the most frequent operation in pandas, and it has a few distinct forms worth keeping straight. Selecting a single column by name gives a Series, while passing a list of names returns a smaller DataFrame. This bracket notation is the everyday way to pull out columns of interest.
For rows and combined row-column selection, pandas offers loc and iloc. The loc accessor selects by label, so you name the rows and columns you want, while iloc selects by integer position, like slicing a list. Keeping the label-versus-position distinction clear is the key to avoiding the confusion beginners often feel here.
Chained selections can produce warnings and unpredictable results because pandas cannot always tell whether you intend to view or modify data. The reliable habit is to make a single loc call that specifies both rows and columns together, which is both clearer and safer than stacking multiple bracket operations.
5Filtering With Boolean Conditions
Boolean filtering is how you ask questions of your data. When you write a comparison on a column, pandas produces a Series of true and false values, one per row. Passing that boolean Series back into the DataFrame keeps only the rows where the condition is true, giving you a subset that matches your criterion.
You can combine conditions with the and and or operators written as ampersand and pipe, wrapping each condition in parentheses because of operator precedence. This lets you express rich queries, such as rows where a value exceeds a threshold and a category matches a label, all in a single readable expression.
For membership tests and text, pandas provides helpers like isin for checking against a set of values and string methods for pattern matching. Together with basic comparisons, these tools let you slice data along almost any dimension, which is the foundation of exploratory analysis.
A useful mental habit is to build filters incrementally. Start with one condition, look at how many rows remain, then add another and watch the subset shrink. This step-by-step approach makes it obvious when a condition is too broad or too narrow, and it catches logic mistakes before they quietly distort a downstream summary.
6Handling Missing Data
Real datasets almost always contain missing values, which pandas represents with a special not-a-number marker. Ignoring them leads to wrong results because operations behave differently in their presence, so handling missingness deliberately is a core part of any analysis.
Pandas gives you clear tools. The isna method flags missing entries, dropna removes rows or columns containing them, and fillna replaces them with a chosen value such as a constant, the column mean, or a forward-filled neighbor. Which approach is right depends on why the data is missing and what your analysis needs.
The important discipline is to decide consciously rather than let missing values slip through. Dropping data loses information, while filling introduces assumptions, and each choice affects your conclusions. Documenting how you treated missingness keeps your analysis honest and reproducible.
7Transforming and Creating Columns
Analysis usually requires deriving new information from existing columns. Because pandas operations are vectorized, you can compute a whole new column by writing an expression on existing columns, such as multiplying a price by a quantity to get a total, and pandas applies it to every row at once, quickly and concisely.
For transformations that do not fit a simple expression, the apply and map methods let you run a function over a column or rows. The assign method offers a clean way to add columns in a pipeline. Type conversions with astype and datetime parsing turn raw text into the numbers and dates that make further analysis possible.
The guiding principle is to think in columns, not loops. Whenever you feel tempted to iterate over rows to build a result, look for a vectorized expression or a built-in method instead. It will almost always be shorter, clearer, and dramatically faster on large data.
8Grouping and Aggregation
Group-by is where pandas becomes a true analysis tool. The groupby method splits your data into groups based on the values in one or more columns, applies an aggregation such as sum, mean, or count to each group, and combines the results into a summary table. This split-apply-combine pattern answers questions like average sales per region or total orders per customer.
You can aggregate multiple columns with different functions at once, giving you a rich summary in a single expression. Grouping by several columns produces breakdowns across combinations, and the result is itself a DataFrame you can continue to work with, sort, or visualize.
Group-by mirrors the grouping you may know from SQL, and thinking in those terms helps. Whenever a question includes the words per or by each, such as revenue per month, a group-by is almost certainly the operation you want. Mastering it unlocks the majority of everyday analytical tasks.
9Merging and Joining Data
Real analyses rarely live in a single table. The merge function combines two DataFrames by matching values in key columns, exactly like a SQL join. You specify which columns to match on and the join type, whether inner, left, right, or outer, which controls how unmatched rows are handled.
Choosing the right join type matters. An inner join keeps only rows that match in both tables, while a left join keeps every row from the first table and fills in missing matches with nulls. Picking the wrong one silently drops or duplicates data, so being deliberate about the join type prevents subtle errors.
For stacking datasets with the same columns, the concat function appends rows or columns together. Between merge and concat you can assemble data from many sources into the single tidy table that most analyses and models expect as input.
After any join, sanity-check the result by comparing row counts before and after. An unexpected jump usually means duplicate keys caused a many-to-many explosion, while an unexpected drop points to a join type or a key mismatch. This quick check catches the silent data corruption that joins are notorious for introducing.
10Reshaping and Pivoting
Data often arrives in a shape that does not suit your analysis, and pandas provides tools to reshape it. A pivot table summarizes and rearranges data, turning unique values from one column into new columns, much like the pivot tables in a spreadsheet, which is ideal for cross-tabulations and summary views.
The complementary operations melt and stack move between wide and long formats. Wide data spreads a variable across many columns, while long, or tidy, data keeps one observation per row with variables in columns. Many pandas and plotting tools expect tidy data, so being able to convert between shapes is a practical necessity.
Reshaping can feel abstract at first, but it becomes intuitive once you internalize what a single row should represent for the task at hand. Deciding on that unit of observation, then reshaping toward it, is a reliable way to prepare data for analysis or visualization.
11Performance and Best Practices
Pandas is fast when you use it the way it wants to be used. Vectorized operations that act on whole columns run in optimized compiled code, while looping over rows in Python is often orders of magnitude slower. The most common performance fix is simply replacing a row loop with a vectorized expression or a built-in method.
Watch your data types, because they affect both speed and memory. Storing categories as a categorical type, using appropriate numeric widths, and parsing dates into proper datetime types all make operations faster and results more correct. Being mindful of memory matters as datasets grow toward the limits of what fits comfortably in RAM.
Finally, write analyses as readable pipelines. Chaining operations in a clear sequence, with well-named intermediate steps when helpful, makes your work easier to follow, debug, and reproduce. Clean, vectorized pandas code is both faster to run and easier for others to trust.
12Start Analyzing Real Data
The fastest way to learn pandas is to analyze a dataset you actually care about. Load a CSV, inspect it, ask a question, and use selection, grouping, and merging to answer it. Each real question forces you to combine the pieces in this guide, which cements them far better than isolated exercises.
Expect to look things up constantly at first, even experienced practitioners do. The library is large, but the core workflow of load, clean, transform, group, and combine covers the overwhelming majority of tasks. Get fluent in that loop and the rest is detail you can reference as needed.
On SkillVeris you can work through hands-on pandas exercises using real datasets, with guidance at each step from loading raw data to producing a clean summary. Pick a dataset that interests you, pose one concrete question, and answer it with pandas today. Doing the work is what turns these concepts into a durable skill.
Related Reading
Get The Print Version
Download a PDF of this article for offline reading.
About the Publisher
SkillVeris Team
Data Science Team
Our data team shares real-world analytics, ML, and SQL insights grounded in industry practice.
View all postsRelated Posts




Never miss an update
Get the latest tutorials and guides delivered to your inbox.
No spam. Unsubscribe anytime.