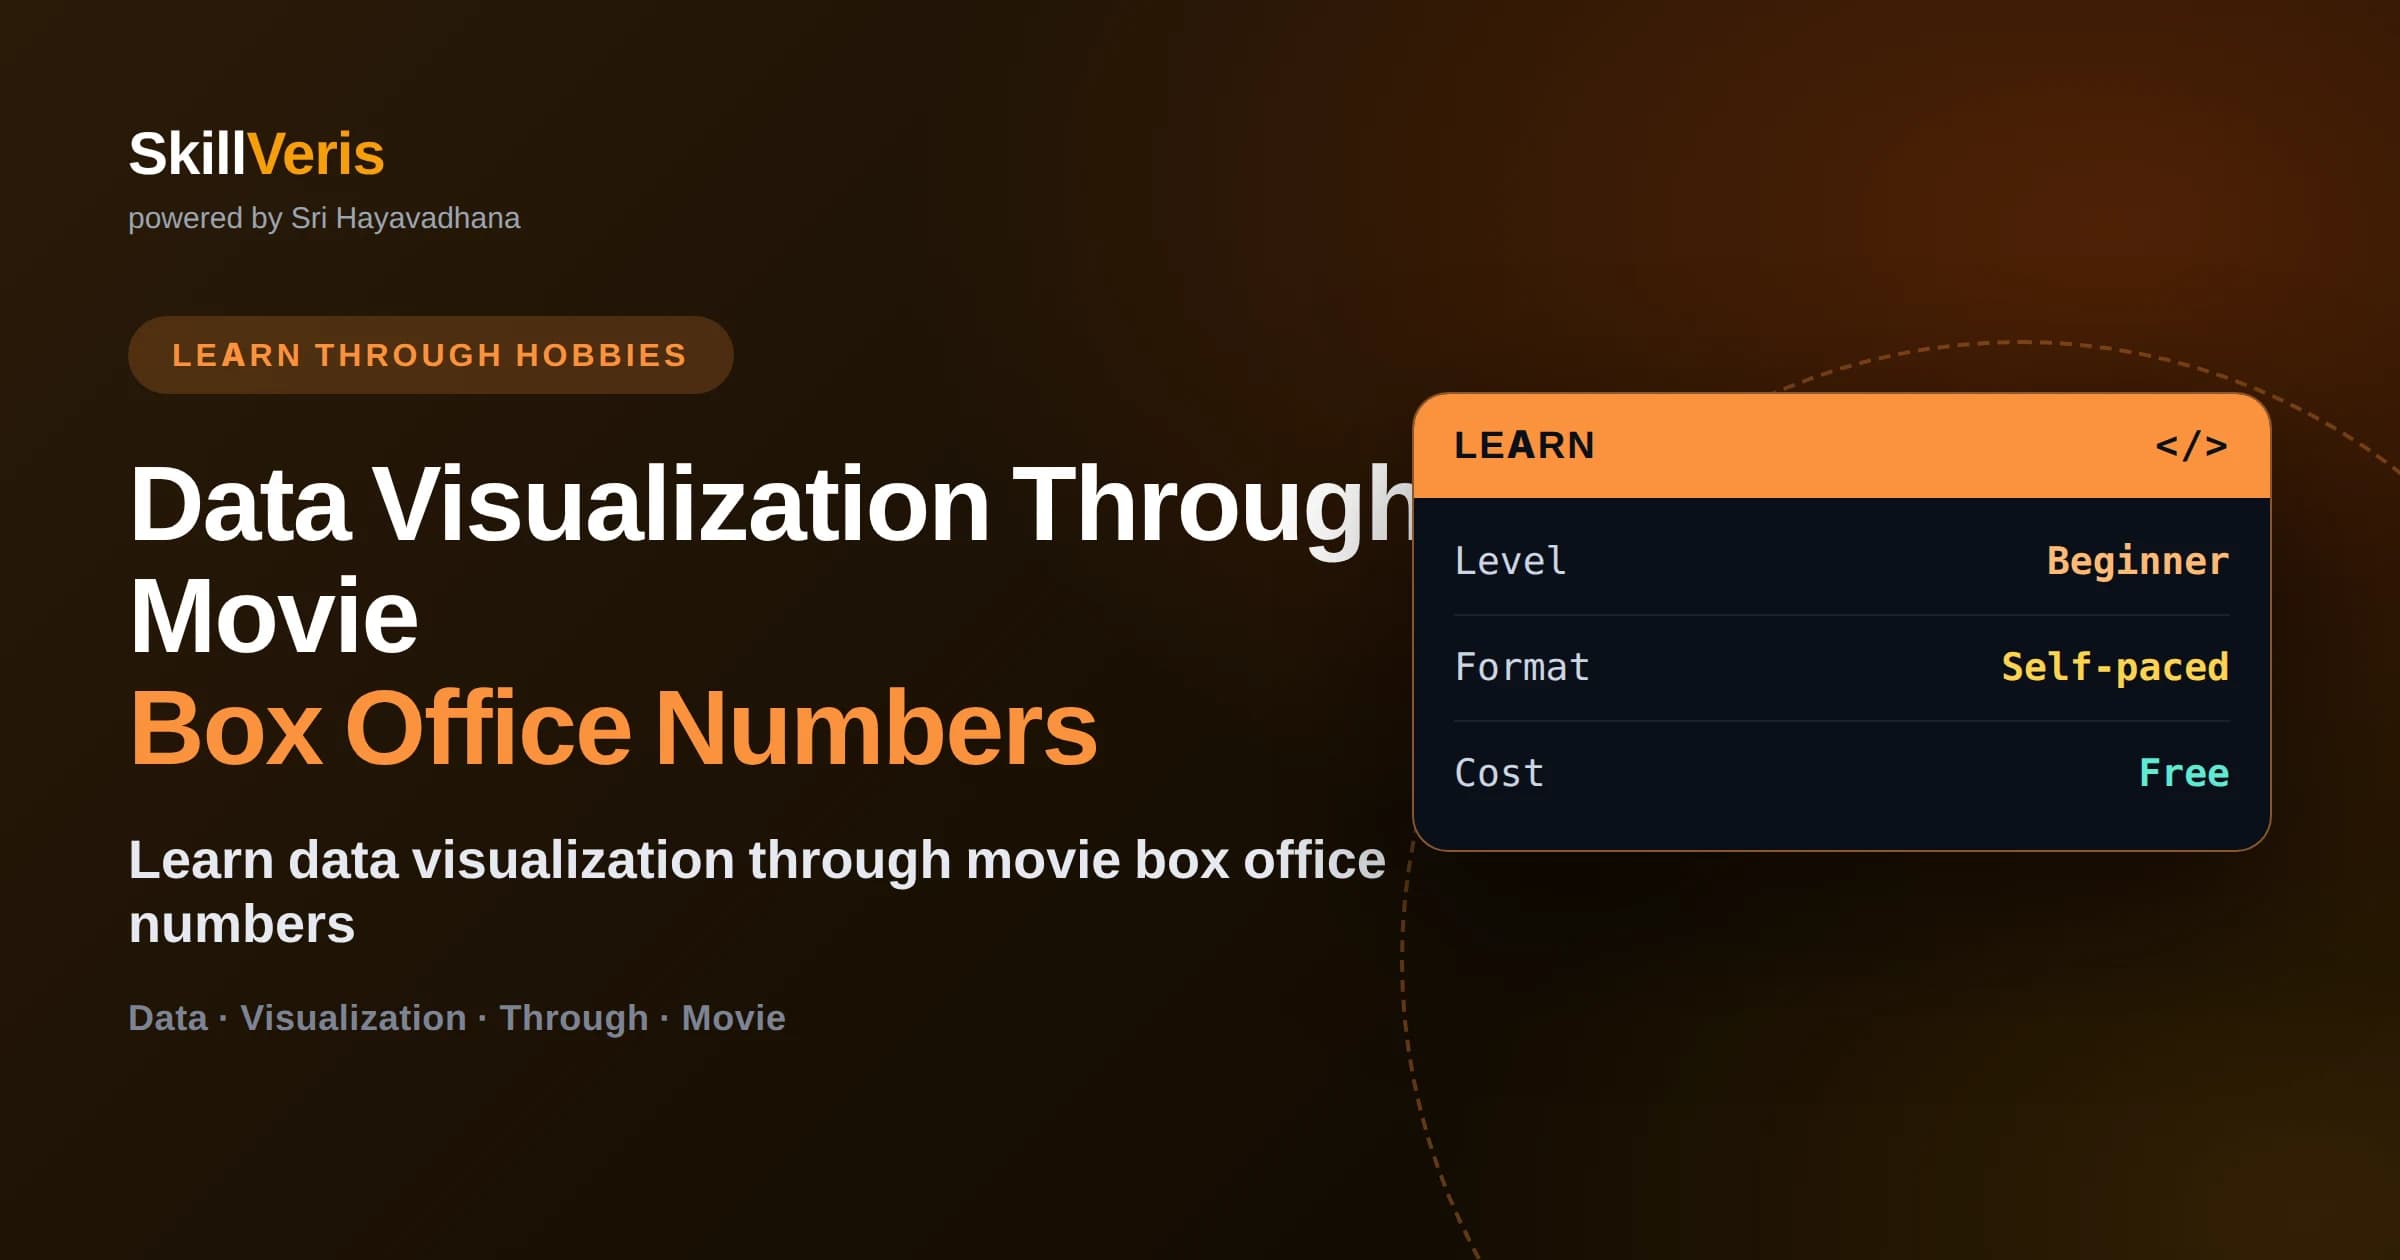
Data Visualization Through Movie Box Office Numbers
SkillVeris Team
Content Team
You will learn to match chart types to the question you are actually asking.
In this guide, you'll learn:
- You will visualize trends over time and comparisons across films and genres.
- You will use scatter plots to explore relationships like budget versus earnings.
- You will apply color, labels, and annotation to make charts self-explanatory.
- You will recognize misleading charts and the design choices that cause them.
1Data Visualization With Box Office Numbers
Data visualization turns numbers into charts that reveal patterns the eye can grasp instantly, and movie box office data is a fun, intuitive way to learn it. Earnings, budgets, genres, and release dates give you rich material to practice choosing the right chart, styling it clearly, and telling a story with it.
This article uses movies only as a teaching device. The real subject is visualization itself — the principles of matching a chart to a question, encoding data with position and color, and designing for honesty and clarity. Box office figures are simply an engaging stand-in for any business or scientific data.
We will move from choosing chart types to styling and finally to arranging charts into a narrative that an audience can follow.
2Start With the Question
Good visualization begins before any chart is drawn, with a clear question. Are you comparing films, tracking earnings over a run, exploring whether bigger budgets earn more, or showing what share each genre takes of the total? The question determines the chart, not the other way around.
This discipline saves you from the most common beginner mistake: picking a chart because it looks impressive, then forcing data into it. State your question in one sentence, and the right chart type usually becomes obvious. Everything that follows is about serving that question honestly.
3Showing Trends Over Time
When your question involves change over time — how a film's daily earnings rise and fall across its theatrical run — a line chart is the natural choice. Position along the horizontal axis encodes time and the vertical axis encodes earnings, so the eye reads the trajectory as a shape: a strong opening weekend, a steep drop, a long tail.
Line charts also let you compare trajectories by plotting several films together, each as its own line. Keep the number of lines small and label them directly rather than relying on a crowded legend, so a reader can tell the blockbuster from the slow burner at a glance.
4Comparing Films and Genres
For comparisons across distinct categories — total earnings by film or average gross by genre — a bar chart is the clearest tool because length is the easiest visual quantity to compare accurately. Sort the bars from largest to smallest so the ranking is immediate; an unsorted bar chart makes readers work far harder than they should.
Resist the temptation to reach for a pie chart when comparing many categories. People judge angles and areas poorly, so a pie with eight genre slices is hard to read. A sorted bar chart conveys the same information more accurately, and you should reserve pie or donut charts for a small handful of parts of a whole.
💡Sort your bars
A bar chart sorted from largest to smallest lets readers rank categories instantly. Leaving bars in arbitrary or alphabetical order forces the eye to hunt, which wastes the clarity a bar chart is supposed to provide.
5Exploring Relationships With Scatter Plots
When you want to know whether two numbers move together — does a bigger budget lead to bigger earnings? — a scatter plot is the right lens. Each film is a point positioned by its budget and its gross, and the overall cloud reveals the relationship: a rising trend suggests correlation, a shapeless blob suggests none.
Scatter plots also expose exceptions, which are often the most interesting stories. A low-budget film that earned a fortune sits far above the trend, and a costly flop sits far below. Adding a trend line helps the eye see the general pattern, but the outliers are frequently where the real narrative lives.
6Revealing Distributions
Sometimes the question is about spread rather than comparison — how are opening weekends distributed across all films in a year? A histogram bins earnings into ranges and counts how many films fall in each, showing whether most films open modestly with a few blockbusters forming a long right tail, which is exactly what box office data tends to do.
Recognizing that shape matters, because a skewed distribution warns you that the average is misleading. A handful of megahits drags the mean opening far above the typical film. Visualizing the distribution makes this obvious in a way that a single average never could.
7Styling for Clarity
A chart should be understandable without a caption, and that comes from a few deliberate choices. Give it a title that states the takeaway, label both axes with units — millions of dollars, weeks since release — and remove clutter like heavy gridlines and unnecessary borders. Every element that does not help the reader is competing with the ones that do.
Use color with purpose. Highlight one film in a bold color and mute the rest to draw attention where you want it, or use a consistent color per genre so the meaning stays stable across charts. Avoid rainbow palettes that imply an order that does not exist, and check that your colors remain distinguishable for colorblind readers.
- Title states the insight, not just the variables.
- Axes are labeled with clear units.
- Clutter — extra gridlines, borders, 3D effects — is removed.
- Color highlights meaning rather than decorating.
8Avoiding Misleading Charts
Charts can distort as easily as they clarify, often unintentionally. The classic offense is a bar chart whose vertical axis does not start at zero, which makes a small difference in earnings look enormous. For bar charts, always begin the axis at zero so bar lengths are proportional to the values they represent.
Other traps include cramming too many categories into a pie chart, using area or 3D effects that exaggerate differences, and cherry-picking a time range that hides an inconvenient trend. Honest visualization means letting the data speak — if the real difference is small, the chart should show it as small.
⚠️Zero baselines for bars
Truncating a bar chart's axis so it starts above zero visually inflates modest differences. It is one of the most common ways charts mislead, sometimes by accident. Keep bar baselines at zero to keep the comparison honest.
9Telling a Story With Charts
A single chart answers one question, but a set of charts arranged deliberately tells a story. You might open with a line chart of a summer's earnings, follow with a bar chart ranking the top films, and close with a scatter plot showing that budget only partly explained success. Each chart advances a narrative rather than sitting in isolation.
Order and annotation carry the story. Lead with the chart that frames the question, use annotations to point at the moments that matter, and end with the chart that delivers the conclusion. The goal is that a reader who only glances at your headings and highlighted points still walks away with the main message.
10Frequently Asked Questions
How do I choose the right chart type? Start from your question: comparisons across categories suit bar charts, trends over time suit line charts, relationships between two numbers suit scatter plots, and spreads suit histograms. The question should always drive the chart choice.
Why are pie charts often discouraged? People judge angles and areas poorly, so pie charts with many slices are hard to read accurately. A sorted bar chart usually conveys the same comparison more clearly, leaving pies for just a few parts of a whole.
What makes a chart misleading? Common causes include bar charts that do not start at zero, cramming too many categories together, 3D effects that distort proportions, and cherry-picked time ranges. Honest charts let the true size of differences show through.
Do I need special software to make charts? No. Free tools like Python's Matplotlib and Seaborn, or even a spreadsheet, can produce clear, professional charts. The principles of good visualization matter far more than the specific tool.
Why does box office data often look skewed? A few blockbusters earn vastly more than the many modest releases, creating a long right tail. This skew means the average is pulled upward, which is why visualizing the distribution is more honest than quoting a single mean.
Will these visualization skills apply beyond movies? Yes. Choosing the right chart, styling for clarity, avoiding distortion, and arranging charts into a story are universal skills that apply to business, science, and any data you present.
11Next Steps
You have now covered the essentials of data visualization — choosing charts from questions, encoding data honestly, styling for clarity, avoiding distortion, and arranging charts into a story — using box office numbers as an engaging guide. The movies were just a memorable dataset; the design principles apply to any data you will ever present.
You can keep practicing for free on SkillVeris, where the data visualization and Python courses teach these skills hands-on with Matplotlib, Seaborn, and real datasets. Explore the study notes on charting and exploratory analysis to sharpen your eye, then rebuild these charts with data from a topic you love.
Related Reading
Get The Print Version
Download a PDF of this article for offline reading.
About the Publisher
SkillVeris Team
Content Team
We believe the best way to learn tech is through what you already love — sports, music, photography, and more.
View all postsRelated Posts

Never miss an update
Get the latest tutorials and guides delivered to your inbox.
No spam. Unsubscribe anytime.