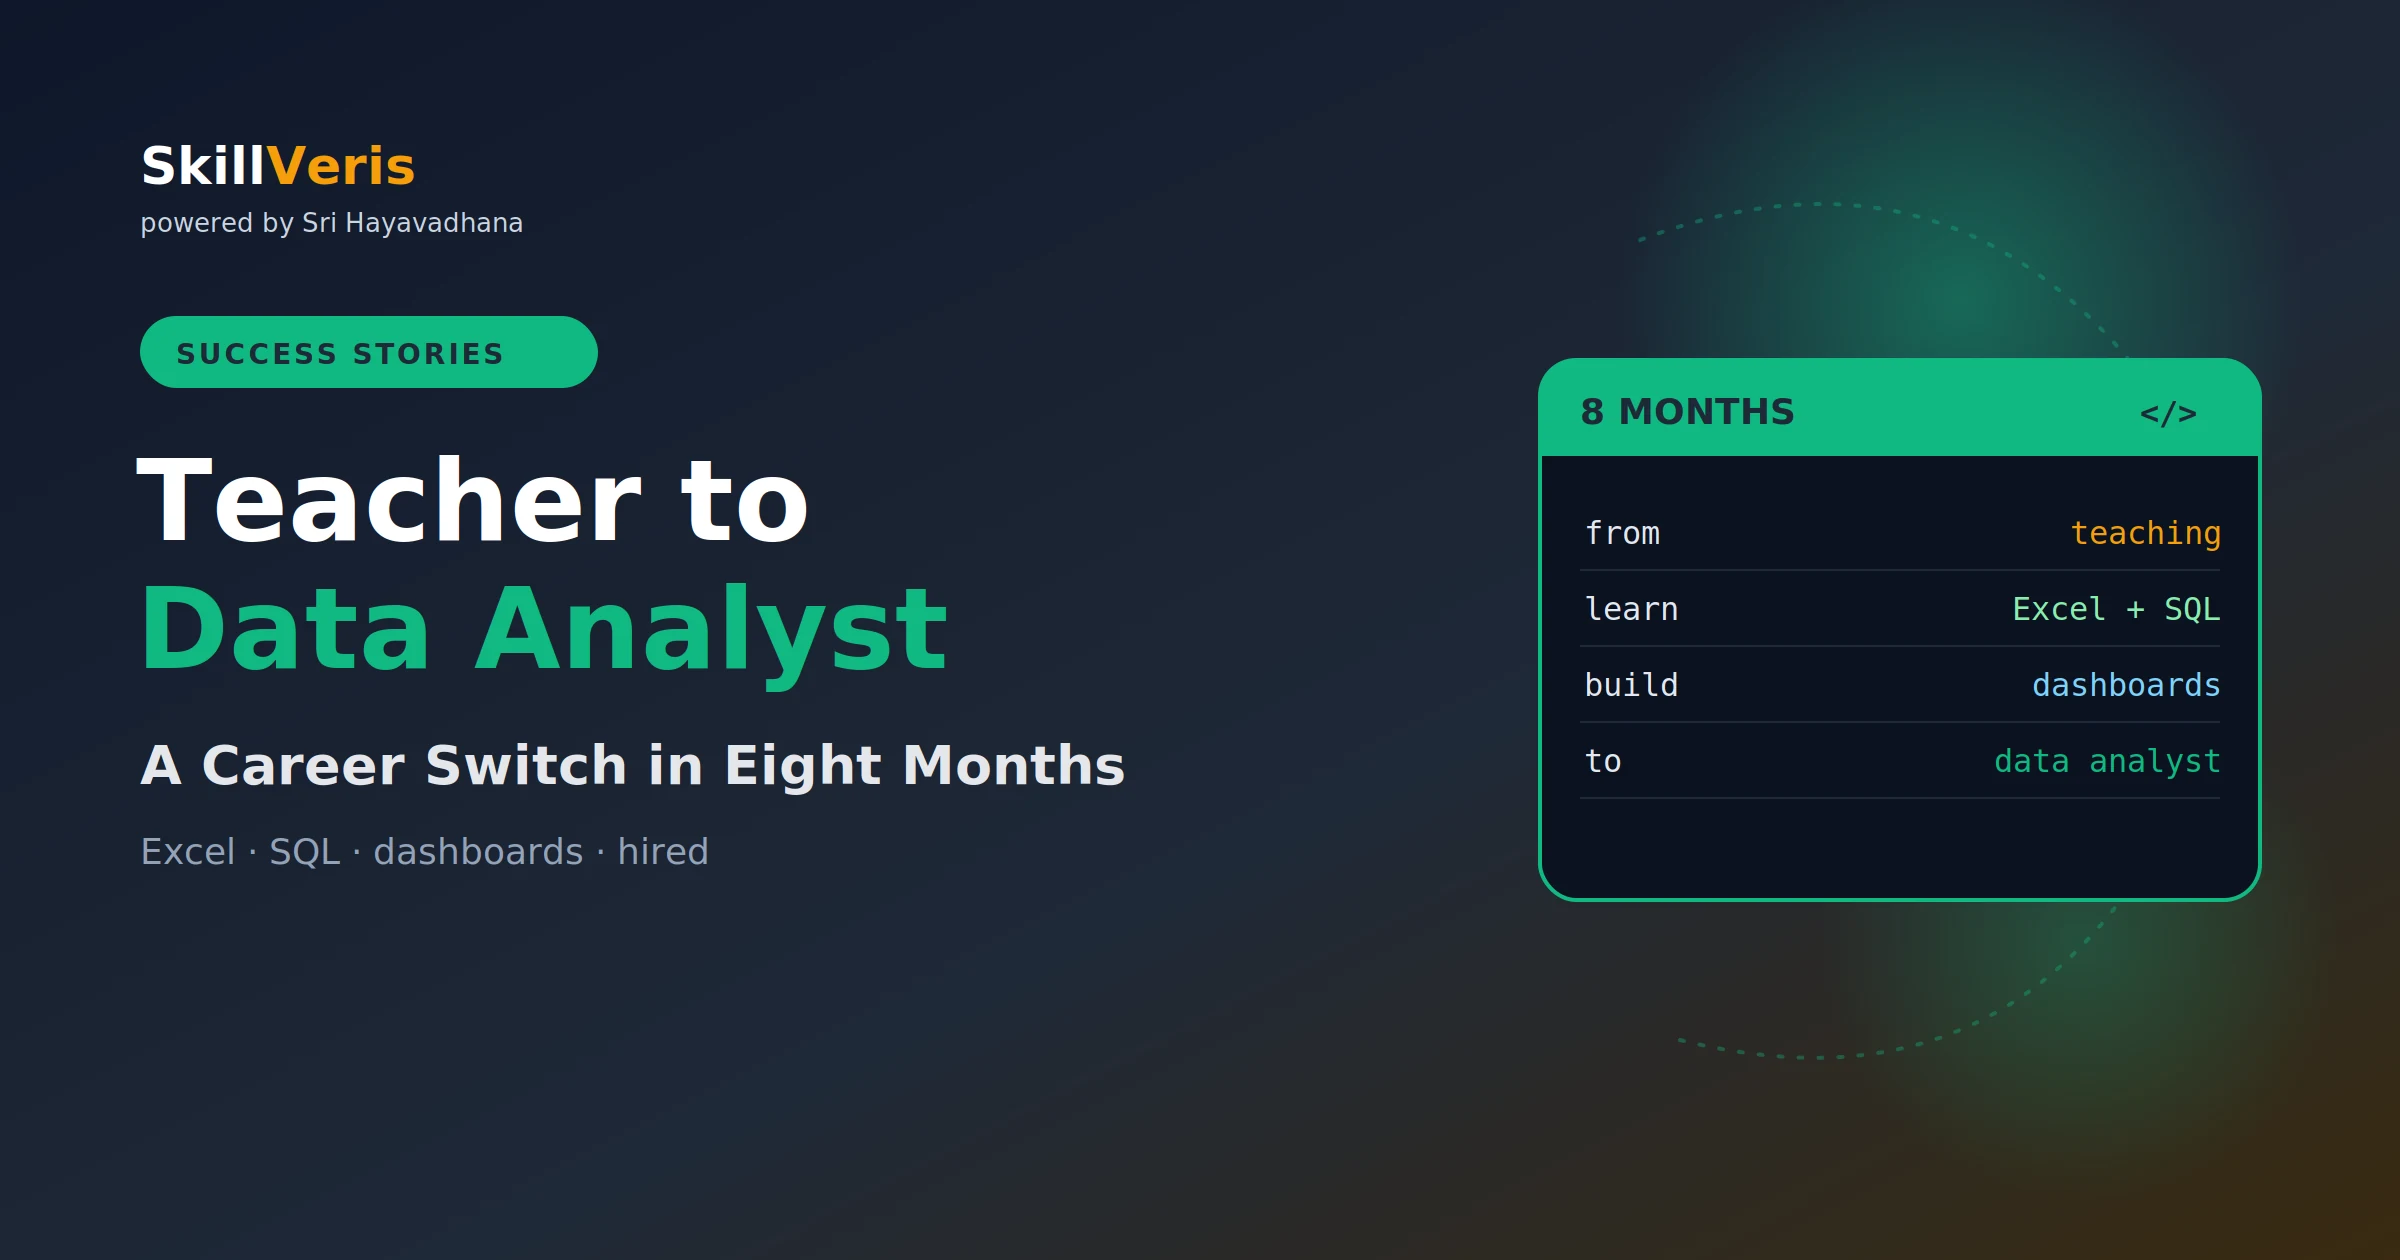
From Teacher to Data Analyst: An Illustrative 8-Month Transition
SkillVeris Team
Community Team
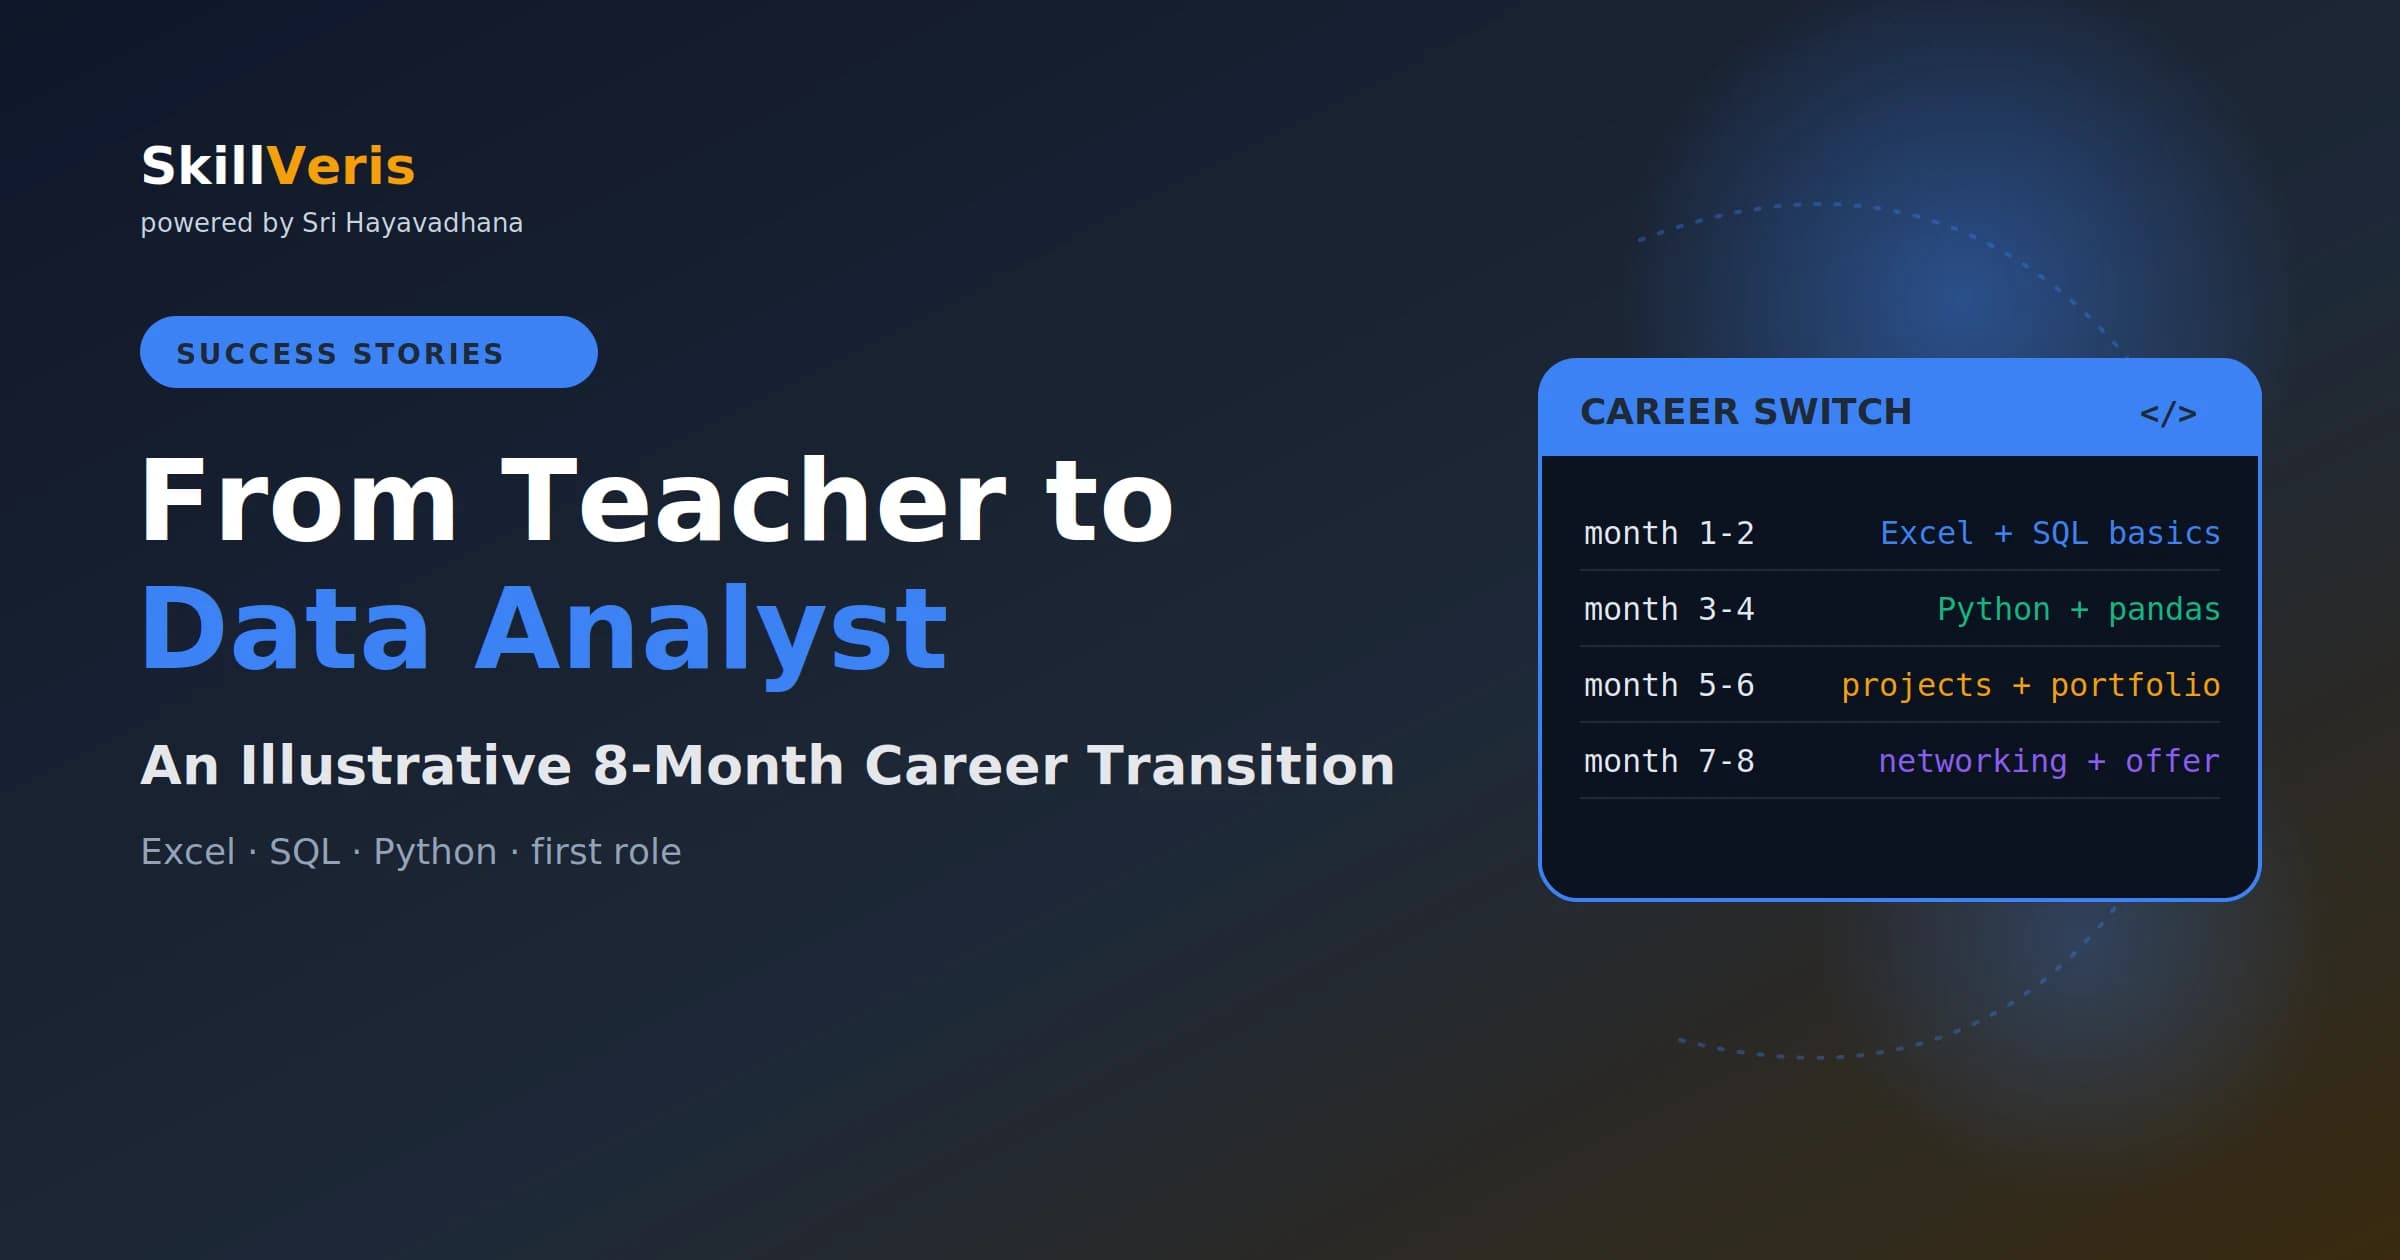
Career switchers routinely underestimate how much of their previous experience transfers directly into a data analyst role.
In this guide, you'll learn:
- A teacher's ability to explain complex ideas, think systematically, and anticipate what an audience needs maps cleanly onto analyst work.
- The technical stack — Excel, SQL, Python, and Tableau — is learnable; the communication and structured thinking are already there.
- Applying every new skill to a real problem in your own domain turns abstract tutorials into genuine leverage.
- Public portfolio projects on open datasets let you showcase real analysis without breaching confidentiality.
1About This Story
Meet Priya (illustrative). A 31-year-old secondary school maths and science teacher in Coimbatore, eight years into a career she genuinely loved but felt had reached a ceiling. The hours were long, the pay was static, and there was a growing sense that her analytical skills were being underused.
She had spent years designing experiments, grading quantitative assessments, and noticing patterns in student performance that no one around her seemed to see or act on. Data analysis, she suspected, was something she could learn. What she didn't yet know was that much of what she already knew was precisely what data analysts needed.
💡Note
This is a composite illustrative journey based on the real experiences of multiple teachers and educators who have transitioned into data roles. Names and specific details are fictional, but the timeline, challenges, and insights are drawn from genuine career-switcher paths. It exists to show what is achievable, not to claim any specific individual's story.
2The Starting Point
Priya's technical starting point was Excel — which she already used to track student grades, attendance patterns, and exam results. What she didn't know: pivot tables, VLOOKUP, or how to visualise the data she'd been staring at for years. She had no programming experience and found the prospect of learning to code intimidating.
The starting insight came from noticing that her school's student data sat in a dozen disconnected spreadsheets, and that no one had ever asked which teaching interventions were actually correlated with improved outcomes. She decided to answer that question — whatever tools it required.
3Month 1–2: Excel and the Revelation
Priya started with the Google Data Analytics Certificate on Coursera — structured, self-paced, and she qualified for financial aid that made it nearly free. The Excel module felt familiar at first, then suddenly new: pivot tables let her answer in minutes questions she'd been manually tabulating for years.
The revelation came in week three. She built a pivot table of exam scores by teaching method, cross-referenced with attendance data, and found a clear pattern: students who attended morning revision sessions outperformed those who didn't, but only in subjects where the revision was interactive rather than passive.
The head of department had never seen this analysis. It changed the school's revision programme for the following term. That moment — data producing a decision that affected 400 students — made the career switch feel not just possible but urgent.
4Month 3: SQL and the School Database
The Coursera course introduced SQL in month 3. Priya immediately tried to connect it to the school's student management system. She couldn't access it directly, but she exported the data as CSVs and loaded them into DB Browser for SQLite — free, with no server required.
Her first query answered a question the school had been asking manually each term: which students had been late more than five times and scored below the grade boundary. Three lines of SQL turned an hour of manual cross-referencing into a 10-second query.
Her First Real Query
A single grouped query replaced a recurring manual task:
SELECT student_id, name, COUNT(*) AS late_count
FROM attendance
WHERE status = 'late' AND term = 'Autumn 2025'
GROUP BY student_id, name
HAVING COUNT(*) > 5;5Month 4: Python for the First Time
Python arrived in month 4 and nearly derailed everything. The shift from Excel and SQL to a programming language felt like starting from zero. She found the generic "compute areas of shapes" tutorials patronising and the abstract examples demotivating.
The breakthrough was connecting Python to her school data. She wrote a script that automated a report she'd been compiling manually every fortnight — pulling attendance CSVs, calculating summary stats, and generating a formatted Excel file. The script took four afternoons to write and replaced two hours of manual work every two weeks.
The Report-Automation Script
The moment the script ran and generated a clean Excel file, the abstraction collapsed. Python was not a toy; it was leverage.
import pandas as pd
df = pd.read_csv("attendance.csv")
summary = df.groupby("class").agg(
avg_attendance=("attendance_pct", "mean"),
students_at_risk=("at_risk", "sum")
).round(1)
summary.to_excel("attendance_report.xlsx")6Month 5: The Tableau Dashboard
Priya had been building charts in Excel and wanted something more interactive. She discovered Tableau Public — free, powerful, and publicly hostable. Her fifth-month project was a school performance dashboard showing attendance, exam results, and intervention effectiveness across all year groups.
She showed a prototype to the school principal. The response was enthusiastic: "Can you present this to governors?" She did, and the dashboard became a standing agenda item at termly board meetings. A governor who worked in fintech mentioned he was looking for a junior analyst.
The connection between learning data tools and having professional impact had closed. She was no longer a teacher who was learning to do analysis; she was an analyst who happened to work in a school.
7Month 6: Building a Public Portfolio
Priya couldn't share the school data publicly because of student privacy, so she replicated her analyses on public datasets instead. Each project mirrored the kind of work she'd done internally, but in a form she could show any employer.
She uploaded all three to GitHub with READMEs and shared them on LinkedIn with a post explaining her transition. The post got significant traction in the education-to-tech community.
- Project 1: UK school performance league table analysis (public DfE data) — similar structure to her school's data, portable to any employer.
- Project 2: A SQL analysis of Stack Overflow developer survey data, answering whether developers with teaching backgrounds have different career paths.
- Project 3: A Tableau dashboard of global literacy rates (UNESCO data) — a topic she cared about and visually striking.
8Month 7: The Job Search Reality
Month 7 was the hardest. Priya applied to 45 positions. She got 9 first-round interviews, 5 technical assessments, and two final rounds. Along the way, a clear picture of her strengths and gaps emerged.
- Her SQL was strong, but her Python needed more depth for some roles.
- Her communication skills were an unexpected differentiator — she could explain her analysis to non-technical stakeholders better than most candidates.
- "Former teacher" was an asset at companies that cared about internal training, customer success, or education-adjacent products.
- She had been underselling the school dashboard project, which was real-world impact at scale.
9Month 8: The Offer
The offer came from an EdTech company building a learning analytics platform. The role: junior data analyst. The hiring manager was specific in the debrief: "Your background in education gives you domain knowledge most candidates don't have. And your ability to present data to a board of governors is exactly the skill we need for our school clients."
She had not expected her teaching experience to be a selling point. She had spent months worrying it would hold her back.
10What Teaching Skills Transferred
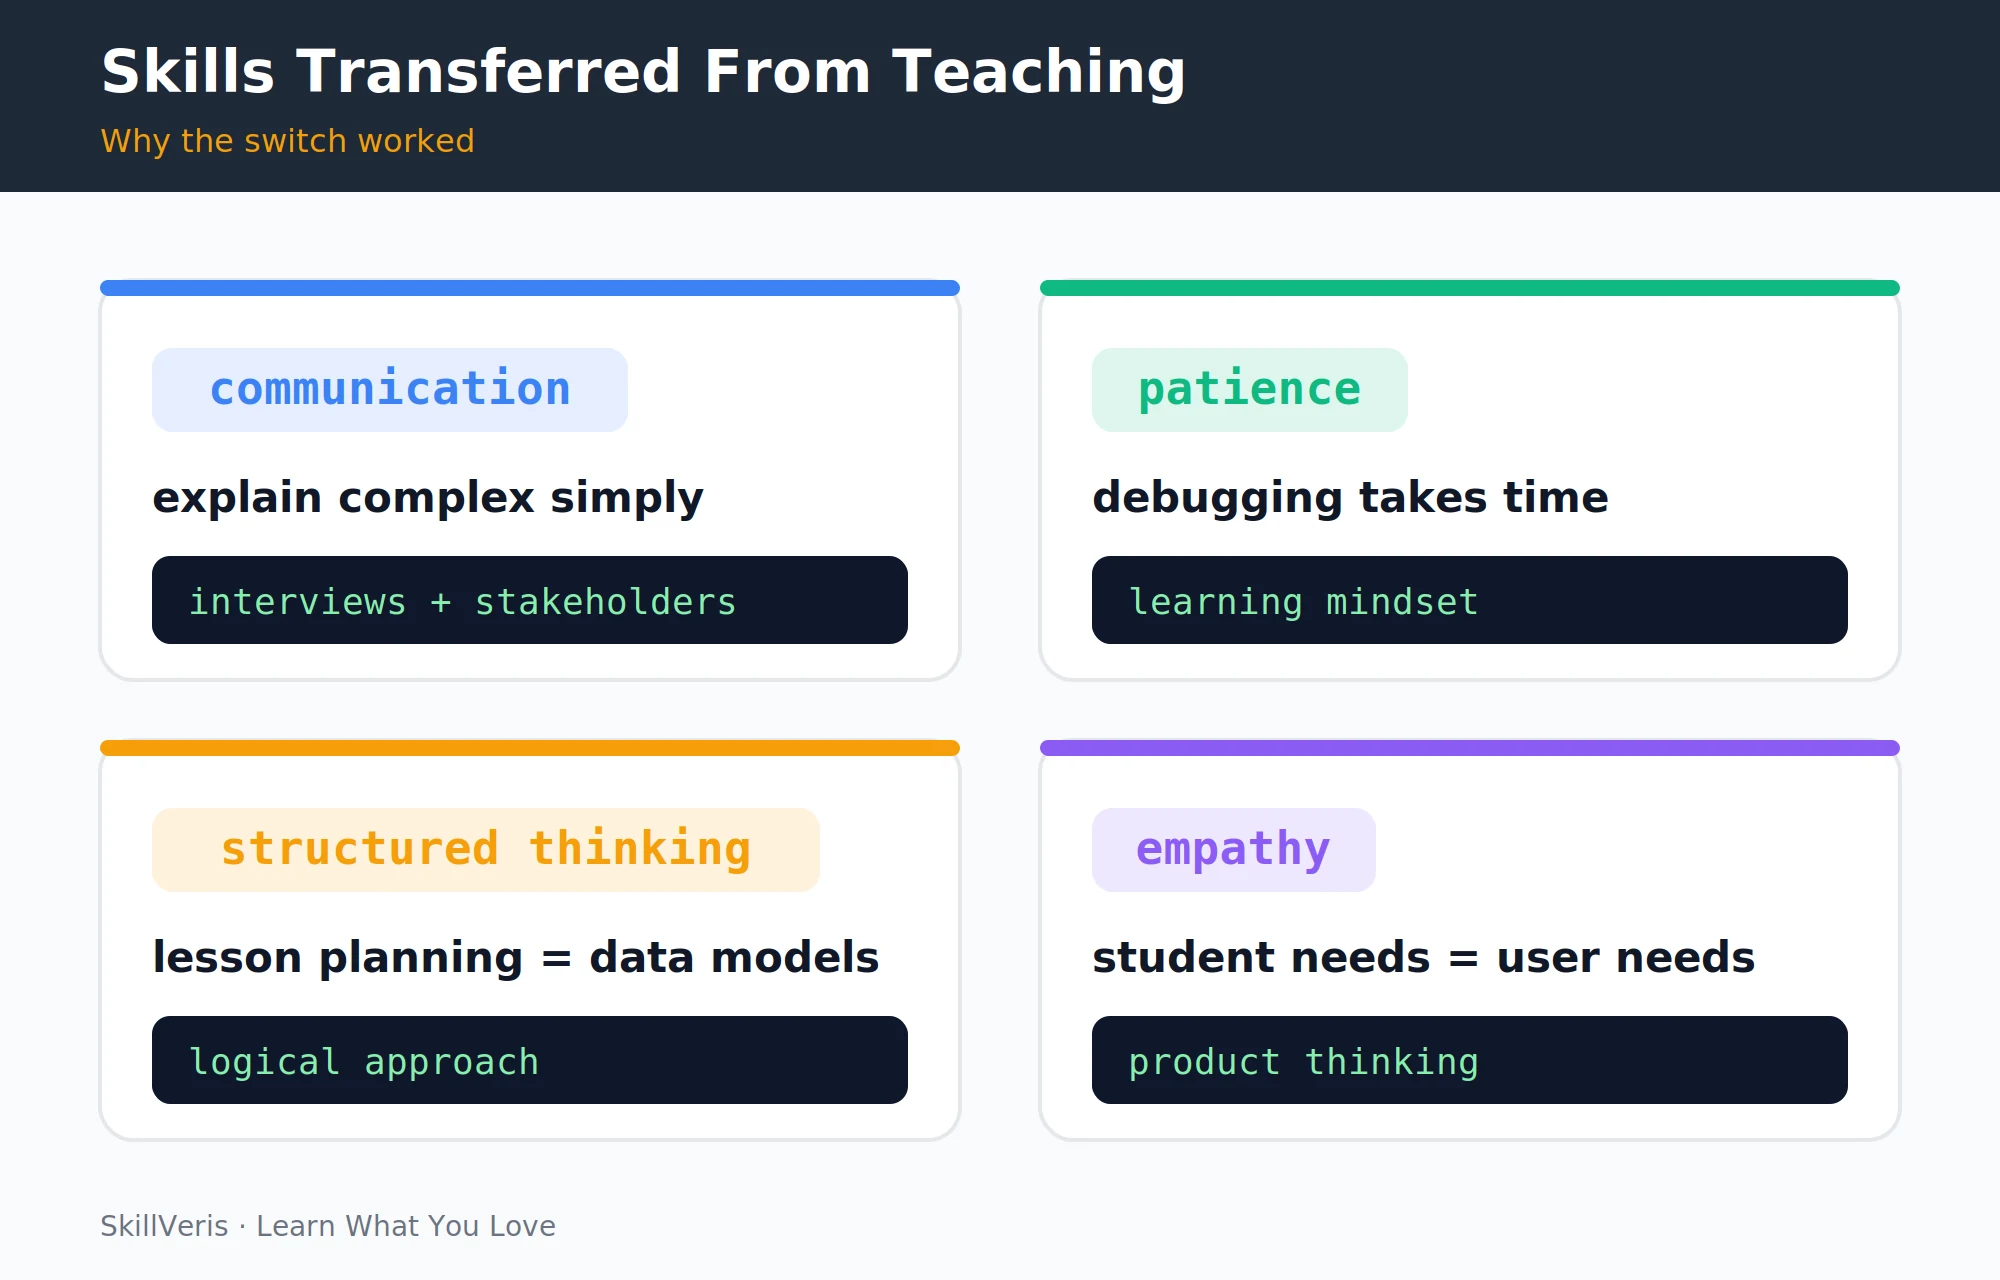
Looking back, the surprise was how much of her teaching practice carried over intact. Four competencies translated directly into data analyst strengths.
- Explaining complex ideas clearly: teachers do this every day, and translating data insights into language a non-technical audience understands is one of the most valued analyst skills.
- Patience with structured problem-solving: debugging a failed analysis is not unlike diagnosing why a student isn't understanding a concept — systematic, patient, and iterative.
- Understanding what the audience needs to know: lesson planning is essentially information design, and a teacher instinctively knows what context a complex idea needs before it lands — exactly the skill for building effective dashboards and presentations.
- Domain knowledge: for an EdTech company, a former teacher wasn't a career changer but a domain expert who had gained technical skills.
11What She Would Do Differently
With hindsight, a few adjustments would have shortened the path and sharpened her positioning.
- Start applying in month 5, not month 7: early interviews revealed gaps faster than any tutorial, and each rejection was a clearer development plan than anything she'd read.
- Network more deliberately earlier: the governor connection happened organically, but a systematic approach — reaching out to data analysts in EdTech on LinkedIn — would have opened more doors sooner.
- Lead with impact, not tools: her early CV listed skills like "Excel, SQL, Python, Tableau," while her later CV led with outcomes such as "Designed school performance dashboard used by leadership teams across 400+ students." The impact version got significantly more responses.
12Key Takeaways
Priya's transition distils into a handful of lessons that apply to almost any career switcher.
- Prior career experience is a transferable asset, not a liability — especially domain knowledge and communication skills.
- The most effective learning approach is to apply every skill to a real problem in your existing domain immediately.
- Public portfolio projects on public datasets sidestep the privacy constraints that prevent sharing professional work.
- Apply before you feel ready; early interviews reveal gaps that study plans can't predict.
13Start the Same Path
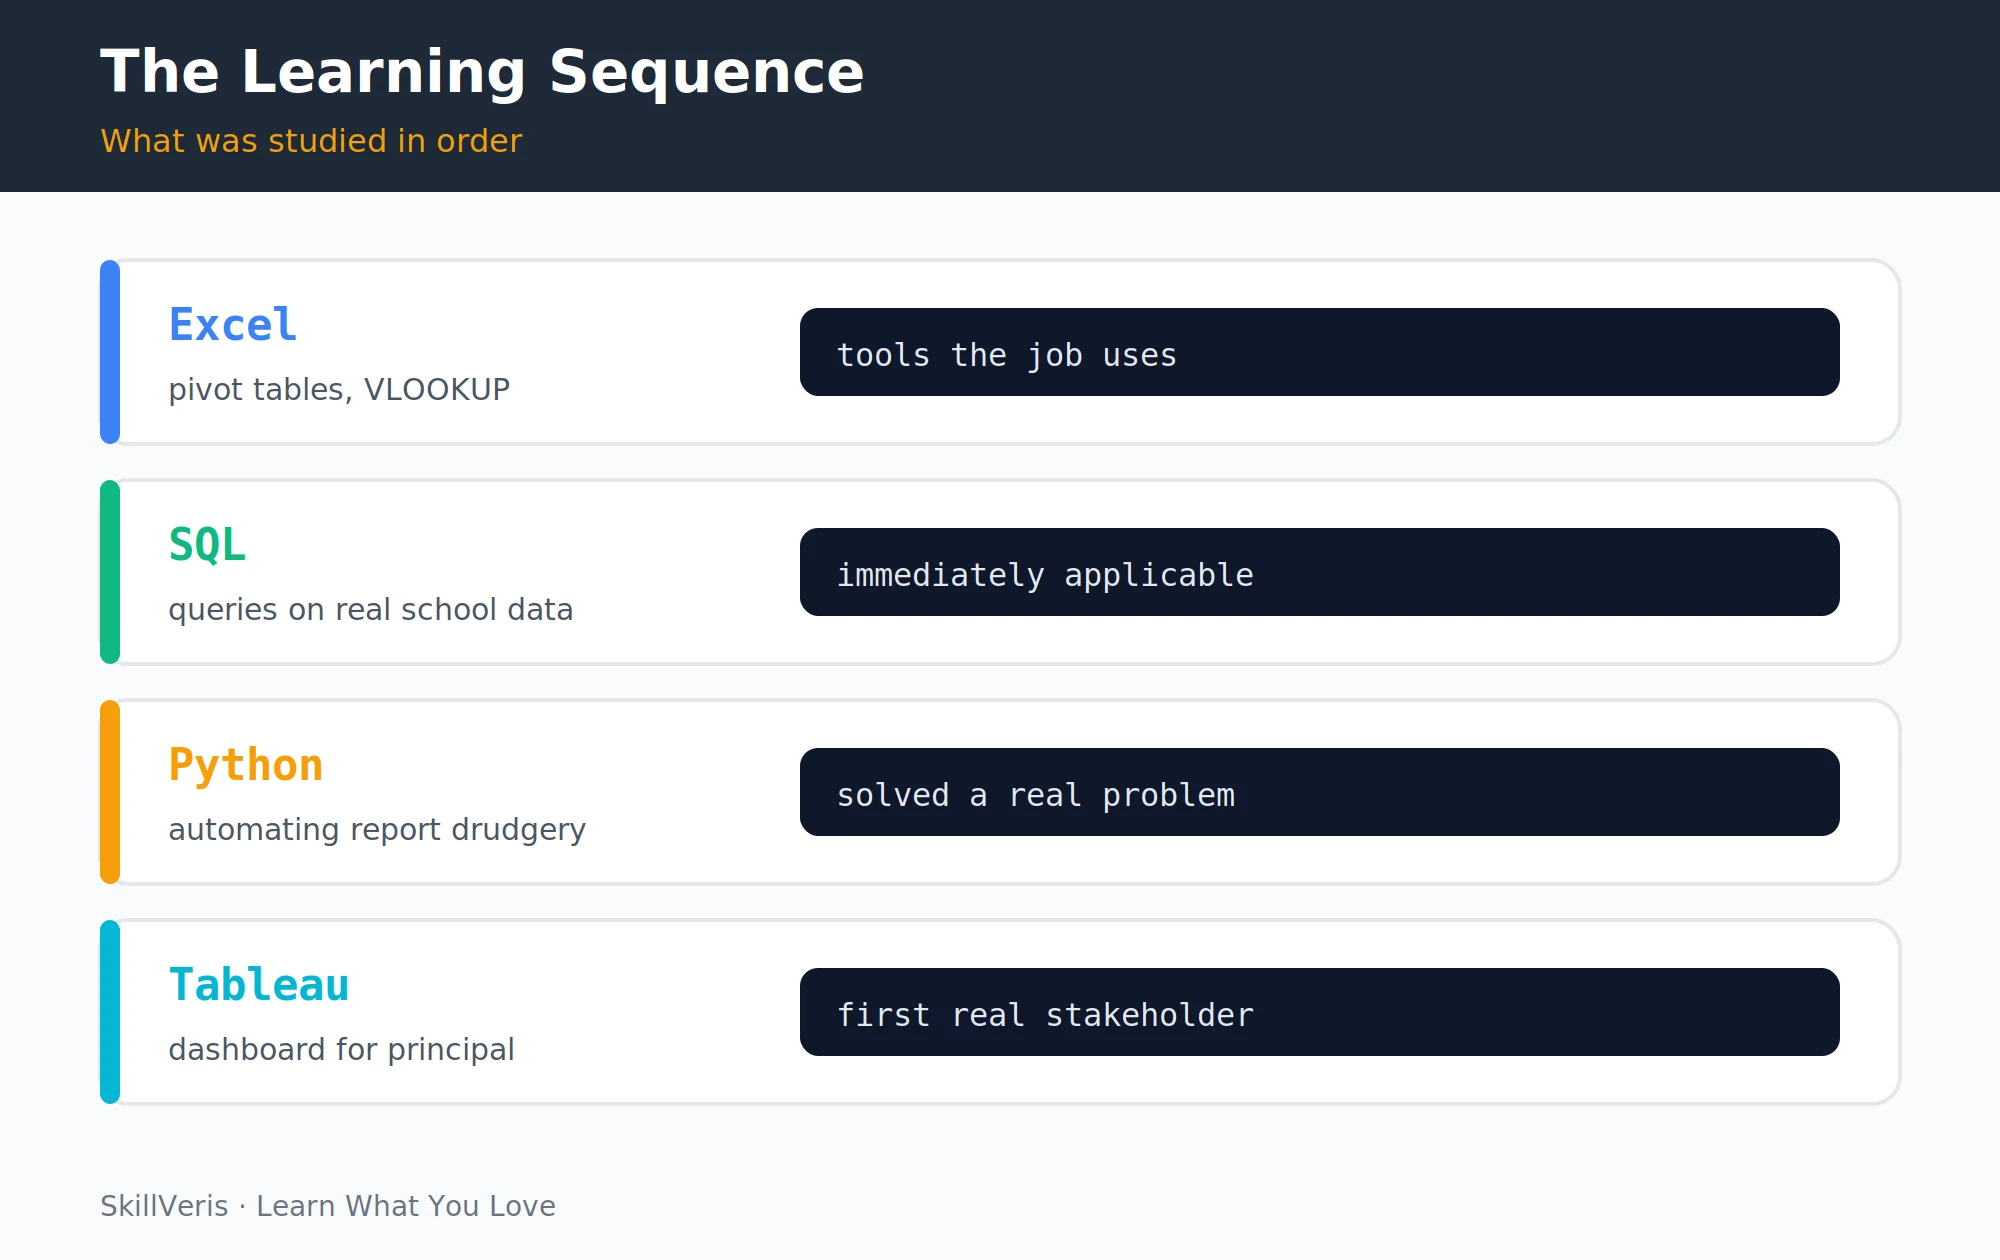
If Priya's journey resonates, you can follow the same learning sequence in the same order.
- Excel for Data Analysis — start here, as Priya did.
- Learn SQL Through Football Data — SQL in an engaging real-world context.
- Data Analytics Roadmap — the full structured path from zero to job-ready.
14Frequently Asked Questions
Does age matter when switching to data analytics? Age matters less than demonstrated skills and relevant experience. Data analyst roles require analytical thinking, communication, and domain knowledge — all of which accumulate with experience rather than decline. The hiring market for data analysts in 2026 is skills-driven, not age-driven, and several of the most successful career switchers in the SkillVeris community made the transition in their 40s.
Is teaching-to-tech a common transition path? Increasingly so. Teachers' skills — structured explanation, audience awareness, patience with complexity — map unusually well onto data analysis and developer advocacy roles. Several major EdTech companies actively recruit former educators for data and customer success roles.
What if I can't share work projects in my portfolio due to confidentiality? Replicate the type of analysis on publicly available data. Government open data portals (data.gov.in, data.gov.uk, census.gov) have education, health, and economic datasets with similar structures to most institutional data. Your analytical approach is what employers evaluate, not whether the data is from your specific employer.
How important is the Google Data Analytics Certificate specifically? It's a solid structured path for beginners, well-recognised by employers, and available with financial aid. It's one good option among several — not the only path. IBM, Coursera's Meta certificate, and Khan Academy's SQL course cover similar material. What matters is completing something structured and applying every concept to real data.
Related Reading
Get The Print Version
Download a PDF of this article for offline reading.
About the Publisher
SkillVeris Team
Community Team
Real stories from SkillVeris learners who transitioned into tech and transformed their careers.
View all postsRelated Posts
Never miss an update
Get the latest tutorials and guides delivered to your inbox.
No spam. Unsubscribe anytime.