From Cricket Fan to Python Developer: An Illustrative Learning Journey
SkillVeris Team
Community Team
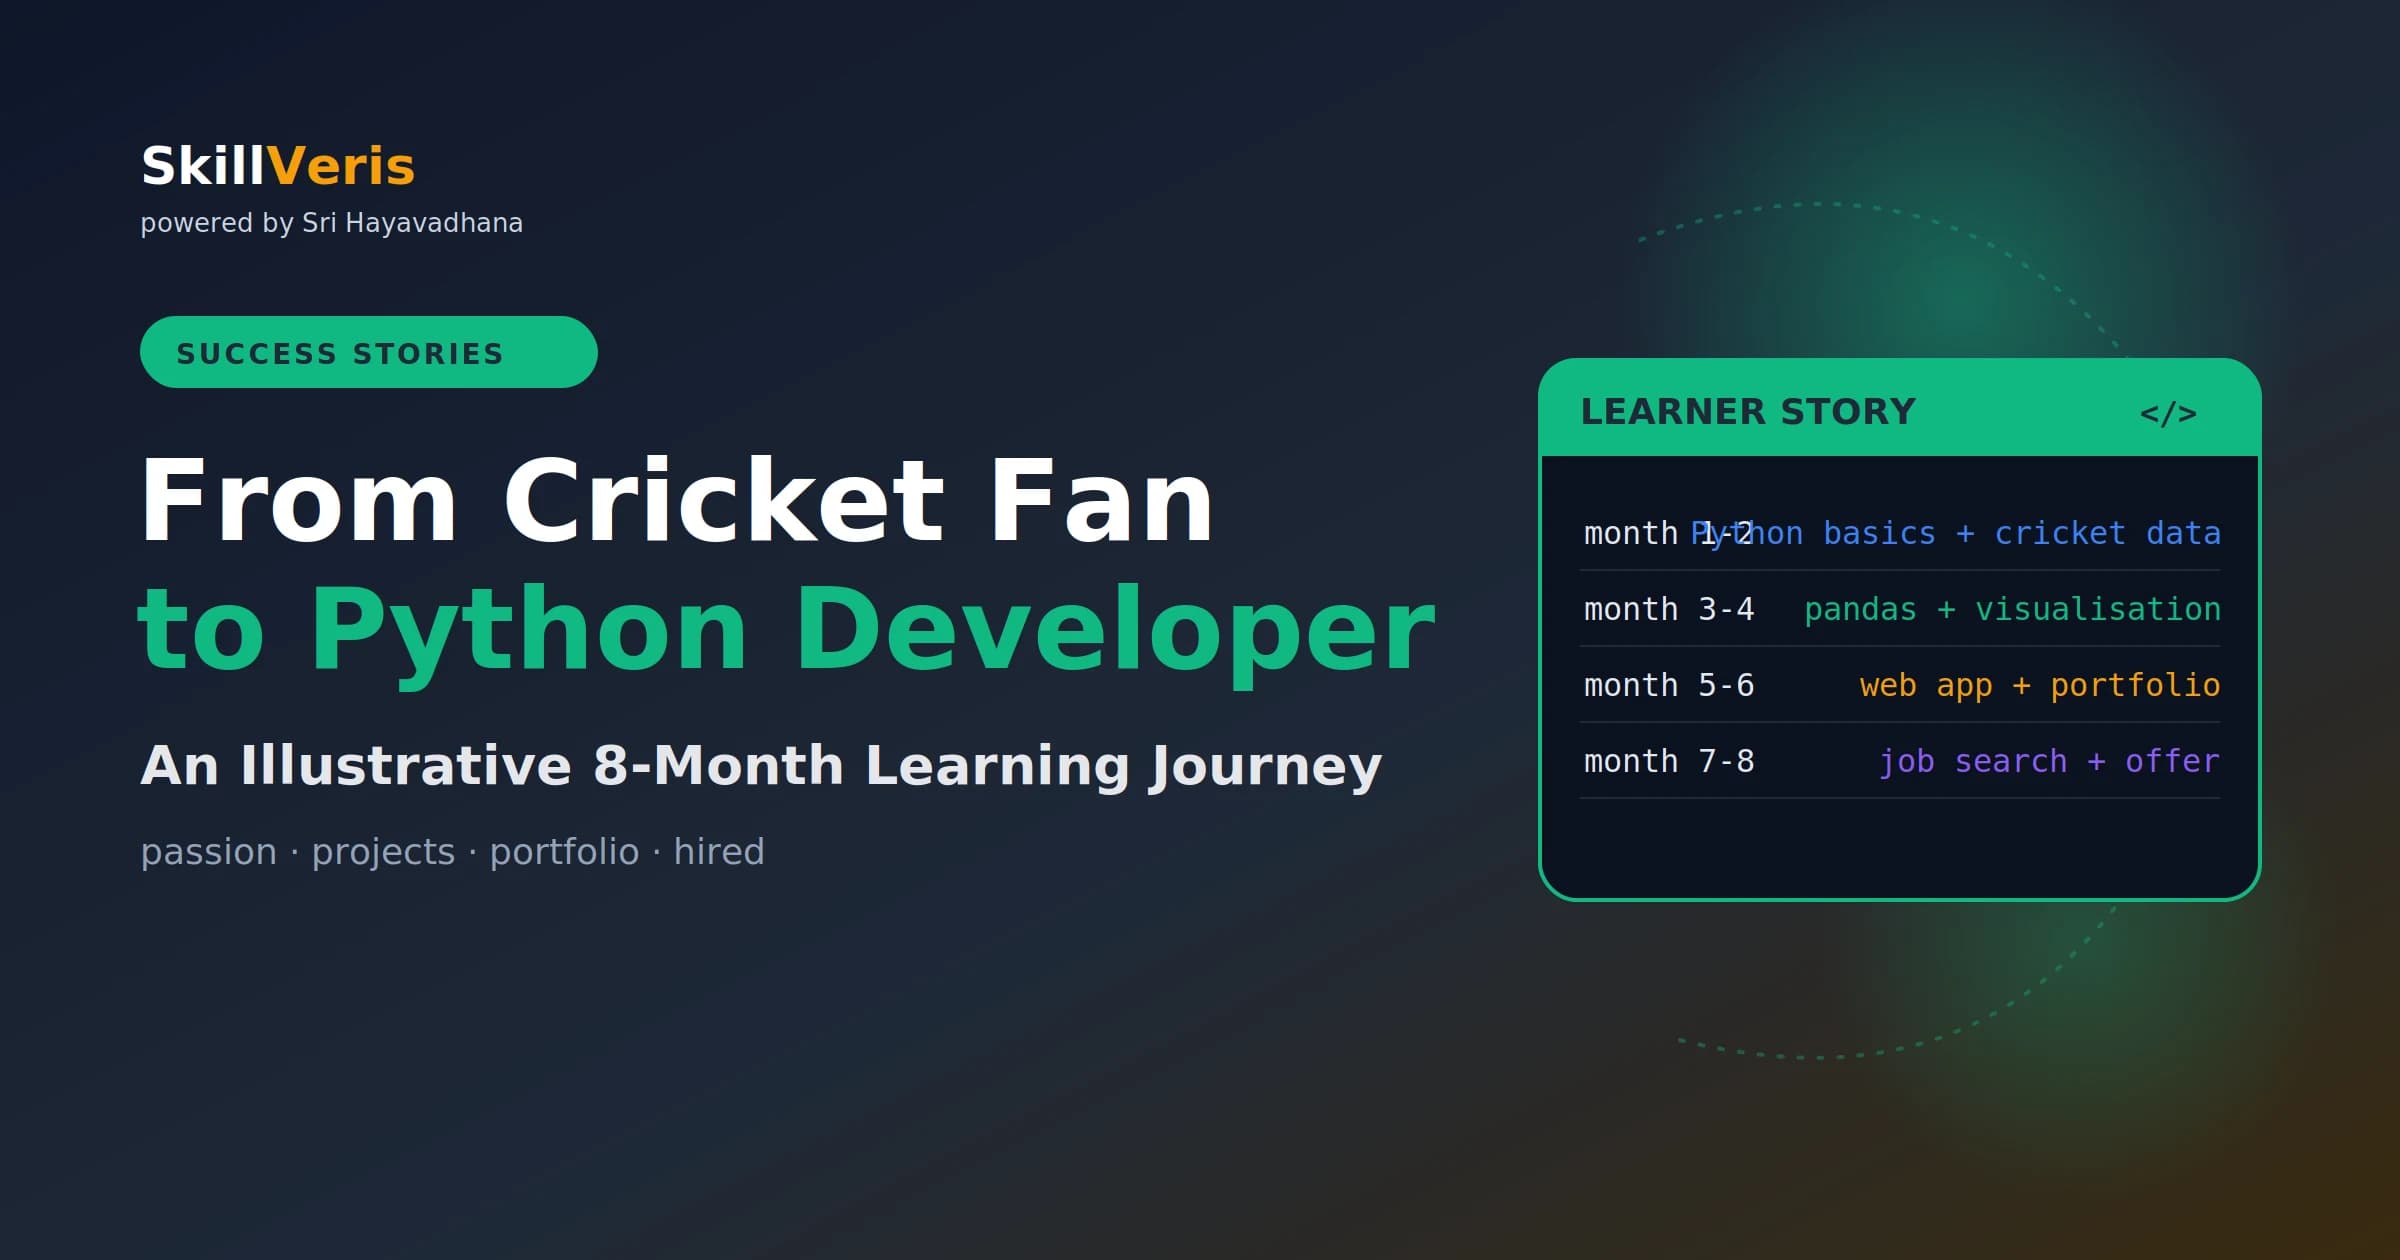
Learning is faster when the subject matter is something you genuinely care about.
In this guide, you'll learn:
- Using cricket data turned every Python lesson into a question worth answering.
- The winning pattern: learn a skill, apply it to data you love, build something shareable, repeat.
- Pandas replaced 200 lines of CSV parsing with five lines and unlocked dozens of new questions.
- Sharing imperfect work publicly created opportunities that private studying never could.
1About This Story
Meet Arjun (illustrative). A 26-year-old with a commerce degree, working in an insurance back-office role in Chennai, spending his evenings watching IPL and scrolling cricket stats.
No coding experience. No plan. Just a growing conviction that data was the skill of the future, and a notebook full of handwritten cricket statistics questions he wished someone could answer for him.
💡Note
This is a composite illustrative journey based on the real experiences of multiple self-taught developers in the SkillVeris community. Names and specific details are fictional, but the timeline, challenges, and breakthroughs are representative of genuine learner paths. This story exists to show what is realistically achievable, not to make any specific claims about any individual.
2The Starting Point
Arjun had tried learning Python twice before — once from a generic tutorial about calculating areas of shapes, once from a course that started with "Hello, World!" and quickly moved to sorting algorithms. Both times he lost interest within two weeks. The material felt disconnected from anything he cared about.
The third attempt was different. He found a Kaggle dataset of IPL ball-by-ball data from 2008–2024 and made himself a rule: every Python concept he learned had to be applied to that dataset before he moved on.
If the lesson was about loops, he'd use loops to count dot balls. If it was about dictionaries, he'd store player statistics. If it was about functions, he'd write a strike rate calculator.
3Month 1–2: Python Basics Through Cricket
The first two months covered fundamentals: variables, data types, conditionals, loops, functions, and file reading. In a generic tutorial, these feel abstract. Applied to cricket data, they became concrete.
By the end of month 2, Arjun had written a 200-line Python script that read the IPL CSV, calculated batting averages and strike rates for every player, and printed a top-10 list.
It wasn't elegant code. But it worked, and more importantly, he understood every line — because he'd written it to answer a question he cared about.
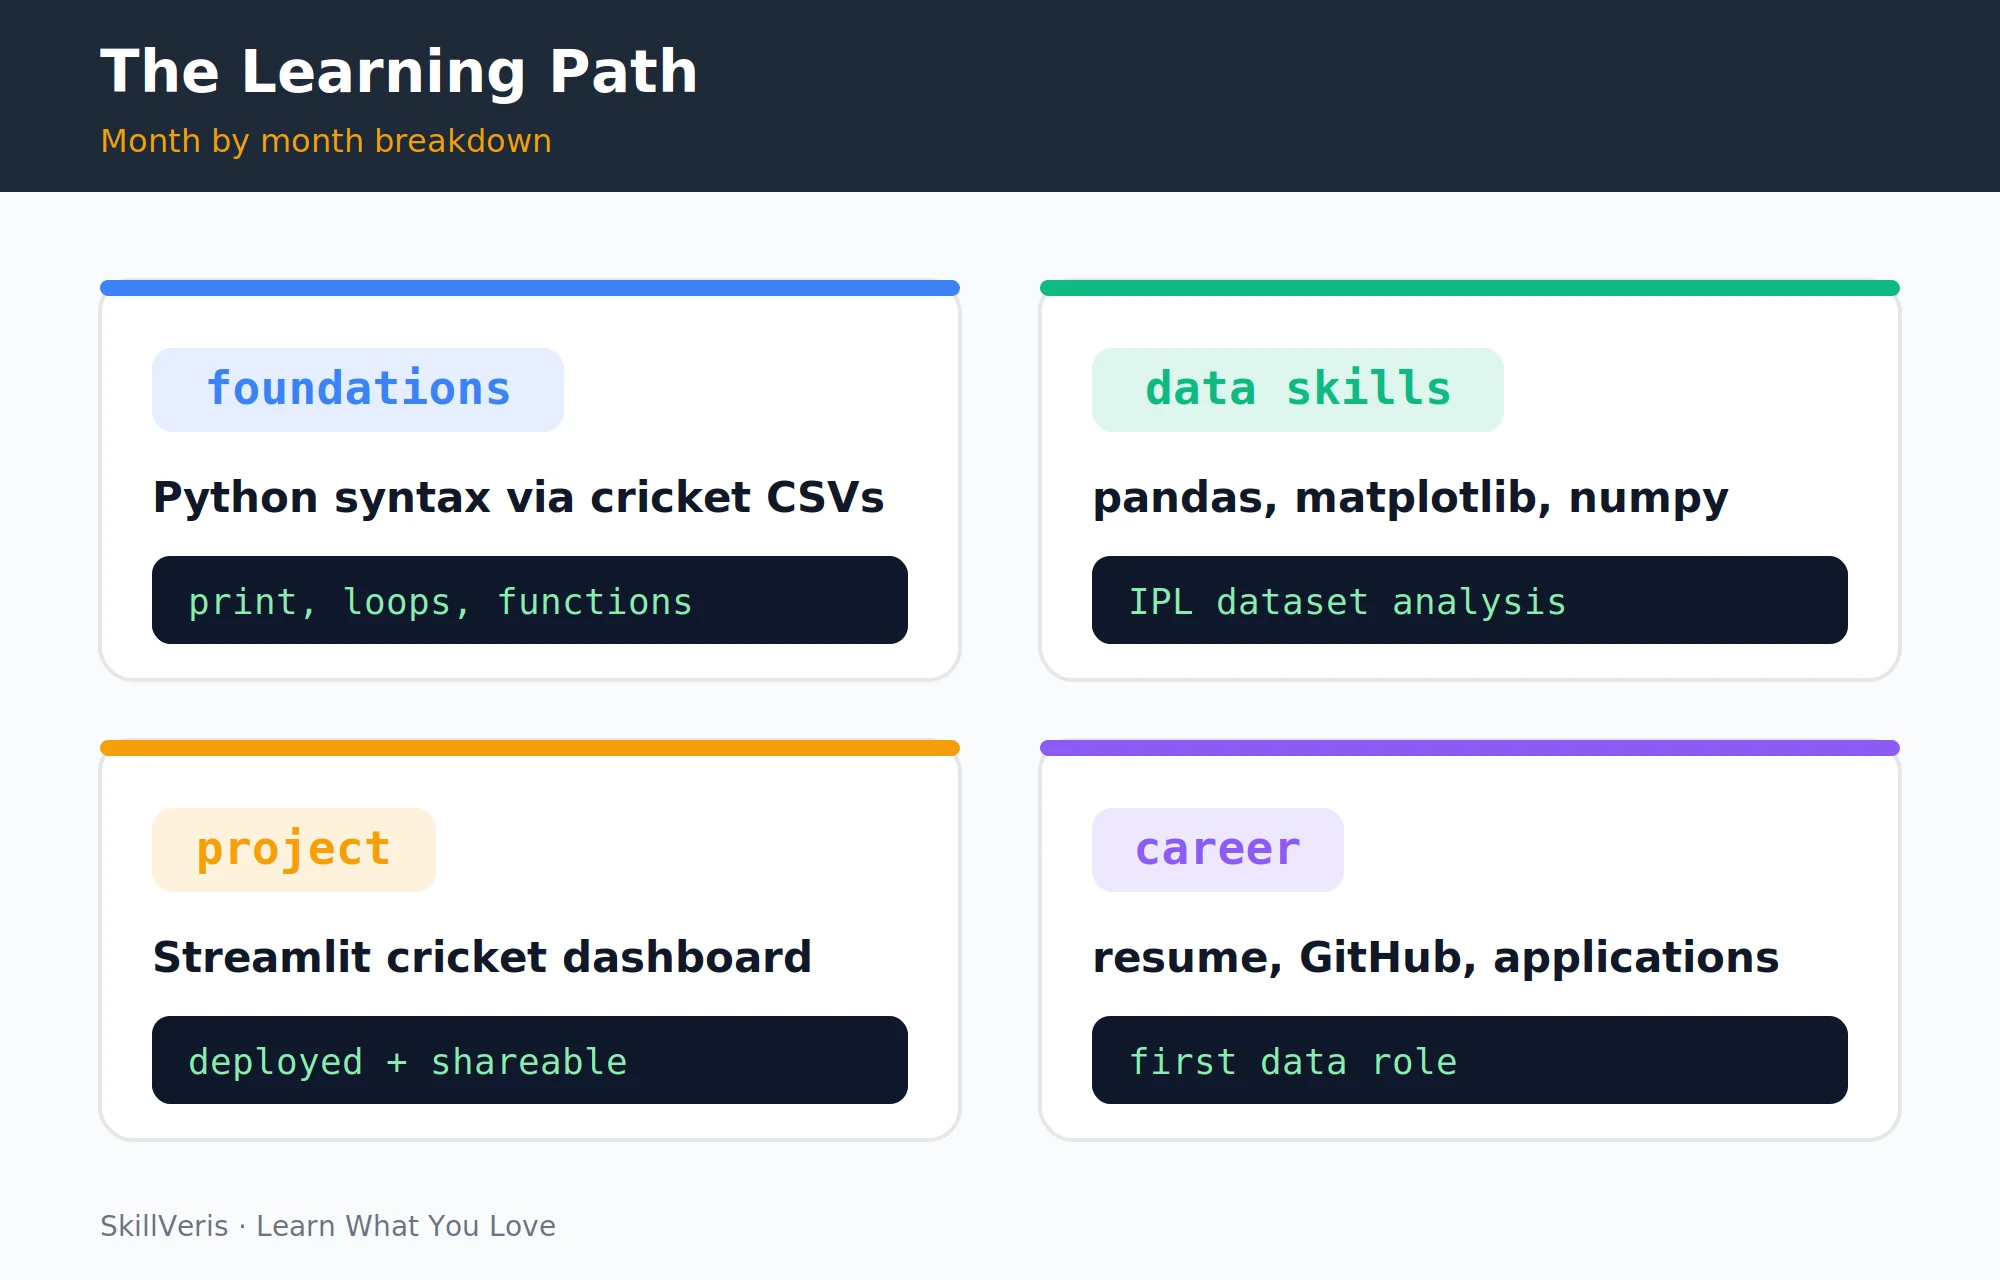
- Variables: rohit_runs = 0
- Loops: iterate through every delivery in a match CSV
- Conditionals: check if is_wicket == 1: wickets += 1
- Functions: calculate_strike_rate(runs, balls)
- File reading: open("ipl_2024.csv") and parse rows
4Month 3: Discovering Pandas
Arjun's 200-line CSV-parsing script could be replaced with five lines of pandas. The discovery that a library existed which made his hard work trivial felt initially deflating — then exhilarating.
He spent month 3 rewriting his cricket analysis in pandas and realising how much more he could now do.
He completed our Learn Python Through Cricket Statistics tutorial during this period, which gave him structured exercises that matched exactly what he'd been building. The timing felt like the material had been written for him.
By the end of month 3, he could answer 20 different cricket questions with pandas — head-to-head records, venue analysis, powerplay vs death-over scoring rates, season-by-season trends. Each one was a portfolio piece in waiting.
Pandas in five lines
The rewrite that replaced his entire script:
import pandas as pd
df = pd.read_csv("ipl_ball_by_ball.csv")
top_scorers = df.groupby("batsman")["batsman_runs"].sum().sort_values(ascending=False).head(10)
print(top_scorers)5Month 4: Data Visualisation
Numbers on a terminal are one thing. Charts that a non-programmer can understand are another. Month 4 was about matplotlib and Seaborn.
He posted a few of these charts on Twitter/X with "I made this with Python" captions. They got traction in cricket Twitter — not because the code was impressive, but because the insights were interesting to other cricket fans.
Two people asked him how to reproduce them. He wrote his first ever tutorial explaining the code, posted it to a blog he created in an afternoon, and got 300 visitors that week.
- Bar charts of top run-scorers (everyone in his office could understand this)
- Line charts of season-by-season scoring rates (showing T20 cricket getting more aggressive over time)
- Heatmaps of run rates per over across different teams
- Scatter plots of batting average vs strike rate (the eternal cricket debate, now visualised)
🔑Key Takeaway
Sharing your learning publicly, even imperfect work, creates opportunities that private studying never does. Those 300 visitors gave Arjun confidence that his work had value. That confidence carried him through the hard months that followed.
6Month 5: Building the Cricket Dashboard
Month 5 was the project month. Arjun discovered Streamlit — a Python library that turns data scripts into web apps without any frontend knowledge. He spent four weekends building a cricket analytics dashboard.
He deployed it on Streamlit Community Cloud for free. It had a public URL. He could share it with anyone — cricket fans, colleagues, potential employers.
This was the moment "learning to code" became "I built something real." See the Data Dashboard with Streamlit guide for the exact approach he used.
- Sidebar filters for team, season, and venue
- KPI cards showing team and player stats for the selected filter
- An interactive bar chart of top scorers
- A line chart of run rate by over
- A head-to-head comparison tool for any two batsmen
7Month 6: The Portfolio Push
With one strong project, Arjun pushed to build two more in month 6.
He also set up a GitHub profile with proper READMEs for all three projects, including screenshots, the live demo links, and a brief write-up of what he'd learned.
He updated his LinkedIn headline to "Data Analyst | Python | Pandas | Cricket Stats Enthusiast • Open to roles" and posted about his dashboard. A recruiter from a sports analytics startup reacted to the post.
- Project 2: A batting form predictor using rolling averages (introduced him to basic pandas time-series operations)
- Project 3: A salary vs performance analyser comparing IPL auction prices to player statistics (introduced him to merging datasets and correlation analysis)
8Month 7: Job Search Begins
Month 7 was humbling. Arjun applied to 60 positions. He got 7 first-round interviews, 4 technical assessments (which he passed 3 of), 2 second rounds, and 1 rejection after the final round.
The rejections stung, especially the final-round one. But each interview taught him something.
He spent an hour each day on SQL practice (Mode Analytics, HackerRank). The rest of month 7 was applications, interviews, and SQL.
- He needed to be faster at SQL window functions (two assessments tested these).
- His explanations of his projects were good — he knew the work intimately.
- Salary expectations in his city were higher than he'd assumed for data roles.
9Month 8: First Offer
The offer came from a mid-sized e-commerce company's analytics team. The role: junior data analyst. Responsibilities that matched his stack exactly: Python, pandas, SQL, and Tableau for dashboard reporting.
The hiring manager mentioned in the final round that the cricket dashboard was one of the most memorable portfolio pieces he'd seen — not because cricket was relevant to e-commerce, but because it showed genuine personal investment in the work.
The salary was a 40% increase over his back-office role. More importantly, it was the first step into a career he'd chosen deliberately.
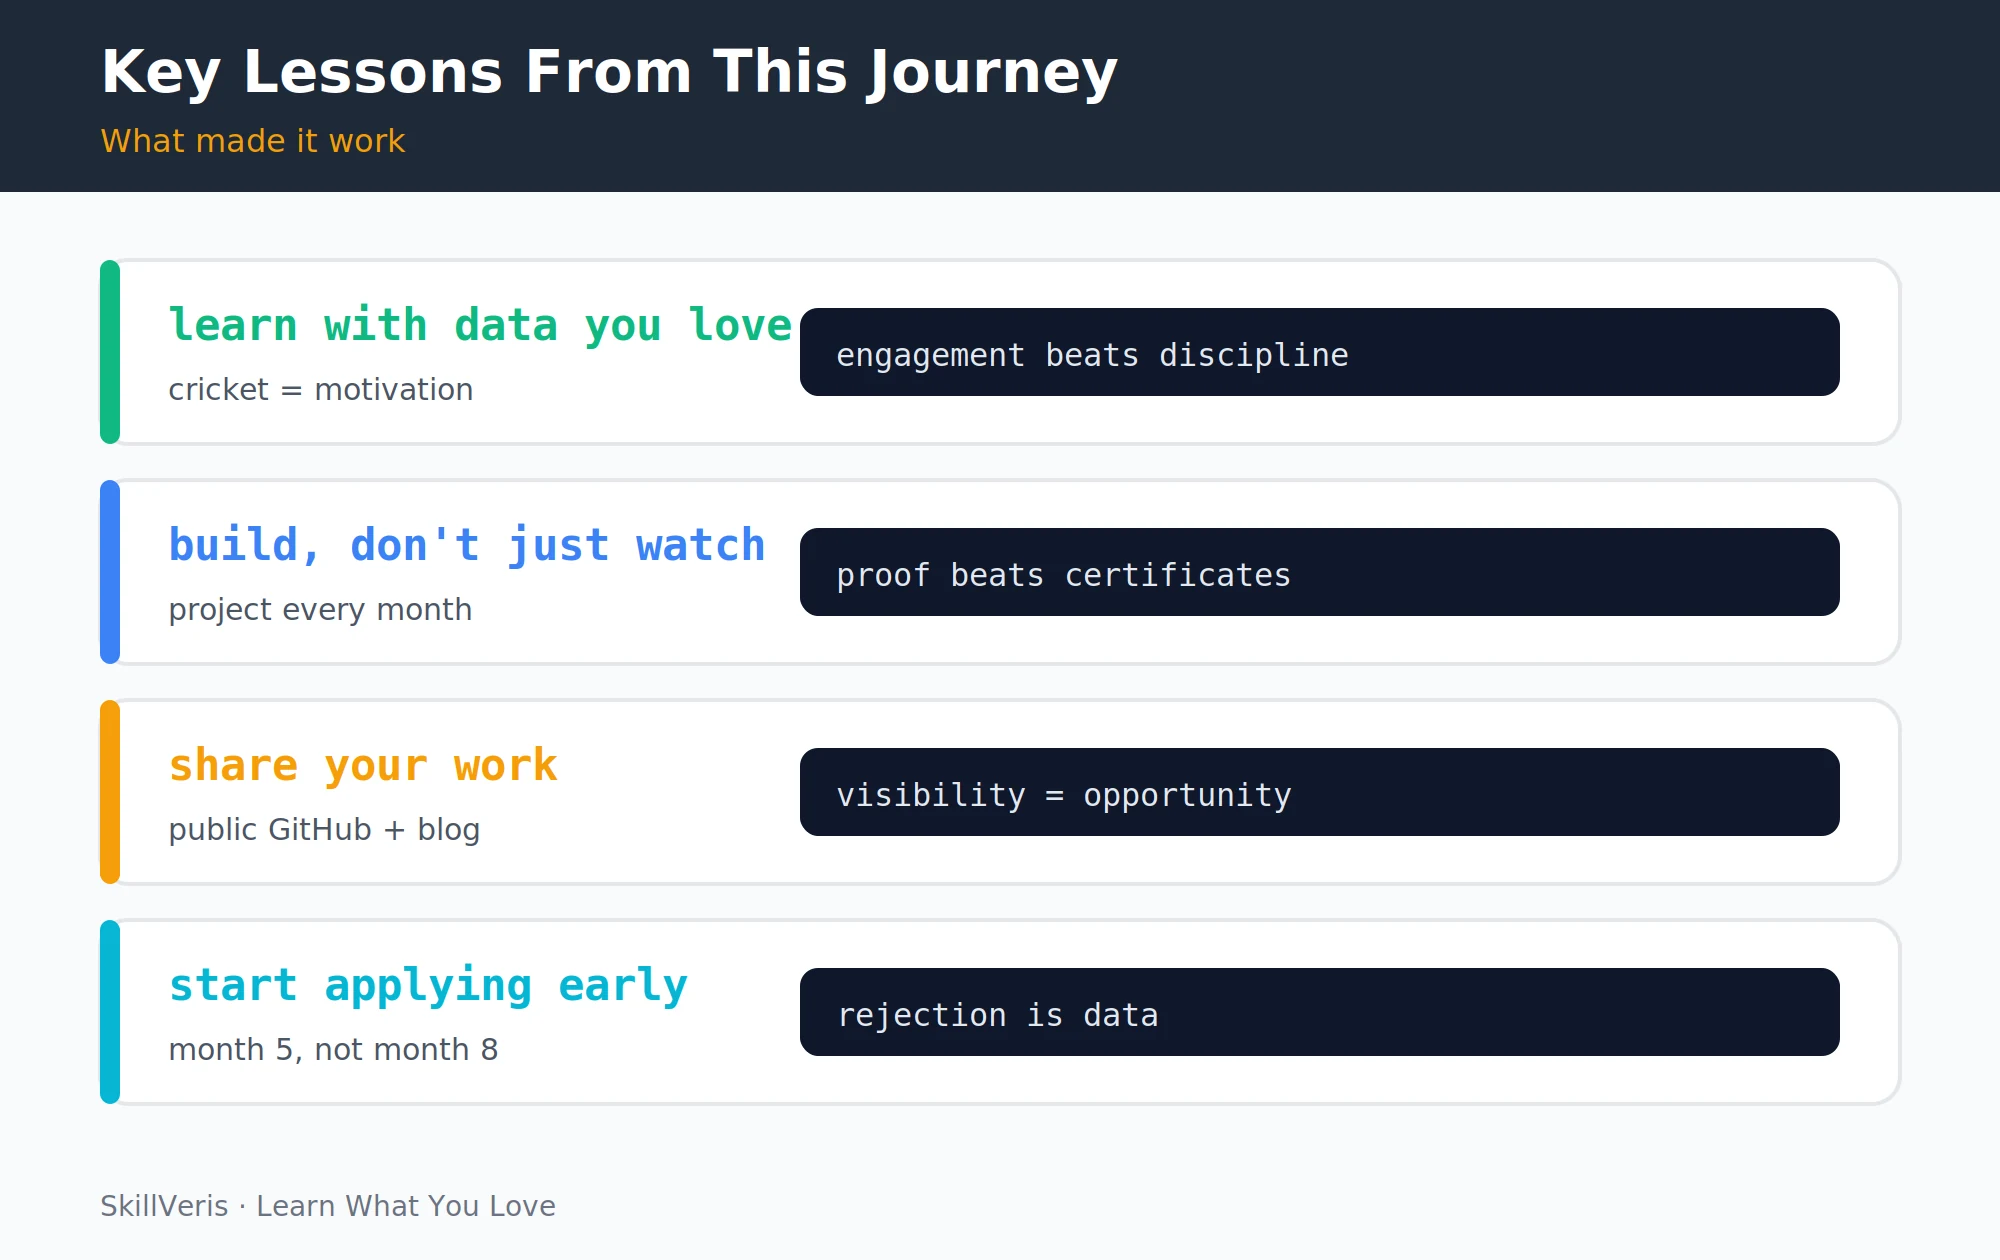
10What Made the Difference
Four principles distinguished this journey from the two previous failed attempts.
- Learning through a subject he cared about: motivation is not discipline — it's design. He didn't need willpower to study cricket data. The curiosity was already there.
- Building something every month: the discipline of producing a concrete output each month prevented tutorial paralysis. Messy code that runs beats perfect code that's never written.
- Sharing publicly: the blog post, the Twitter charts, the LinkedIn update. Each one created a thread of opportunity that private learning could not.
- Starting to apply in month 5, not month 8: early rejections and assessments revealed exactly what gaps to fill. Waiting until "ready" is waiting forever.
11The Tools Used
Every tool in the journey was free, and remains free. The only real investment was time — roughly 10–15 hours per week across 8 months, for a total cost of ₹0.
- Python 3.12 · All code · Free
- Pandas, Matplotlib, Seaborn · Data analysis + charts · Free
- Streamlit · Dashboard web app · Free
- VS Code · Code editor · Free
- GitHub · Portfolio hosting · Free
- Kaggle · Dataset source · Free
- Streamlit Community Cloud · App deployment · Free
12Key Takeaways
The journey distils into a handful of repeatable principles.
- Learning is faster and more durable when the data is something you care about. Cricket, football, music, film — use your interest as your learning vehicle.
- Building something every month creates a portfolio and develops the confidence to explain your work in interviews.
- Share your work publicly from month 1 — even imperfect, incomplete, early work. Visibility creates luck.
- Apply before you feel ready. Early interviews are free coaching sessions on what you need to improve.
13Your Turn: Start the Same Path
You can start Arjun's path right now with three structured resources.
- Learn Python Through Cricket Statistics — the exact tutorial that guided month 3.
- Data Analytics Roadmap for Beginners — the structured path with timelines.
- Build a Data Dashboard with Streamlit — the month 5 project, step by step.
14Frequently Asked Questions
Is 8 months realistic for someone with no coding background? For a data analyst role (not a software developer role), yes — with consistent effort of 10–15 hours per week. The 8-month timeline in this story is achievable but not guaranteed. Some learners take 12–18 months; some take 6. The variables are prior technical comfort, time available, and the strength of the portfolio built.
Do you need to use cricket data specifically, or can you use any data? Use whatever you care about. Football, Formula 1, Bollywood box office, stock prices, climate data, music charts. The cricket theme in this story exists to make the narrative concrete. The principle is: use real data you're curious about, because curiosity sustains effort over months.
What SQL skills should you prioritise for a data analyst interview? Window functions (ROW_NUMBER, RANK, LAG, LEAD), aggregations with GROUP BY and HAVING, CTEs, and multi-table JOINs. These appear in almost every data analyst assessment. Practise on Mode Analytics or StrataScratch with real interview questions.
Can this path work for someone who wants to become a software developer rather than a data analyst? Partly. The Python fundamentals and project-building approach transfer directly. For software development, you'd replace the data analysis focus with web development (FastAPI, React, databases) or Android (Kotlin). The principle — learn by building real projects in a domain you care about — applies universally.
Related Reading
Get The Print Version
Download a PDF of this article for offline reading.
About the Publisher
SkillVeris Team
Community Team
Real stories from SkillVeris learners who transitioned into tech and transformed their careers.
View all postsRelated Posts
Never miss an update
Get the latest tutorials and guides delivered to your inbox.
No spam. Unsubscribe anytime.