E-commerce Funnel Analysis: A Case Study
SkillVeris Team
Engineering Team
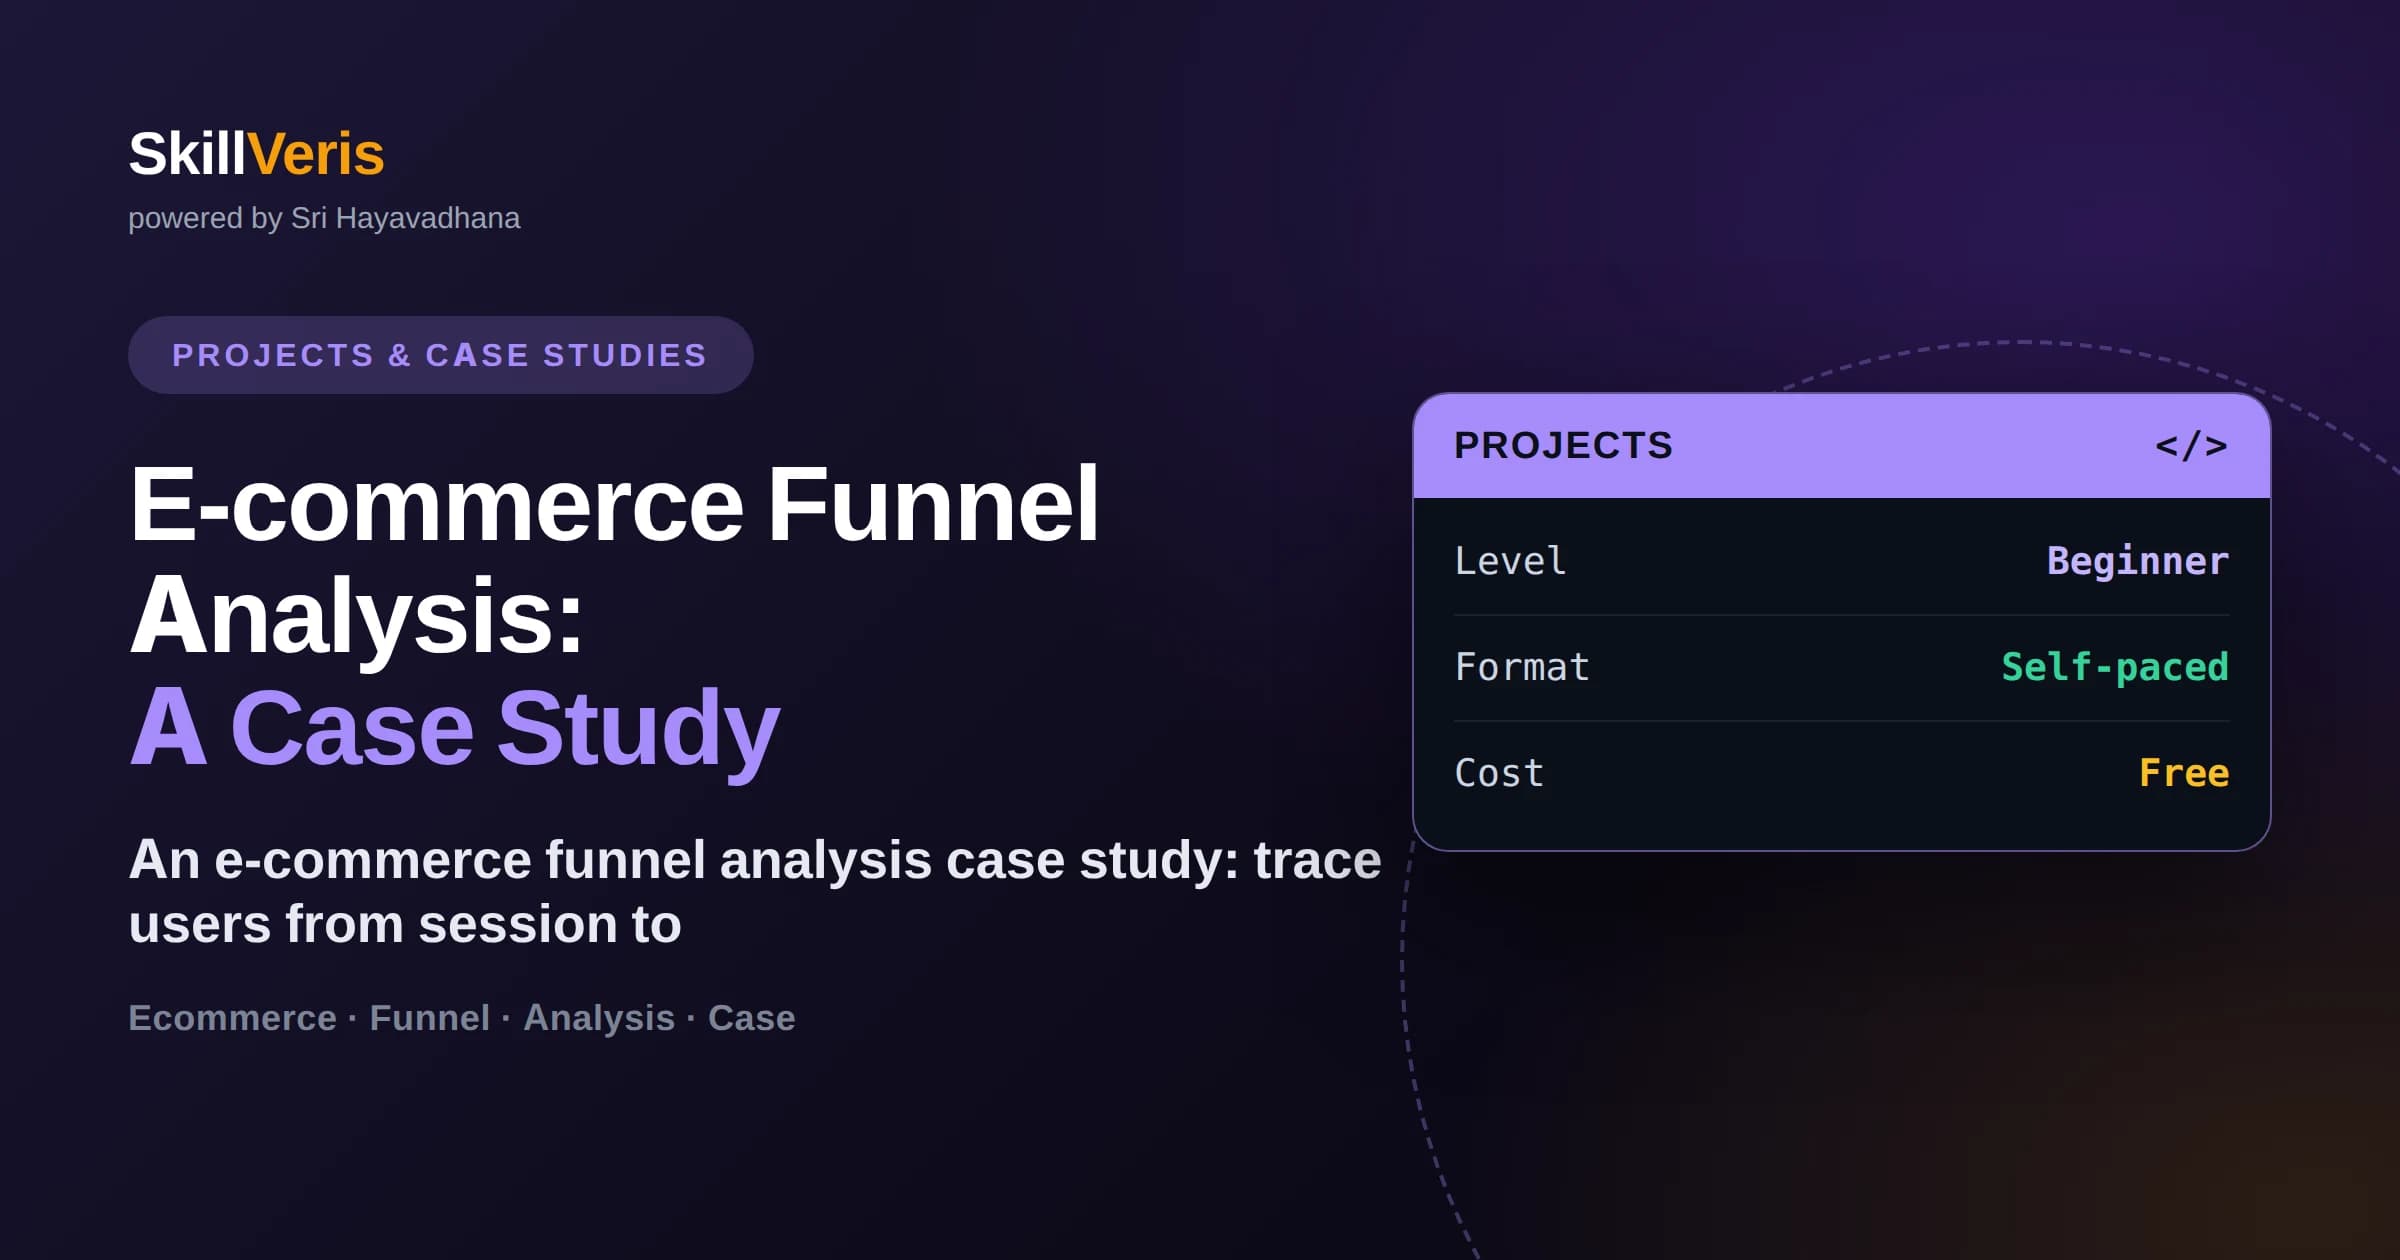
You will define a clear funnel of steps from session start through product view, cart, checkout, and purchase.
In this guide, you'll learn:
- You will compute step-to-step and overall conversion rates and understand which one answers which question.
- You will locate the biggest drop-off, the single most valuable output of a funnel analysis.
- You will segment the funnel by device, source, and new versus returning users to explain the drop.
- You will avoid classic pitfalls like double-counting events and ignoring non-linear paths.
1What E-commerce Funnel Analysis Is
E-commerce funnel analysis traces users through the sequence of steps from arriving on the site to completing a purchase, measuring how many advance at each stage and where they drop off. Its single most valuable output is identifying the biggest leak in the funnel, because fixing that step usually delivers the largest gain in revenue.
A typical funnel is session, product view, add to cart, begin checkout, and purchase. At each step some users leave, and the analysis quantifies that loss so the business knows precisely where to focus. This is one of the most in-demand skills in product and growth analytics.
This case study walks through the full process with event data: define the steps, compute conversion, find the drop-off, segment to explain it, and recommend experiments. The reasoning matters more than any single number.
2The Event Data You Start With
Funnel analysis starts from event data: a log where each row records a user or session id, an event name like 'product_view' or 'add_to_cart', and a timestamp. Analytics tools export exactly this shape, and you can practice with public e-commerce event datasets that mirror it.
Your first job is to understand the events available and map them to funnel steps. Not every event is a funnel step, and some steps may be represented by several event names, so a clear mapping from raw events to your defined stages is the foundation everything else rests on.
3Defining the Funnel Steps
Choose an ordered list of steps that represents the intended path to purchase, and define each precisely. A step should be a meaningful commitment, such as viewing a product or entering checkout, not every minor click. Too many steps make the funnel noisy; too few hide where the real drop happens.
Decide whether you analyze at the user level or the session level, because they answer different questions. Session-level funnels measure a single visit's efficiency, while user-level funnels allow for people who browse today and buy next week. State your choice explicitly, since it changes every conversion number.
🔑Order and grain matter
Two analysts can get different funnel numbers from the same data simply by choosing user-level versus session-level grain or a different step order. Define both up front and document them.
4Measuring Conversion at Each Step
There are two conversion rates to compute. Step-to-step conversion is the fraction who advance from one step to the next, such as cart to checkout. Overall conversion is the fraction of all starters who reach the end. Step-to-step rates locate the leak; overall conversion measures total funnel health.
In pandas, count the distinct users reaching each step, then divide successive counts. A clean funnel table lists each step, its user count, its step-to-step rate, and its cumulative rate from the top. That table alone often makes the biggest problem obvious at a glance.
- Step-to-step rate = users at step N+1 divided by users at step N.
- Overall conversion = users who purchased divided by users who started.
- Count distinct users or sessions, never raw events, to avoid inflation.
- Report both rates; each answers a different business question.
5Finding the Biggest Drop-Off
The step with the lowest step-to-step conversion is your biggest opportunity. If 60 percent of cart users abandon before checkout, that single step is leaking more than anywhere else, and improving it moves revenue more than polishing a step that already converts well.
Prioritize by impact, not by how easy a fix looks. A modest percentage improvement on a high-traffic, high-drop step usually beats a large improvement on a step few users reach. Quantifying the users lost at each stage turns opinion into a ranked list of where to invest effort.
6Segmenting to Explain the Drop
A single overall funnel hides the reasons behind a drop. Break the funnel down by device, traffic source, and new versus returning users. Often mobile checkout converts far worse than desktop, or paid traffic drops off at cart while organic converts, and those splits point directly at a cause.
Segmentation turns a symptom into a hypothesis. If mobile checkout is the weak point, the problem might be a clunky mobile form; if a particular source drops early, the traffic quality or landing page might be wrong. Segmenting is what converts a funnel chart into an actionable diagnosis.
7Common Pitfalls to Avoid
Watch for double-counting: if a user views three products, counting three product-view events instead of one user inflates that step. Always count distinct users or sessions. Also remember that real journeys are not strictly linear; people revisit, compare, and return, so a rigid step order can misclassify legitimate paths.
Be careful with time windows and cohorts. Comparing today's incomplete sessions with last month's complete ones skews the funnel, and mixing users who started in very different periods muddies the result. Define a consistent window and cohort so your comparison is fair.
⚠️Count users, not events
The most common funnel error is counting raw events instead of distinct users or sessions. It silently inflates busy steps and hides the real conversion picture.
8From Findings to Experiments
A funnel analysis should end in action. For the biggest, best-explained drop, propose a specific change and a way to measure it, such as simplifying the mobile checkout form and running an A/B test against the current version. Recommendations without a measurement plan are just opinions.
Prioritize experiments by expected impact and effort, and be honest that a funnel shows where users leave but not always why. The segmentation gives you strong hypotheses, and controlled experiments confirm which fix actually works. That loop, measure, hypothesize, test, is the heart of growth analytics.
9Frequently Asked Questions
What is a funnel in analytics? A funnel is the ordered sequence of steps users take toward a goal, like session, product view, cart, checkout, and purchase. Funnel analysis measures how many users advance at each step and where they drop off.
What is the difference between step-to-step and overall conversion? Step-to-step conversion is the fraction advancing from one specific step to the next, which locates the leak. Overall conversion is the fraction of all starters who reach the end, which measures total funnel health.
How do I find where to focus? Look for the step with the lowest step-to-step conversion that also has meaningful traffic. Fixing the biggest leak on a high-volume step usually delivers the largest revenue gain.
Why should I count users instead of events? Because one user can trigger many events, counting raw events inflates busy steps and distorts conversion. Counting distinct users or sessions gives an accurate picture of how many people actually advanced.
Does a funnel tell me why users drop off? Not directly. A funnel shows where users leave; segmenting by device, source, and user type gives you hypotheses about why, and controlled experiments confirm which fix truly works.
Can I learn funnel analysis for free? Yes. SkillVeris offers free data analysis and SQL courses covering event data, conversion metrics, segmentation, and A/B testing, which is everything this case study uses.
10Next Steps
You now have a repeatable funnel-analysis method: map events to defined steps, measure step-to-step and overall conversion, find the biggest drop-off, segment to explain it, and turn the finding into a prioritized experiment. This is exactly how product and growth teams decide what to build next.
To go further, explore the free data analysis, SQL, and A/B testing courses on SkillVeris and practice on a public e-commerce events dataset. Pair this with study notes on experimentation, and you will be ready to not just find where users leave, but prove how to keep them.
Get The Print Version
Download a PDF of this article for offline reading.
About the Publisher
SkillVeris Team
Engineering Team
Our engineering team documents real build journeys so you can learn by doing, not just reading.
View all postsRelated Posts
Never miss an update
Get the latest tutorials and guides delivered to your inbox.
No spam. Unsubscribe anytime.