Build a Weather Data Analysis Project
SkillVeris Team
Engineering Team
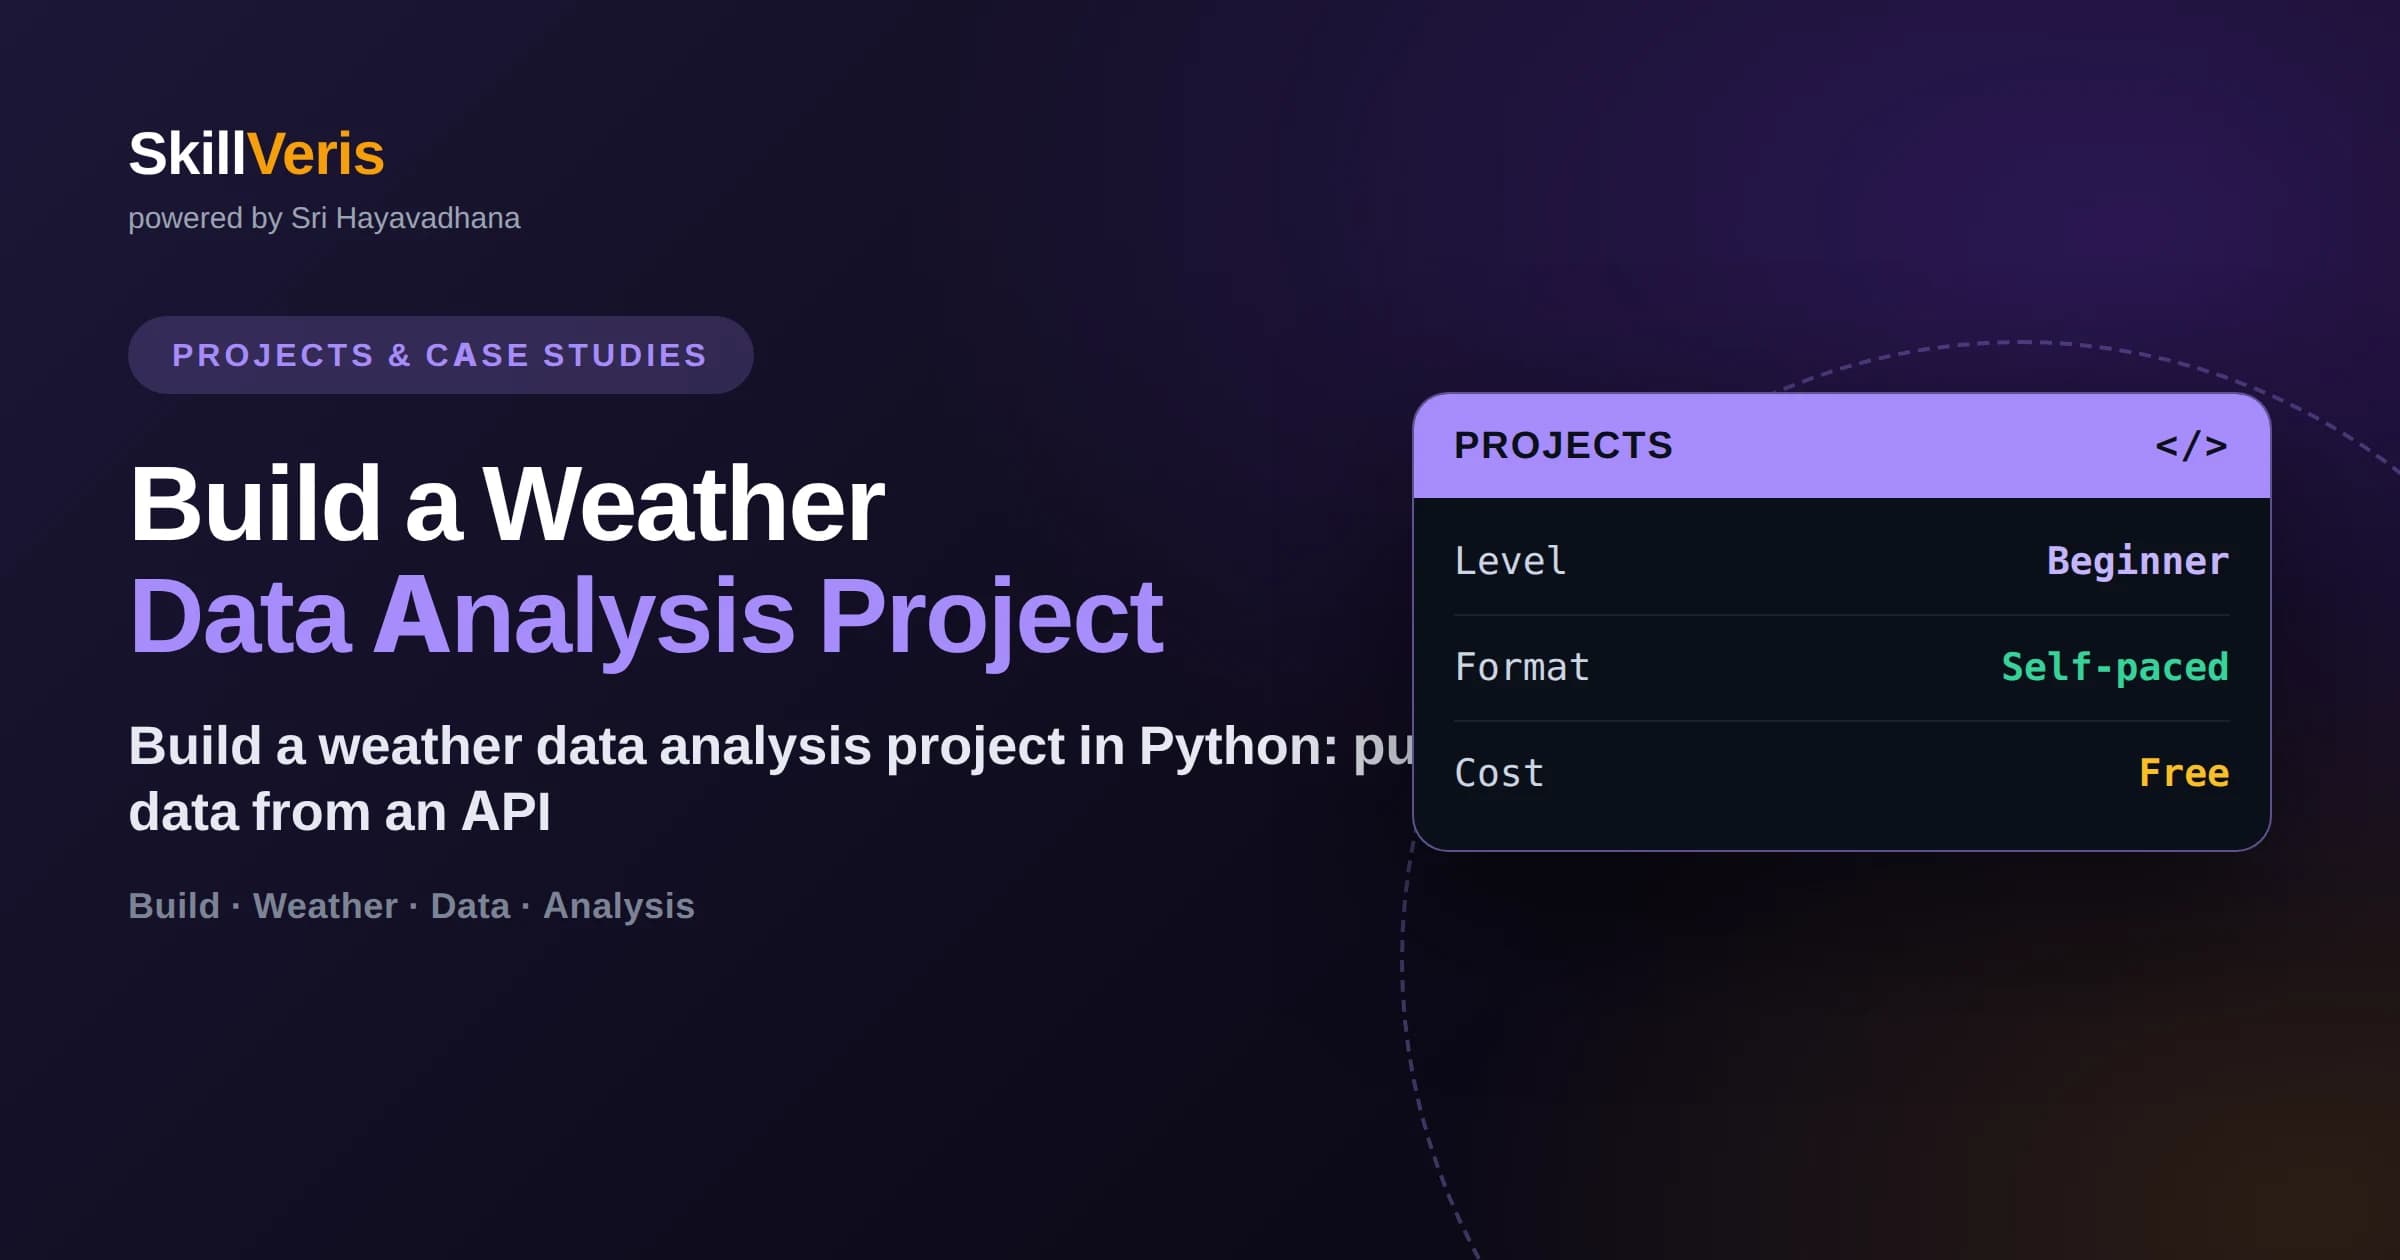
You will pull real weather data from a public API and handle keys, parameters, and JSON responses correctly.
In this guide, you'll learn:
- You will convert nested JSON into a tidy pandas time series indexed by datetime.
- You will resample daily readings into monthly and yearly summaries using pandas time-series tools.
- You will compute rolling averages and anomalies to separate real climate trends from short-term noise.
- You will visualize temperature and precipitation trends with clearly labeled, honest charts.
1What You Build in This Weather Project
In this weather data analysis project you pull historical or forecast weather data from an API, wrangle it into a clean pandas time series, and visualize temperature and climate trends. It is the ideal project for learning how to work with APIs and time-series data together, because weather data is real, abundant, and freely accessible.
You will use a service such as Open-Meteo, which offers free historical and forecast data without requiring an API key, or another provider of your choice. The skills, calling an API, parsing JSON, and resampling a time series, transfer to finance, IoT, and any date-stamped data.
A recurring theme is honesty about what the data means. Weather is naturally noisy, and one warm month is not a climate trend. Learning to separate short-term variability from long-term signal is both a data skill and a matter of integrity.
2Pulling Data From a Weather API
Weather APIs take a request specifying a location (latitude and longitude), a date range, and the variables you want, like temperature and precipitation. You call them with Python's requests library, passing these as URL parameters, and receive a JSON response back.
Always check the status code and read the API's documentation for rate limits and required fields. Store your request parameters in variables at the top of your script so the whole pipeline is easy to rerun for a different city or period. If a provider needs an API key, keep it out of your code in an environment variable.
💡Cache the raw response
Save the raw API JSON to a file after your first successful call. You can then develop your analysis offline without repeatedly hitting the API, which is faster and respects rate limits.
3Turning JSON Into a Time Series
API responses are usually nested JSON with parallel arrays: one list of timestamps and separate lists of temperatures and other variables. Build a DataFrame by pairing the time array with each value array, then convert the time column with pd.to_datetime and set it as the index.
A proper datetime index unlocks pandas' time-series superpowers: slicing by date range, resampling, and rolling windows all depend on it. Getting this index right is the most important step in any time-series project, so verify it before moving on.
4Resampling to Monthly and Yearly
Hourly or daily readings are too granular to see long-term patterns. Use resample to aggregate: df['temp'].resample('M').mean() gives monthly average temperature, and resample('Y') gives yearly. Choose the aggregation that fits the variable, mean for temperature but sum for precipitation.
Resampling is the time-series equivalent of GROUP BY, collapsing many fine-grained rows into meaningful summaries. Comparing yearly averages across a long record is how you start to see whether a place is warming, and it is far more reliable than comparing individual days.
- resample('D') for daily, 'M' for month-end, 'Y' for year-end summaries.
- Use .mean() for temperature and humidity, .sum() for rainfall.
- Use .max() and .min() to track record highs and lows over each period.
- Always resample on a proper datetime index or it will silently fail.
5Rolling Averages and Anomalies
To reveal trends buried in noise, apply a rolling average over a long window, such as a 12-month mean, which cancels the seasonal cycle so any remaining slope reflects a genuine shift. This is the same smoothing idea used across all time-series work.
Even more revealing is the anomaly: subtract each period's value from a long-term baseline average for that same season. Anomalies strip out predictable seasonality and expose whether recent readings run above or below normal, which is exactly how climate scientists communicate change.
6Visualizing Temperature and Climate Trends
Plot monthly averages as a line chart to show the seasonal cycle, then overlay a 12-month rolling average to expose the underlying trend. For anomalies, a bar chart colored by sign (above or below baseline) makes warm and cool periods instantly readable.
Label your axes, state the baseline period you used for anomalies, and cite the data source. Never truncate a temperature axis to exaggerate a change, and always show enough years for a trend claim to be credible. Honest scaling protects your conclusions from fair criticism.
⚠️One season is not a trend
A single hot summer or cold winter is weather, not climate. Trend claims need many years of data and a clearly stated baseline, or they mislead more than they inform.
7Weather Variability Versus Climate Signal
Weather is what happens day to day and is inherently variable; climate is the long-term statistical pattern. Your rolling averages and multi-year comparisons are attempts to see the climate signal through the weather noise. Confusing the two is the most common misinterpretation of weather data.
Be honest about limits. A single city's few years of data cannot prove a global trend, and short records are dominated by natural variability. Describe what your dataset supports, note its scope, and avoid stretching a local observation into a sweeping claim.
8Frequently Asked Questions
Which weather API should I use? Open-Meteo is a strong free choice because it offers historical and forecast data without requiring a key. Providers like OpenWeatherMap also work but usually need a free API key and have stricter rate limits.
How do I turn nested API JSON into a DataFrame? Weather APIs typically return parallel arrays of timestamps and values. Pair the time array with each value array to build the DataFrame, convert the time column with pd.to_datetime, and set it as the index.
What does resampling do in a time series? Resampling aggregates data to a different frequency, like turning hourly readings into monthly averages. It works only on a proper datetime index and is the time-series version of grouping by period.
Why use anomalies instead of raw temperatures? Anomalies subtract a seasonal baseline, removing the predictable yearly cycle so you can see whether readings are above or below normal. This makes real trends visible that raw values would hide.
Can a few years of data show climate change? Not reliably. Short records are dominated by natural variability, so trend claims need many years and a clearly stated baseline. You can still practice the analysis honestly by describing only what your data supports.
Can I learn this for free? Yes. SkillVeris offers free Python, pandas, and data visualization courses covering APIs, time series, and charting, which is everything this weather project needs.
9Next Steps
You have built a full time-series pipeline: call a weather API, parse JSON into a datetime-indexed DataFrame, resample to monthly and yearly summaries, compute rolling averages and anomalies, and visualize trends honestly. These are the exact skills that power any date-stamped analysis.
To keep learning, explore the free Python, pandas, and data visualization courses on SkillVeris and try comparing two cities or two decades. Add study notes on time series and APIs, and you will be ready to analyze finance, sensor, or traffic data with the same toolkit.
Related Reading
Get The Print Version
Download a PDF of this article for offline reading.
About the Publisher
SkillVeris Team
Engineering Team
Our engineering team documents real build journeys so you can learn by doing, not just reading.
View all postsRelated Posts
Never miss an update
Get the latest tutorials and guides delivered to your inbox.
No spam. Unsubscribe anytime.