Understanding Monitoring and Observability
SkillVeris Team
Cloud & Security Team
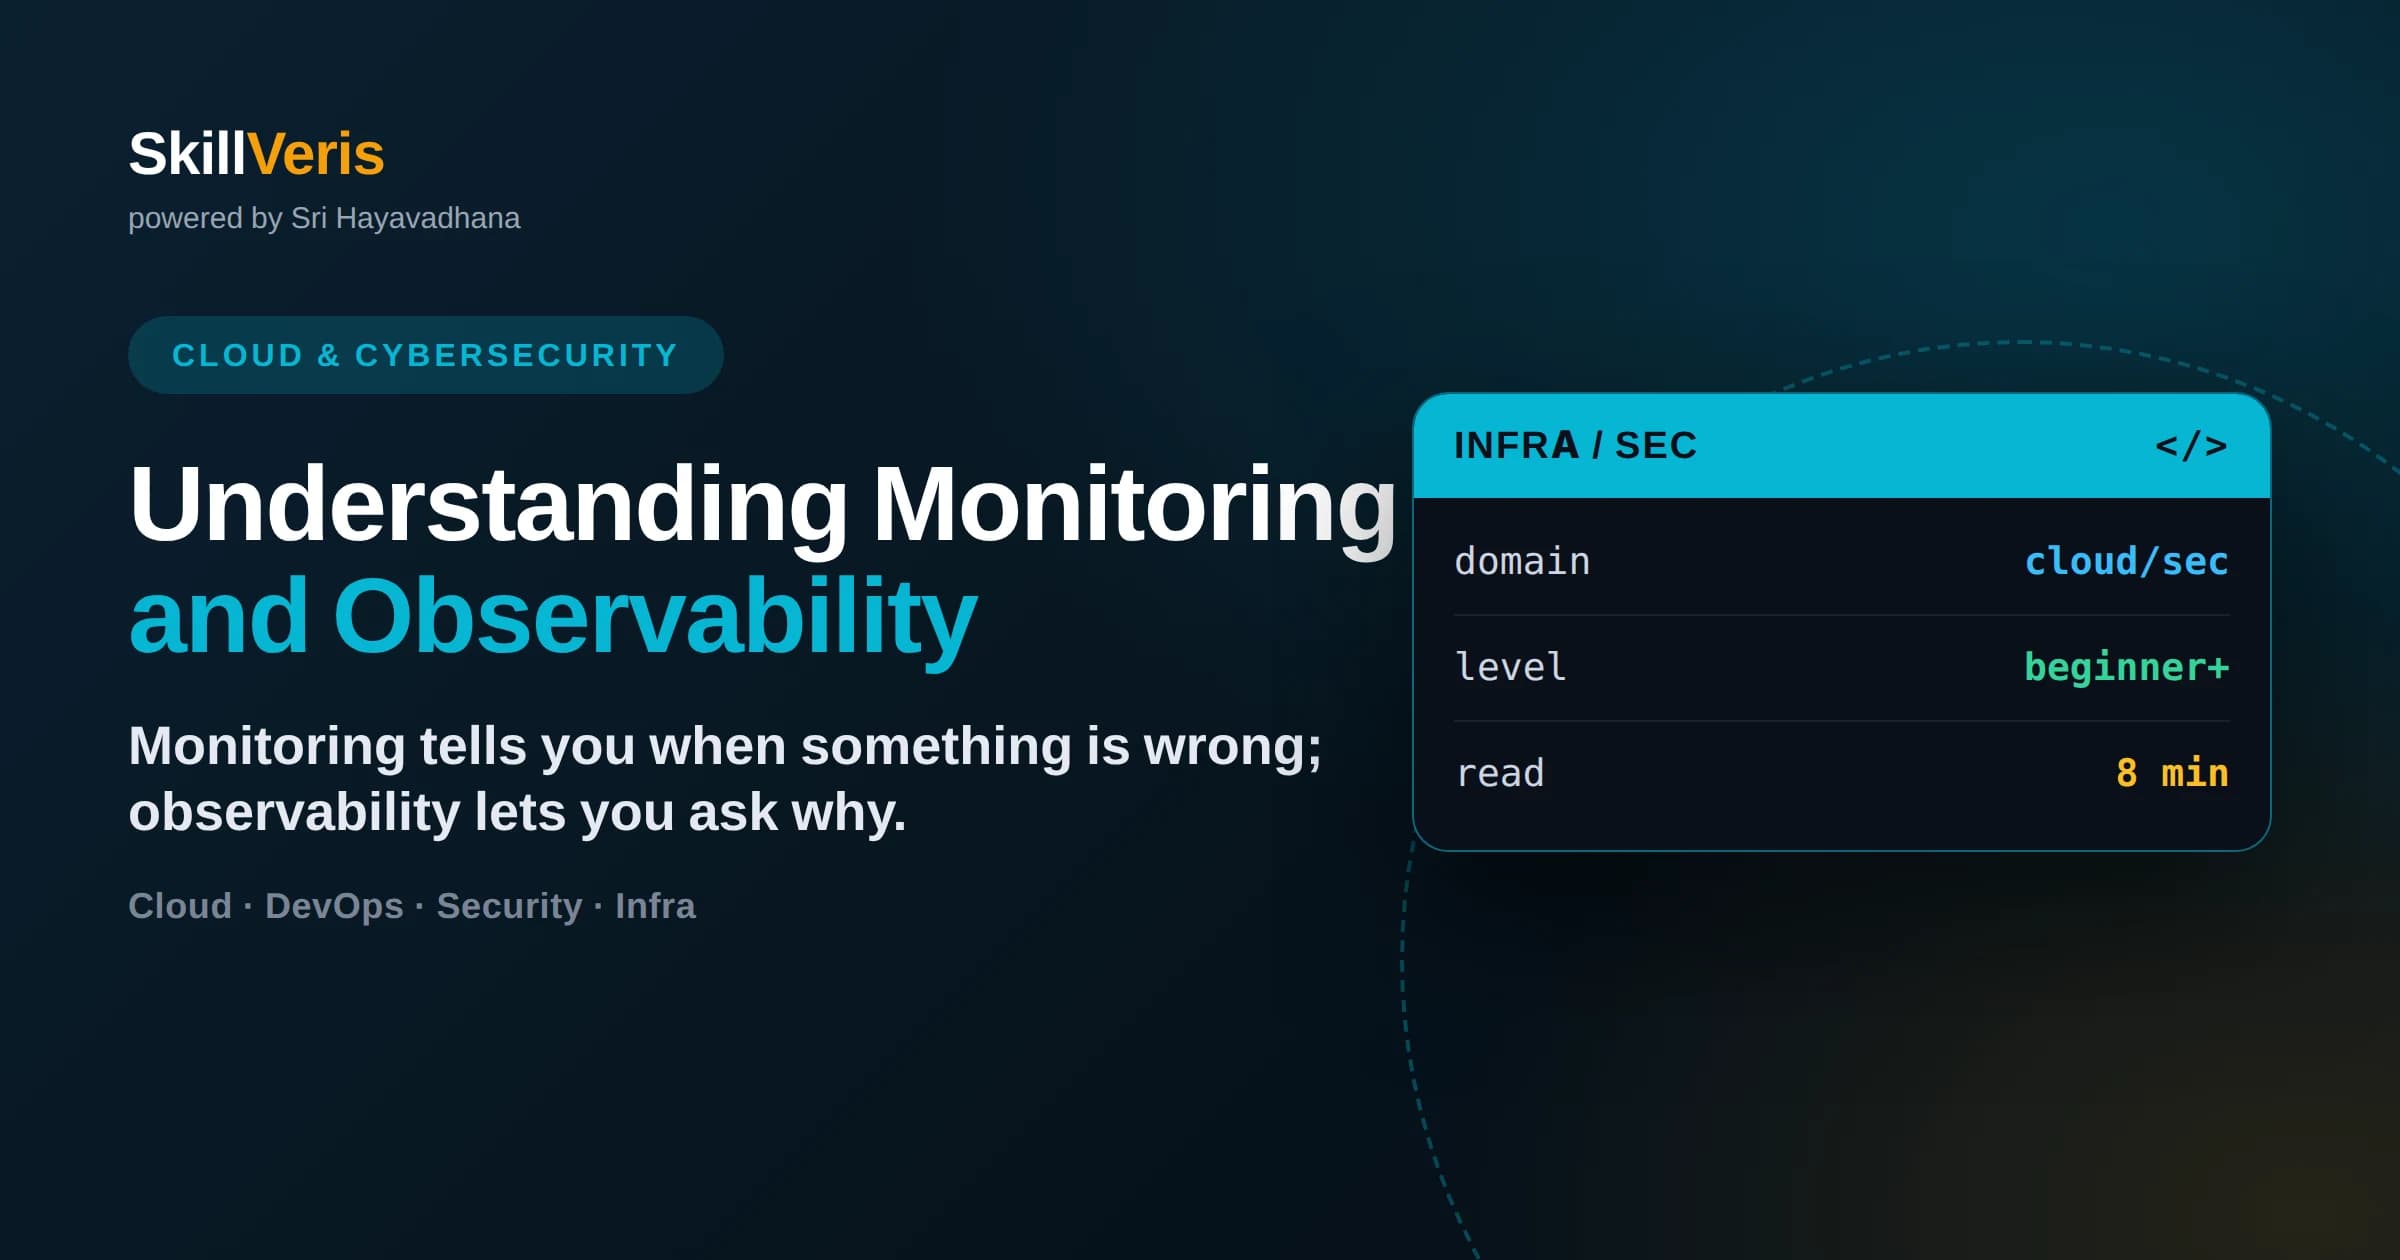
Monitoring tracks known signals to tell you when something is wrong; observability gives you enough data to ask why, including questions you did not predict.
In this guide, you'll learn:
- The three pillars of observability are metrics, logs, and traces — each answering a different kind of question about your system.
- Metrics are cheap numeric time series ideal for dashboards and alerts; logs are detailed event records; traces follow one request across services.
- Monitoring answers questions you knew to ask in advance; observability helps you debug novel problems in complex, distributed systems.
- Good alerting is based on user-facing symptoms and clear thresholds, not noisy signals that train teams to ignore alarms.
1Monitoring vs Observability
Monitoring is watching known signals to tell you when something is wrong; observability is having enough data about a system to ask why it is wrong — including questions you never anticipated. Monitoring is a subset of the broader capability that observability provides.
Put simply, monitoring answers questions you decided to ask in advance, like is CPU above 90 percent. Observability lets you explore an unexpected failure after the fact, tracing a slow request through five services to find the one database call that stalled. Modern distributed systems fail in ways you cannot fully predict, so both matter.
2The Three Pillars
Observability is commonly described through three types of telemetry data, each answering a different question.
- Metrics: numeric measurements over time — request rate, error count, memory usage. Great for dashboards and alerts.
- Logs: timestamped records of discrete events, from an error stack trace to an audit entry. Great for detail.
- Traces: the path of a single request as it moves across services, showing where time was spent.
- Together they let you spot a problem (metrics), understand its context (logs), and locate it (traces).
🔑How They Combine
A metric tells you error rate spiked. A trace shows which service caused it. A log reveals the exact exception. You usually need all three to close an incident.
3Metrics: The Vital Signs
Metrics are numeric values sampled over time, stored efficiently as time series. Because they are compact, you can retain them long-term and query them fast, which makes them the backbone of dashboards and alerts.
- Counters: values that only increase, like total requests served.
- Gauges: values that go up and down, like current memory usage.
- Histograms: distributions, like request latency percentiles.
- The RED method tracks Rate, Errors, and Duration for request-driven services.
Tools
Prometheus is the widely used open-source metrics database, often paired with Grafana for dashboards. It scrapes metrics your services expose and stores them as queryable time series.
4Logs and Traces
Where metrics tell you that something changed, logs and traces tell you what and where. They provide the detail metrics deliberately leave out.
- Structured logs (JSON) are searchable and machine-parseable — far better than free-text lines.
- Correlation IDs tie together all logs from a single request across services.
- Distributed traces break a request into spans, one per service or operation.
- Trace waterfalls reveal which span consumed the most time, pinpointing bottlenecks.
💡Structure Everything
Log in structured JSON with a request ID field. It is the difference between grepping millions of text lines and running a precise query that returns exactly the request you care about.
5What Good Alerting Looks Like
The goal of alerting is to notify a human when, and only when, action is needed. Too many alerts are as dangerous as too few, because teams learn to ignore a noisy pager.
The strongest alerts fire on user-facing symptoms — elevated error rates, slow responses, a checkout flow failing — rather than internal causes like high CPU that may be harmless. Symptom-based alerting keeps signal high and directs attention to what actually affects people.
SLOs and Error Budgets
Many teams define Service Level Objectives, a target like 99.9 percent of requests succeeding, and alert when they are burning through the remaining error budget. This ties alerts directly to the experience you promised users.
6Common Mistakes to Avoid
Most observability problems are about too much noise or too little context, not missing tools.
- Alerting on every metric, creating fatigue until real alerts get ignored.
- Logging unstructured free text that is impossible to query at scale.
- Collecting metrics but never adding traces, leaving you blind in distributed failures.
- Building dashboards nobody looks at instead of alerts that reach the right person.
⚠️Watch Out
Alert fatigue is a real outage risk. When every alert is urgent, none are — and the one that matters gets silenced along with the noise.
7Best Practices
A few practices keep observability useful as systems grow more complex.
- Instrument for the questions you will need to answer during an incident, not just default counters.
- Adopt OpenTelemetry so metrics, logs, and traces share standards and vendors are interchangeable.
- Alert on symptoms users feel, and route each alert to a clear owner.
- Use correlation IDs so a single request can be followed across logs and traces.
- Define SLOs so you measure reliability against user expectations, not raw resource numbers.
8Key Takeaways
The essentials of monitoring and observability come down to a few durable ideas.
- Monitoring tells you when something is wrong; observability helps you ask why.
- The three pillars — metrics, logs, and traces — each answer a different question.
- Metrics power dashboards and alerts; logs give detail; traces locate bottlenecks.
- Good alerts fire on user-facing symptoms, not noisy internal signals.
- Instrument deliberately, adopt OpenTelemetry, and tie alerts to SLOs.
9Frequently Asked Questions
Q: What is the difference between monitoring and observability? A: Monitoring watches predefined signals to tell you when something is wrong. Observability provides rich enough data — metrics, logs, and traces — to investigate why, including problems you never anticipated. Monitoring is essentially a subset of observability.
Q: What are the three pillars of observability? A: Metrics, logs, and traces. Metrics are numeric time series for dashboards and alerts, logs are detailed records of discrete events, and traces follow a single request across services. Together they let you detect, understand, and locate issues.
Q: What is OpenTelemetry? A: OpenTelemetry is an open standard and set of libraries for generating and collecting metrics, logs, and traces in a vendor-neutral way. Instrumenting with it lets you switch backends like Prometheus, Jaeger, or a commercial platform without rewriting your code.
Q: How do I avoid alert fatigue? A: Alert on user-facing symptoms rather than every internal metric, set thresholds that indicate real action is needed, and route each alert to a clear owner. Tying alerts to SLOs and error budgets keeps them meaningful instead of constant background noise.
Related Reading
Get The Print Version
Download a PDF of this article for offline reading.
About the Publisher
SkillVeris Team
Cloud & Security Team
Our cloud and security experts break down complex infrastructure topics into practical, beginner-friendly guides.
View all postsRelated Posts
Never miss an update
Get the latest tutorials and guides delivered to your inbox.
No spam. Unsubscribe anytime.