Learn Data Science Through Bollywood Box Office Analytics
SkillVeris Team
Content Team
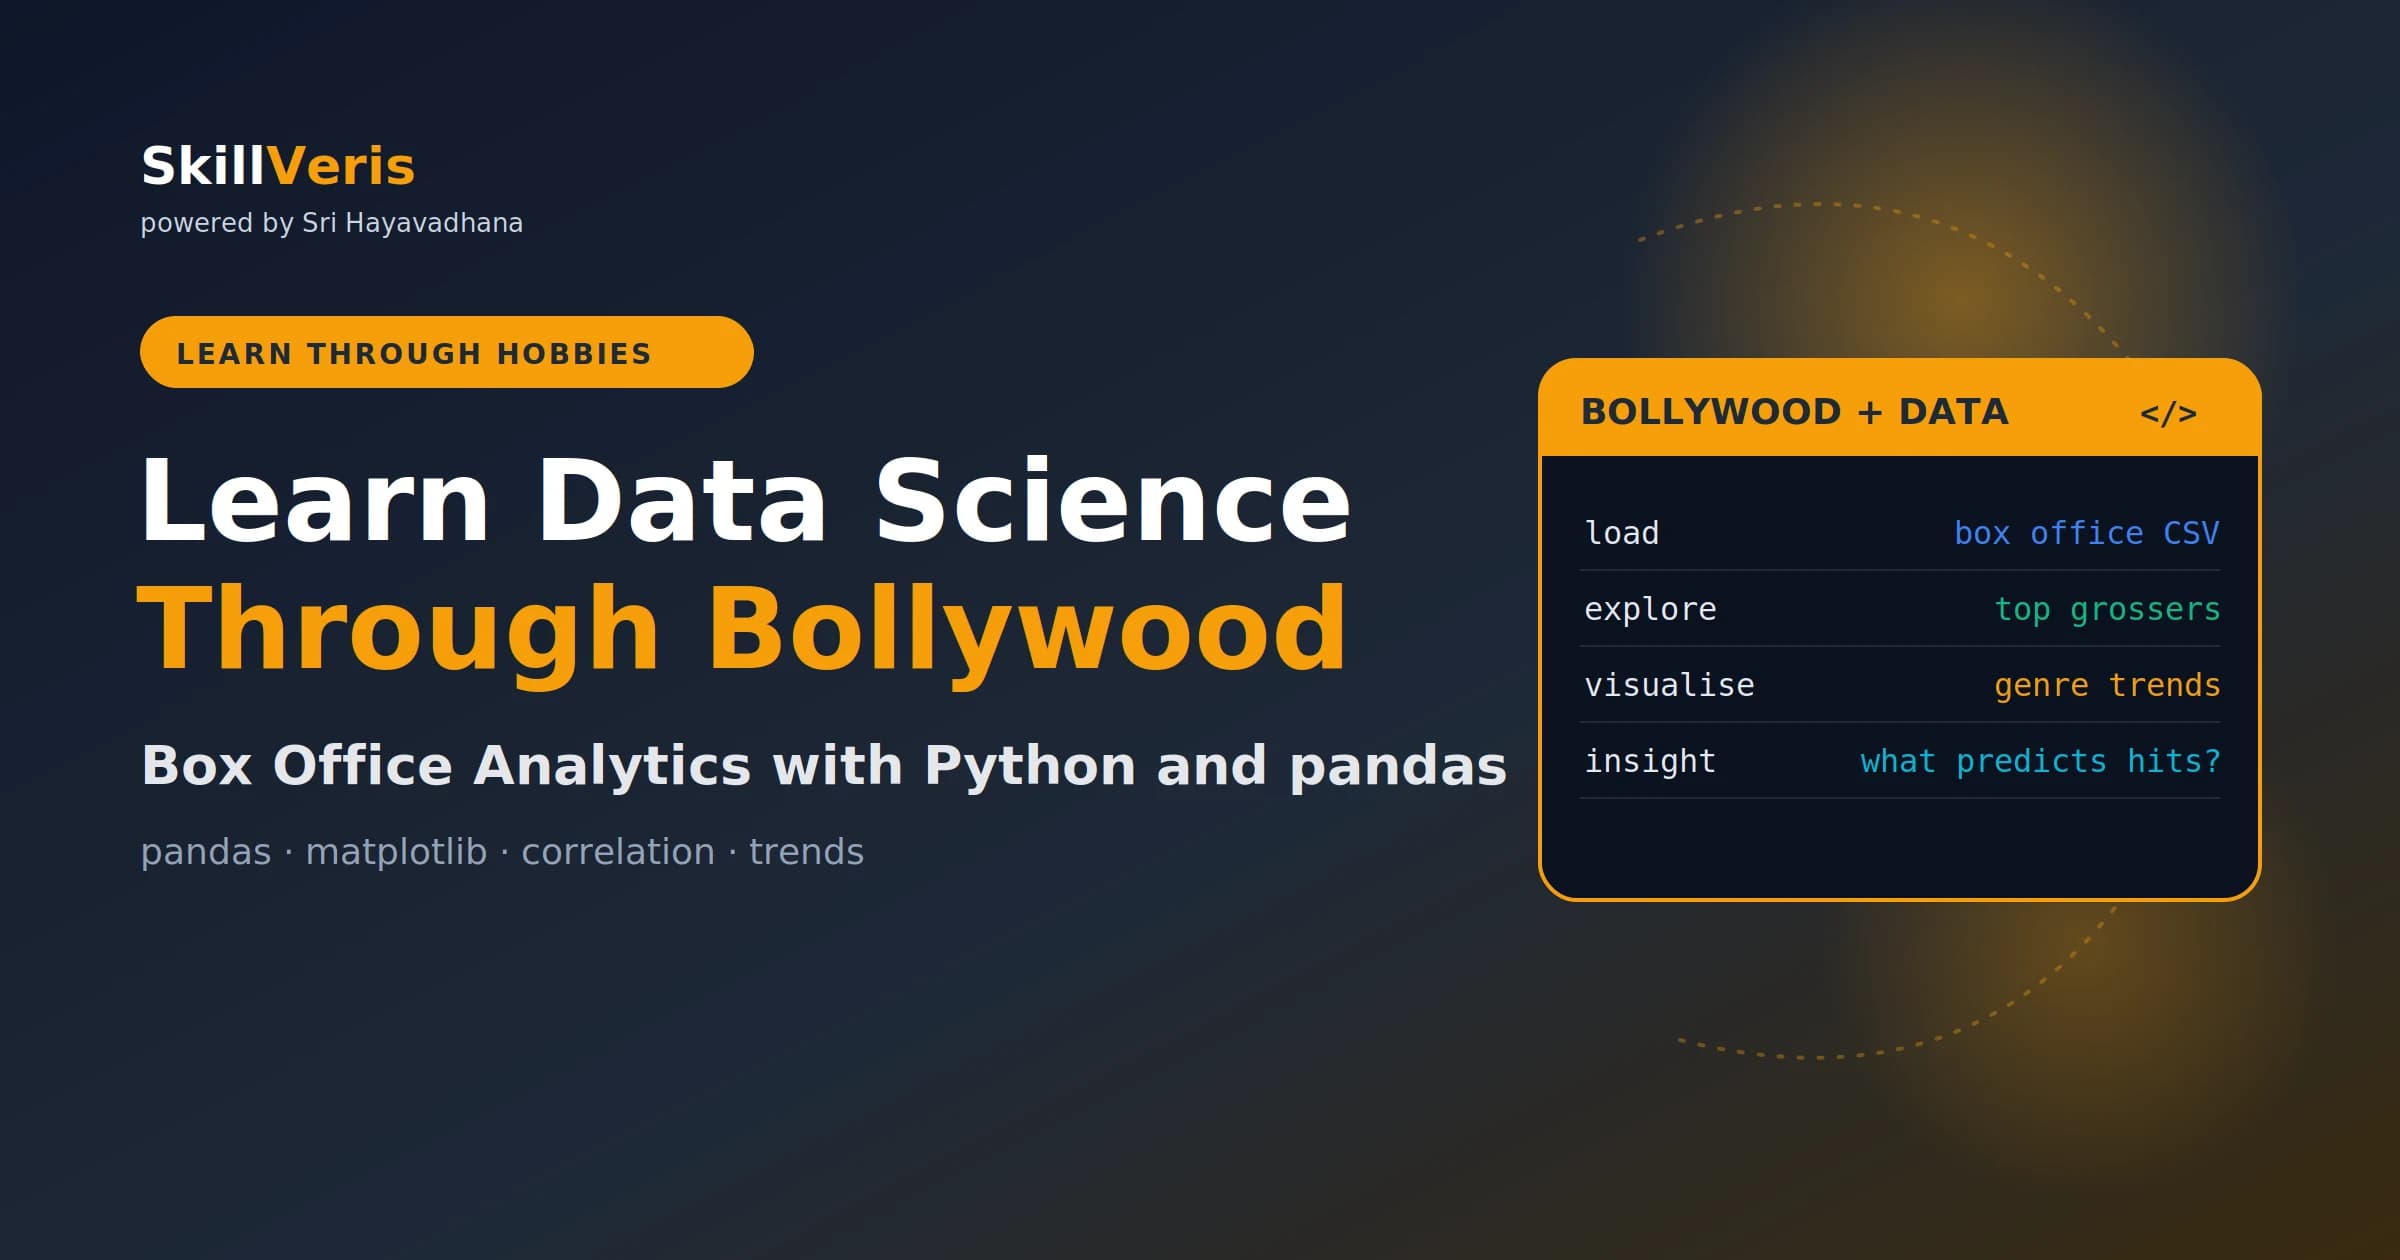
Learning data science through entertainment data is far more engaging than generic datasets.
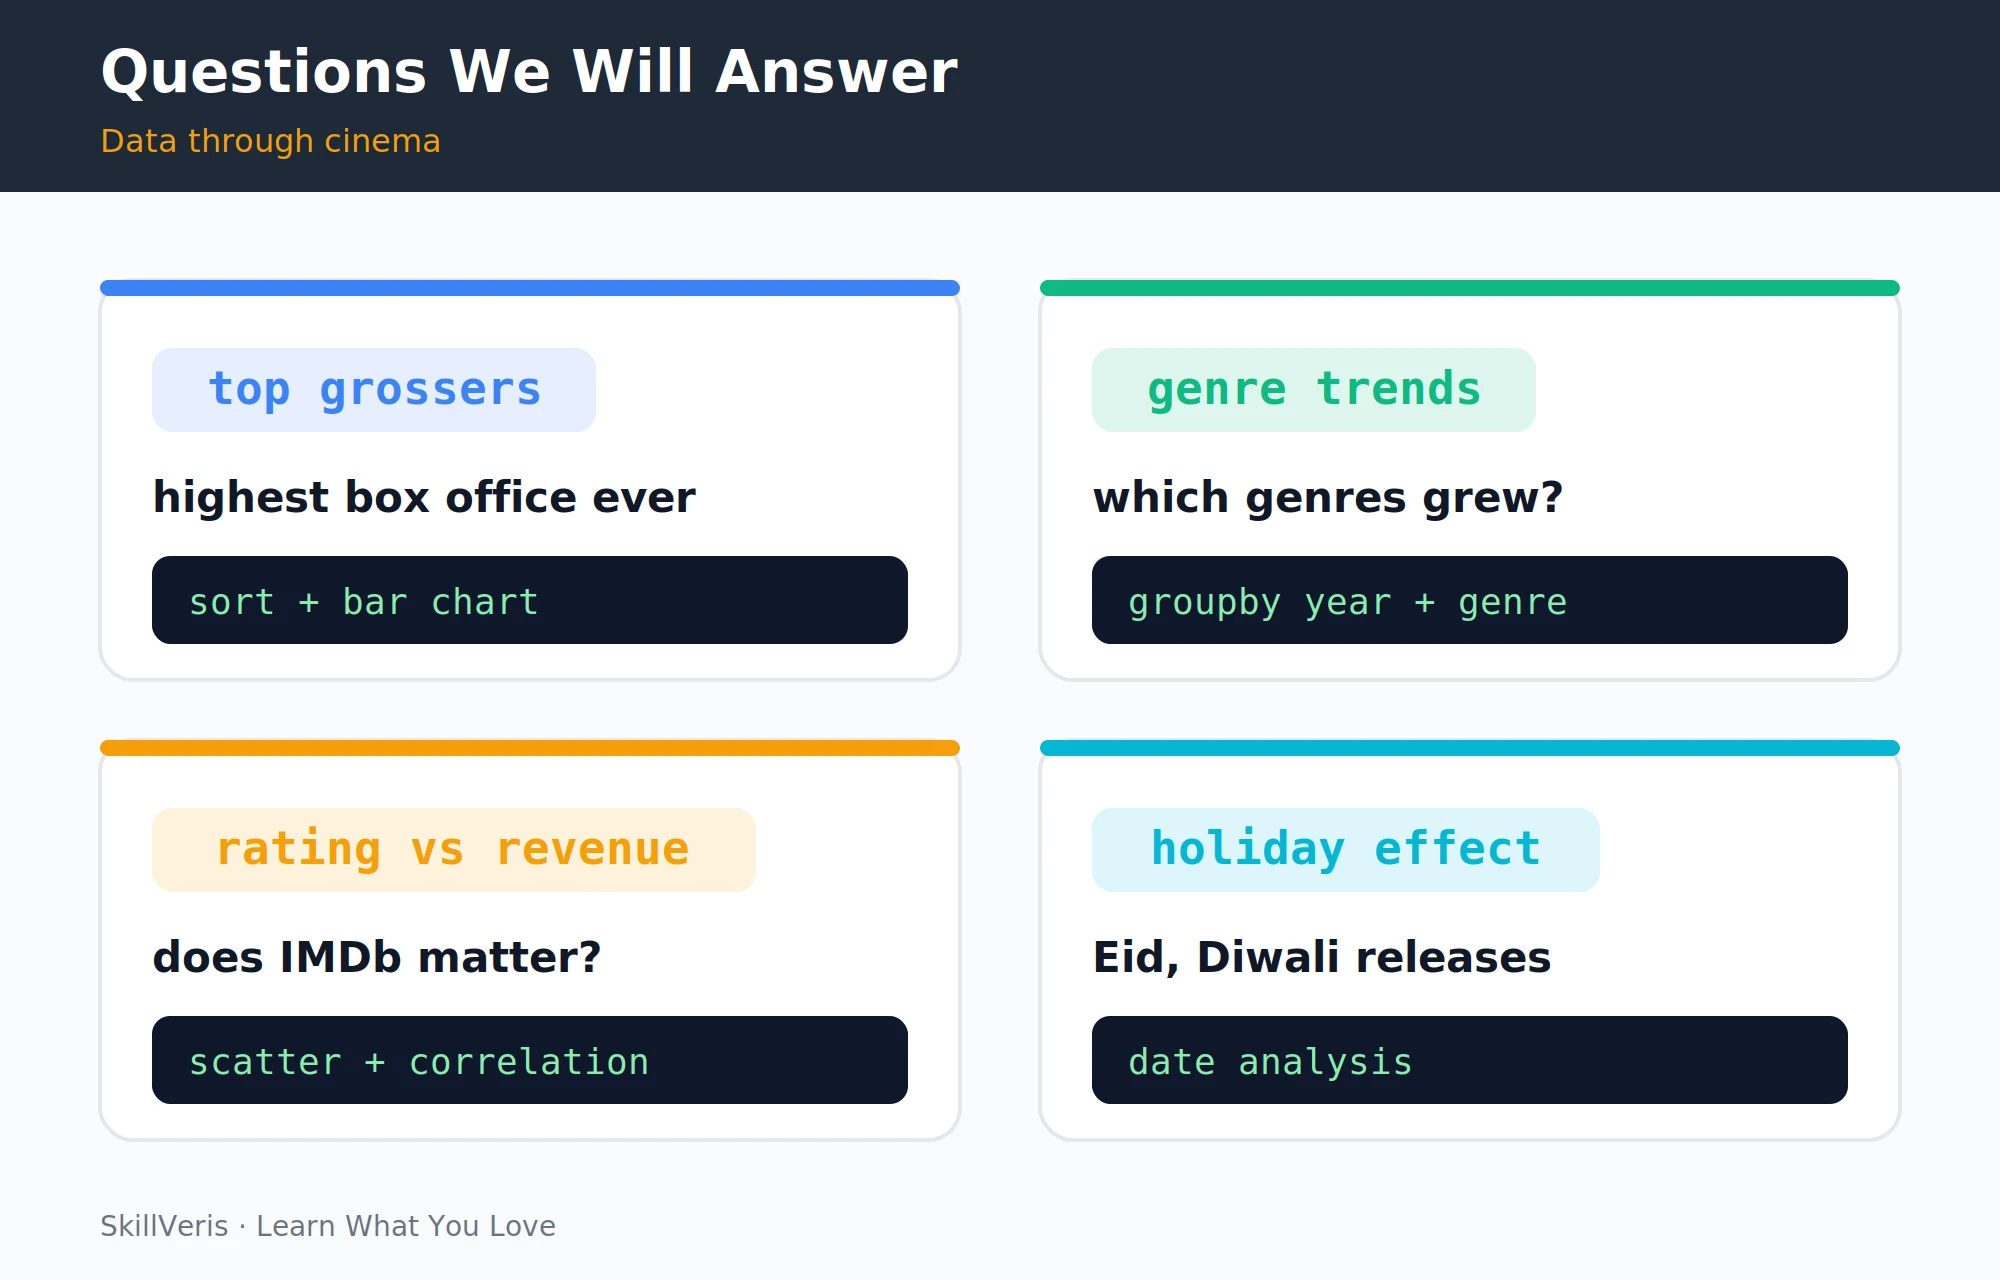
In this guide, you'll learn:
- Bollywood box office data teaches groupby aggregation, correlation analysis, time-series trends, and matplotlib visualisation.
- The explode() function cleanly handles columns that pack multiple comma-separated values into one cell.
- Use median rather than mean for box office analysis, because blockbusters distort means dramatically.
- A weak correlation between IMDb rating and revenue is a genuine insight, not a data artefact.
1Why Bollywood Data?
Hindi cinema is one of the world's most prolific film industries, producing 100 to 200 mainstream releases a year with rich accompanying data: box office collections, IMDb ratings, release dates, genres, directors, and stars. This data teaches the same skills as any business dataset, including groupby, correlation, time-series, and sorting.
The difference is motivation: you actually care whether Pathaan or KGF 2 has better ROI. When the data connects to something you love, the drive to clean it, explore it, and go deeper is intrinsic rather than forced.
2Getting the Dataset
Several Bollywood datasets are available for free, and any of them with a few hundred films and a collection column will work for every analysis in this guide. For this walkthrough, assume a CSV named bollywood_box_office.csv with columns for title, year, director, genre, budget_cr, collection_cr, imdb_rating, and release_month (where cr means crore INR).
- Kaggle: search 'Bollywood movies dataset' or 'Hindi box office'; several CSVs include 1000+ films with box office, IMDb rating, director, cast, and genre.
- IMDb datasets: imdb.com/interfaces/ provides downloadable TSV files with global film data including Indian cinema.
- Box Office Mojo: scrape-able but check the terms; Kaggle re-distributions are cleaner for learning.
3Loading and Exploring
Start by loading the CSV with pandas and taking a first look at its shape, head, data types, and null counts. Every real dataset needs cleaning before analysis.
Here, coerce the collection column to numeric and drop rows with no collection data, then describe() the column to get a quick statistical summary.
Load and clean
Read the CSV, inspect it, and coerce the collections column.
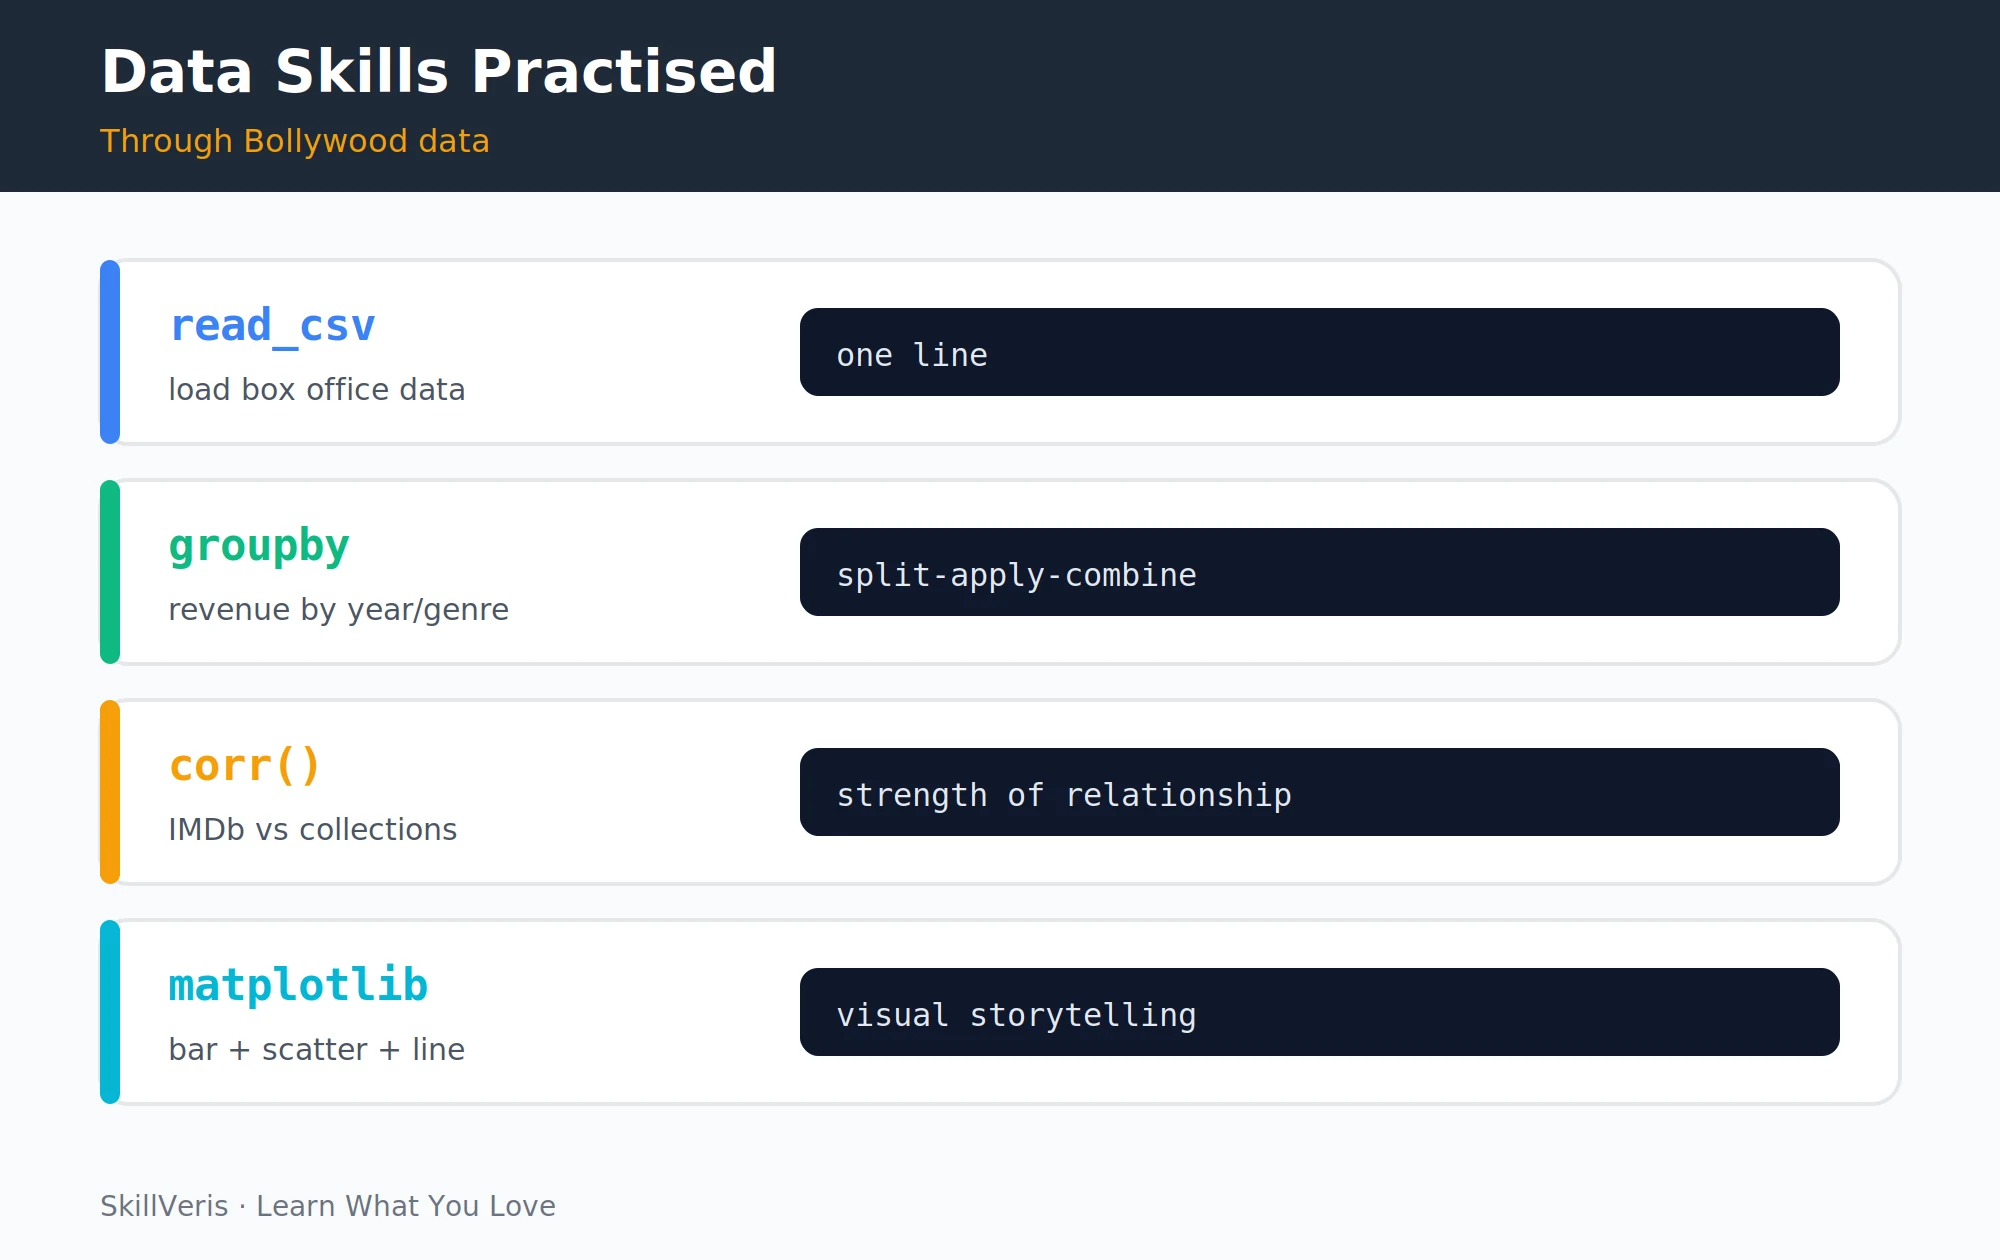
import pandas as pd
import matplotlib.pyplot as plt
df = pd.read_csv("bollywood_box_office.csv")
# First look
print(df.shape)        # (n_films, n_columns)
print(df.head(3))
print(df.dtypes)
print(df.isnull().sum())   # nulls per column
# Clean: fill missing collections with NaN, drop rows with no collection data
df["collection_cr"] = pd.to_numeric(df["collection_cr"], errors="coerce")
df = df.dropna(subset=["collection_cr"])
# Summary stats
print(df["collection_cr"].describe())4Top 10 Grossing Films of All Time
Sorting by collection and taking the top 10 is the simplest meaningful query, and a horizontal bar chart presents it well. A horizontal layout is ideal here because film titles are long and read naturally across the page.
This is also a clean first matplotlib exercise: set a figure size, draw the bars, label the axes, and save the figure.
Top 10 bar chart
nlargest selects the films and barh draws them horizontally.
# Sort by collection, take top 10
top10 = (df.nlargest(10, "collection_cr")
         [["title", "year", "collection_cr"]])
print(top10.to_string(index=False))
# Bar chart
fig, ax = plt.subplots(figsize=(10, 6))
ax.barh(top10["title"][::-1], top10["collection_cr"][::-1], color="#f59e0b")
ax.set_xlabel("Box Office Collections (Crore INR)")
ax.set_title("Top 10 Highest-Grossing Bollywood Films", fontsize=14, fontweight="bold")
ax.grid(axis="x", alpha=0.3)
plt.tight_layout()
plt.savefig("top10_grossers.png", dpi=150)
plt.show()5Box Office by Decade
Creating a decade column with integer division lets you aggregate collections over time and reveal long-run trends. Group by decade and sum the collections to see which eras earned most in total.
Using median instead of mean for per-film analysis is a deliberate choice: a single blockbuster like KGF 2 or Pathaan can make the mean unrepresentative of a typical film in that decade.
Aggregating by decade
Derive a decade column, then sum and take the median per decade.
# Create decade column
df["decade"] = (df["year"] // 10) * 10
# Total collections per decade
decade_totals = (df.groupby("decade")["collection_cr"]
                 .sum()
                 .reset_index())
# Median (not mean - protects against blockbuster outliers)
decade_medians = df.groupby("decade")["collection_cr"].median()
plt.figure(figsize=(10, 5))
plt.bar(decade_totals["decade"].astype(str), decade_totals["collection_cr"],
        color="#3b82f6", width=8)
plt.title("Total Box Office Collections by Decade", fontsize=14, fontweight="bold")
plt.xlabel("Decade")
plt.ylabel("Total Collections (Crore INR)")
plt.tight_layout()
plt.show()6Genre Analysis: Which Genres Earn Most?
Many films list multiple genres in a single cell, such as 'Action, Drama'. The explode() function takes a column containing lists and creates one row per list item, expanding the DataFrame so each genre can be analysed separately.
After exploding, group by genre and compute the median collection, keeping only genres with at least ten films so the comparison is meaningful. explode() is the right tool any time a single cell holds multiple comma-separated values.
Exploding genres
Split, explode, and aggregate per genre.
# Some films have multiple genres e.g. "Action, Drama"
# Explode on comma to analyse each genre separately
df_genres = df.copy()
df_genres["genre"] = df_genres["genre"].str.split(",")
df_genres = df_genres.explode("genre")
df_genres["genre"] = df_genres["genre"].str.strip()
# Median collections per genre (min 10 films)
genre_stats = (df_genres.groupby("genre")
               .agg(median_cr=("collection_cr", "median"),
                    film_count=("title", "count"))
               .query("film_count >= 10")
               .sort_values("median_cr", ascending=False))
print(genre_stats.head(10))7Does IMDb Rating Predict Collections?
A scatter plot of IMDb rating against box office collection, combined with a Pearson correlation coefficient, tests whether quality predicts revenue. The typical result is a weak positive correlation, around r of 0.2 to 0.4.
The scatter almost always shows that many low-rated films are commercial hits while critically acclaimed films often underperform. This is a genuine insight about the film industry and a clean lesson about the difference between correlation and causation.
Scatter and correlation
Plot rating against revenue and compute the correlation.
# Scatter plot: IMDb rating vs box office
clean = df.dropna(subset=["imdb_rating", "collection_cr"])
fig, ax = plt.subplots(figsize=(9, 6))
ax.scatter(clean["imdb_rating"], clean["collection_cr"],
           alpha=0.4, color="#8b5cf6", s=30)
ax.set_xlabel("IMDb Rating")
ax.set_ylabel("Box Office Collection (Cr INR)")
ax.set_title("IMDb Rating vs Box Office: Does Quality Predict Revenue?",
             fontsize=13, fontweight="bold")
plt.tight_layout()
plt.show()
# Pearson correlation coefficient
r = clean["imdb_rating"].corr(clean["collection_cr"])
print(f"Pearson r = {r:.3f}")
# Typical result: r ~ 0.2-0.4 (weak positive - quality helps but doesn't determine revenue)8Holiday Release Effect
Mapping release months to festival seasons such as Eid, Diwali, and Christmas tests whether timing boosts collections. Use the month as a proxy, map it to a season label, and compute the median collection per season.
The result typically shows Eid and summer releases with significantly higher median collections. That is partly selection bias, since studios release their biggest films at peak times, but the pattern is real and matches industry intuition.
Season medians
Map months to seasons and compare median collections.
# Does releasing on Eid, Diwali, or Christmas boost collections?
# Month proxies: Eid varies (April-June), Diwali Oct-Nov, Christmas Dec
holiday_months = {4: "Eid/Summer", 5: "Eid/Summer", 6: "Eid/Summer",
                  10: "Diwali", 11: "Diwali", 12: "Christmas"}
df["season"] = df["release_month"].map(holiday_months).fillna("Regular")
season_median = (df.groupby("season")["collection_cr"]
                 .median()
                 .sort_values(ascending=False))
print(season_median)9Director and Actor Impact
Grouping by director and computing the median collection, with a minimum film count, surfaces the most consistently bankable filmmakers. You can also track a single director's trajectory over time to see whether they are improving or declining.
Plotting one director's films by year, sorted chronologically, turns the data into a simple career arc you can read at a glance.
Director performance and trend
Rank directors by median, then chart one director over time.
# Directors with highest median collections (min 5 films)
director_perf = (df.groupby("director")
                 .agg(median_cr=("collection_cr", "median"),
                      films=("title", "count"))
                 .query("films >= 5")
                 .sort_values("median_cr", ascending=False)
                 .head(10))
print(director_perf)
# Trend: is a director improving or declining?
sanjay_films = df[df["director"] == "Rajkumar Hirani"].sort_values("year")
plt.plot(sanjay_films["year"], sanjay_films["collection_cr"], marker="o")
plt.title("Rajkumar Hirani: Box Office Over Time")
plt.show()10Building a Dashboard
Once your individual charts work, combine them into a single multi-panel figure using a 2x2 grid of subplots. A shared title and tight layout turn four separate plots into one cohesive dashboard.
For an interactive version, deploy the same analysis as a Streamlit app instead of a static image.
Multi-panel figure
Arrange four charts into one dashboard figure.
fig, axes = plt.subplots(2, 2, figsize=(16, 10))
fig.suptitle("Bollywood Box Office Analytics Dashboard",
             fontsize=18, fontweight="bold")
# Top 10 bar chart in axes[0,0]
# Decade totals in axes[0,1]
# Genre medians in axes[1,0]
# IMDb scatter in axes[1,1]
plt.tight_layout()
plt.savefig("bollywood_dashboard.png", dpi=150, bbox_inches="tight")
plt.show()11Extending the Analysis
Once the core analysis is in place, there are many directions to take it further, from ROI calculations to star-power breakdowns and predictive modelling. Each extension reinforces a different data science skill.
- Budget vs collection: calculate ROI for each film and find which genres give the best return.
- Star power: split the cast column, explode by actor, and calculate median collections per lead actor.
- Sentiment analysis: fetch review data and correlate sentiment scores with box office.
- Predictive model: use scikit-learn to predict collections from budget, genre, director, and release month.
12Key Takeaways
Bollywood data teaches the same pandas skills as any business dataset, with built-in motivation to keep exploring.
- Bollywood data teaches the same pandas skills as any business dataset, with built-in motivation to explore.
- explode() handles comma-separated multi-value columns cleanly.
- Use median rather than mean for box office analysis, because blockbusters distort means dramatically.
- A weak correlation (r~0.3) between rating and revenue is a genuine insight: quality and commercial success are related but far from the same thing.
13Start Analysing
Continue your data science journey by deepening the techniques used here and turning the analysis into something interactive.
- Pandas for Beginners: a deep dive on every technique used in this guide.
- Data Visualisation Best Practices: improve your charts.
- Build a Streamlit Dashboard: turn this analysis into an interactive app.
14Frequently Asked Questions
Where can I find a good Bollywood dataset? Kaggle has several; search 'Bollywood movies' or 'Hindi box office'. The IMDb datasets at imdb.com/interfaces/ include Indian films and are comprehensive but require filtering. For a simpler start, any Kaggle dataset with 500+ films and box office collection columns will work for all the analyses here.
What currency is typically used in Bollywood box office data? Indian Rupees, usually in crores, where one crore equals 10 million rupees. Some datasets mix currencies or use worldwide collections that include foreign revenue, so check the column description and normalise to a single currency before cross-film comparisons.
Can I do this analysis for Hollywood or Tamil/Telugu films? Absolutely. The same pandas code works on any film dataset with box office and rating columns. The Hollywood dataset from IMDb and Box Office Mojo is even richer, and Tamil and Telugu cinema have their own robust datasets on Kaggle. The analysis patterns transfer entirely; only the data changes.
Is this a good portfolio project? Yes, especially if you add genuine insights rather than just a top-10 list. Frame the analysis around a question such as 'Does releasing on Eid guarantee a hit?' and show the data-supported answer. A project with a clear question, honest analysis, and a surprising insight is far more memorable than a generic exploratory notebook.
Related Reading
Get The Print Version
Download a PDF of this article for offline reading.
About the Publisher
SkillVeris Team
Content Team
We believe the best way to learn tech is through what you already love — sports, music, photography, and more.
View all postsRelated Posts



Never miss an update
Get the latest tutorials and guides delivered to your inbox.
No spam. Unsubscribe anytime.